Review Guide Student - Enrichment Plus
Review Guide Student - Enrichment Plus
Review Guide Student - Enrichment Plus

You also want an ePaper? Increase the reach of your titles
YUMPU automatically turns print PDFs into web optimized ePapers that Google loves.
<strong>Student</strong><br />
<strong>Review</strong> <strong>Guide</strong><br />
S<br />
BIOLOGY I<br />
REVISED EDITION<br />
A<br />
T<br />
P<br />
2<br />
Mississippi<br />
2010 Science Framework
Mississippi SATP2 Biology I<br />
<strong>Student</strong> <strong>Review</strong> <strong>Guide</strong><br />
Authors:<br />
Kelly D. Berg<br />
Cecilia L. Boles<br />
2010 Mississippi<br />
Science Framework<br />
Published by <strong>Enrichment</strong> <strong>Plus</strong>, LLC<br />
PO Box 2755<br />
Acworth, GA 30102<br />
Toll Free: 1-800-745-4706 • Fax 678-445-6702<br />
Web site: www.enrichmentplus.com
Mississippi SATP2 Biology I <strong>Student</strong> <strong>Review</strong> <strong>Guide</strong><br />
based on the Mississippi 2010 Science Framework<br />
by<br />
Kelly D. Berg<br />
Cecilia L. Boles<br />
Kelly D. Berg<br />
Project Coordinator and Executive Editor<br />
<strong>Enrichment</strong> <strong>Plus</strong>, LLC<br />
Publisher<br />
All rights reserved<br />
Copyright 2011 <strong>Enrichment</strong> <strong>Plus</strong>, LLC<br />
Publishing rights to <strong>Enrichment</strong> <strong>Plus</strong>, LLC<br />
The text and graphics of this publication, or any part thereof, may not be reproduced or transmitted in any form or by<br />
any means, electronic or mechanical, including photocopying, recording, storage in an information retrieval system, or<br />
otherwise, without the prior written permission of the copyright holder.<br />
This publication includes some images from CorelDRAW versions 8, 9, 10, X3, and X5, which are protected by the<br />
copyright laws of the United States, Canada, and elsewhere. Used under license. Some images also acquired from<br />
© 2011 www.clipart.com.<br />
Karytotype images on page 262 and in Practice Test page PT2-17 are used with permission: “GENETIC<br />
COUNSELING AIDS” Fourth Edition, Copyright 2002 by the Greenwood Genetic Center.<br />
041511/041511TE
Table of Contents<br />
The Authors/Acknowledgments 5 Section 6<br />
Preface/How to Use This Book 6 Cell Structure and Function<br />
6.1 Prokaryotic and Eukaryotic Cells<br />
145<br />
Pre-test 7 6.2 Cell Organelles<br />
148<br />
Pre-test Evaluation Chart 30 6.3 Plant and Animal Cells<br />
152<br />
6.4 Cellular Organization<br />
155<br />
Section 1 Section 6 <strong>Review</strong> 159<br />
Equipment, Procedures, and Safety<br />
1.1 Length and Measurement 31 Section 7<br />
1.2 Temperature 34 Cellular Transport<br />
1.3 Liquid Measurement and Handling 36 7.1 Introduction to Homeostasis and<br />
1.4 Mass and Weight Measurements 39 Cellular Transport<br />
163<br />
1.5 Microscopes 42 7.2 Passive Transport: Diffusion<br />
165<br />
1.6 Equipment Used for Heating 47 7.3 Passive Transport: Osmosis<br />
167<br />
1.7 Laboratory Safety and Protective Equipment 50 7.4 Active Transport, Endocytosis, and Exocytosis 172<br />
Section 1 <strong>Review</strong> 56 Section 7 <strong>Review</strong> 175<br />
Section 2 Section 8<br />
Scientific Experiments<br />
Cellular Energy<br />
2.1 Using the Scientific Method<br />
59 8.1 ATP<br />
177<br />
2.2 Setting Up Experiments<br />
64 8.2 Aerobic and Anaerobic Cellular Respiration 180<br />
2.3 Using Tables to Organize and Interpret Data 70 8.3 Photosynthesis<br />
184<br />
2.4 Determining Validity of Experiments 73 8.4 Relationship Between Cellular Respiration<br />
Section 2 <strong>Review</strong> 77<br />
and Photosynthesis<br />
Section 8 <strong>Review</strong><br />
187<br />
189<br />
Section 3<br />
Analyzing Scientific Experiments Section 9<br />
3.1 Using Line Graphs to Organize and Interpret<br />
Cellular Reproduction<br />
Data 81 9.1 The Cell Cycle and Mitosis<br />
193<br />
3.2 Using Bar Graphs to Organize and Interpret 9.2 Sexual Reproduction and Meiosis<br />
197<br />
Data 88 9.3 Gamete Production 202<br />
3.3 Using Pie Graphs to Organize and Interpret Data 91 9.4 Asexual Reproduction 203<br />
3.4 Using Diagrams to Organize and Interpret Data 93 9.5 Sexual Reproduction 206<br />
Section 3 <strong>Review</strong> 95 Section 9 <strong>Review</strong> 208<br />
Section 4 Section 10<br />
Biochemical Concepts<br />
Basic Genetics<br />
4.1 Characteristics of Living Things<br />
99 10.1 Introduction to Mendelian Genetics<br />
213<br />
4.2 The Atom 100 10.2 Monohybrid Crosses<br />
217<br />
4.3 Elements and the Periodic Table 102 10.3 Human Autosomal Genetic Diseases 223<br />
4.4 Reactivity 105 Section 10 <strong>Review</strong> 227<br />
4.5 Covalent and Ionic Bonding<br />
108<br />
4.6 The Chemistry of Water<br />
111 Section 11<br />
4.7 Ions and pH<br />
115 Applied Genetics<br />
Section 4 <strong>Review</strong> 120 11.1 Dihybrid Crosses 229<br />
11.2 Incomplete Dominance and Codominance 232<br />
Section 5 11.3 Linked and Sex-Linked Genes 236<br />
The Components of Life 11.4 Pedigrees 240<br />
5.1 Organic Chemistry<br />
123 Section 11 <strong>Review</strong> 244<br />
5.2 Carbohydrates<br />
126<br />
5.3 Lipids<br />
129 Section 12<br />
5.4 Proteins<br />
133 Molecular Genetics and Technology<br />
5.5 Nucleic Acids 135 12.1 DNA, Genes, and Chromosomes 249<br />
5.6 Enzymes 137 12.2 DNA Replication<br />
251<br />
5.7 Macronutrient <strong>Review</strong> 140 12.3 Transcription and Translation<br />
253<br />
Section 5 <strong>Review</strong> 142 12.4 Genetic Mutations<br />
259<br />
12.5 DNA Technology<br />
264<br />
Section 12 <strong>Review</strong> 269<br />
SATP2 Biology I<br />
© 2011 <strong>Enrichment</strong> <strong>Plus</strong>, LLC<br />
3 Introduction<br />
Table of Contents
Section 13 Section 18<br />
Evolutionary Theory<br />
Biogeochemical Cycles<br />
13.1 Spontaneous Generation and Biogenesis 273 18.1 The Water Cycle<br />
385<br />
13.2 The Theory of Evolution 276 18.2 The Carbon Cycle<br />
387<br />
13.3 Ideas on the Origin of Life 281 18.3 The Oxygen Cycle<br />
390<br />
13.4 The Evolution of Cells 284 18.4 The Nitrogen Cycle<br />
391<br />
13.5 Classification 287 Section 18 <strong>Review</strong> 393<br />
Section 13 <strong>Review</strong> 291<br />
Section 19<br />
Section 14<br />
Environmental Interdependence<br />
Evidence of Change 19.1 Introduction to Ecology 395<br />
14.1 <strong>Review</strong> of Natural Selection 295 19.2 Ecological Relationships 397<br />
14.2 Diversity in Gene Pools 299 19.3 The Flow of Energy in Ecosystems<br />
400<br />
14.3 Speciation 304 19.4 Food Chains, Food Webs, and<br />
14.4 Evidences of Evolution 306 Energy Pyramids 403<br />
14.5 Patterns of Evolution 310 Section 19 <strong>Review</strong> 408<br />
Section 14 <strong>Review</strong> 312<br />
Section 20<br />
Section 15<br />
Biomes<br />
Kingdom Classification<br />
20.1 Tundra and Desert Biomes<br />
411<br />
15.1 The Six Kingdom System<br />
315 20.2 Forest Biomes 414<br />
15.2 Kingdoms of Archaebacteria and Eubacteria 318 20.3 Grassland Biome 417<br />
15.3 Kingdom Protista<br />
322 20.4 Terrestrial Biome <strong>Review</strong> 419<br />
15.4 Kingdom Fungi<br />
326 20.5 Aquatic Biomes 420<br />
Section 15 <strong>Review</strong> 329 Section 20 <strong>Review</strong> 423<br />
Section 16<br />
Kingdom Plantae<br />
Section 21<br />
Changes in Ecosystems<br />
16.1 Overview of Plants<br />
333 21.1 Population Factors 425<br />
16.2 Non-Vascular Plants (Bryophytes) 336 21.2 Population Interdependence 428<br />
16.3 Seedless Vascular Plants 339 21.3 Ecological Succession<br />
431<br />
16.4 Gymnosperms 342 21.4 Human Impact on Ecosystems 433<br />
16.5 Angiosperms 345 Section 21 <strong>Review</strong> 437<br />
16.6 Plant Cells and Tissues 348<br />
16.7 Plant Adaptations 352 Appendix: Periodic Table A-1<br />
Section 16 <strong>Review</strong> 356<br />
Index A-2<br />
Section 17<br />
Kingdom Animalia Practice Test A separate booklet<br />
17.1 Overview of Animals<br />
359 (with evaluation chart)<br />
17.2 Sponges and Cnidarians 363<br />
17.3 Worms 365 Practice Test B separate booklet<br />
17.4 Mollusks and Echinoderms 367 (with evaluation chart)<br />
17.5 Arthropods 369<br />
17.6 Invertebrate <strong>Review</strong> 371<br />
17.7 Chordates and Vertebrates 373<br />
17.8 Animal Adaptations 377<br />
Section 17 <strong>Review</strong> 382<br />
SATP2 Biology I<br />
© 2011 Jerald D. Duncan<br />
4 Introduction<br />
Table of Contents
Preface<br />
The Mississippi SATP2 Biology I <strong>Student</strong> <strong>Review</strong> <strong>Guide</strong> is written to help students review the skills needed to pass<br />
the Biology I end-of-course test in Mississippi. This comprehensive guide is based on the 2010 Mississippi Biology I<br />
Framework Competencies as correlated by the Mississippi State Department of Education.<br />
How To Use This Book<br />
<strong>Student</strong>s:<br />
The Biology I end-of-course test is required for graduation. You must pass the state end-of-course test, which contains<br />
a total of 70 multiple-choice questions (60 scorable and 10 field-test). This book is a review for the Biology I end-ofcourse<br />
test.<br />
Take the pre-test at the front of this book. The pre-test gauges your knowledge of Biology I content that will be<br />
tested on the end-of-course test. The pre-test is designed to identify areas that you need to review.<br />
Score the pre-test. Using the pre-test evaluation chart, circle the questions that you answered incorrectly.<br />
For each question that you missed on the pre-test, review the corresponding sections in the book. Read the<br />
instructional material, do the practice exercises, and take the section review tests at the end of each section.<br />
After reviewing the material, take the two practice tests (provided as separate booklets). These practice tests are<br />
written to look similar to the actual Biology I end-of-course test, so they will give you practice in taking the test.<br />
After taking Practice Test 1 and/or Practice Test 2, use the practice test evaluation charts, which are found<br />
directly after each practice test, to identify areas for further review and practice. The practice test evaluation<br />
charts can be used in the same way as the pre-test evaluation chart.<br />
Teachers:<br />
This review guide is also intended to save you, the teacher, time in the classroom. It can be used for classroom<br />
instruction or for individual student review. Since this student guide offers review for ALL of the Mississippi<br />
Curriculum Framework for the Biology I course, you, the teacher, have one consolidated resource of materials to help<br />
your students prepare for the end-of-course test.<br />
When teaching or tutoring individual students, use the strategy outlined above for students. By taking the pretest,<br />
students can identify areas that need improvement. The pre-test evaluation chart directs the student to the<br />
sections they need to review for instruction and additional practice.<br />
For classroom study, use this guide to supplement lesson plans and to give additional review for skills required<br />
by the Biology I Framework Competencies. Purchase a class set of guides for use in the classroom or assign<br />
guides to students for out-of-classroom work.<br />
Assign the practice tests (provided in separate booklets) as comprehensive review tests. Score the tests according<br />
to the scoring directions given on pages PT1-1 and PT2-1 of the testing booklets to approximate the scoring<br />
potential for the actual SATP2 test.<br />
Use the practice test evaluation charts found after each practice test to identify areas needing further review.<br />
To establish benchmarks, you may want to use one of the practice tests (provided in separate booklets) as a pretest.<br />
Score the practice test according to the practice test scoring directions given on pages PT1-1 and PT2-1 of<br />
the testing booklets. Then after the students have completed all the exercises in this review guide, use the second<br />
practice test to gauge progress. You should see marked improvement between the initial and final benchmarks.<br />
Please DO NOT photocopy materials from this guide or the practice test booklets. These materials are intended<br />
to be used as student workbooks, and individual pages should not be duplicated by any means without<br />
permission from the copyright holder. To purchase additional or specialized copies of sections in this book,<br />
please contact the publisher at 1-800-745-4706.<br />
SATP2 Biology I<br />
© 2011 Jerald D. Duncan<br />
6 Introduction<br />
Preface
Biology I<br />
Pre-Test<br />
Introduction<br />
Introduction<br />
The pre-test that follows is designed to identify areas where you can improve your skills before or after taking the<br />
Biology I end-of-course test. This pre-test will be similar in format to the Mississippi SATP2 end-of-course test for<br />
Biology I.<br />
Directions<br />
Read the directions on the following page. These directions should be similar to what you will see on the actual<br />
SATP2 end-of-course test for Biology I. Once you have completed this pre-test, circle the questions you answered<br />
incorrectly on the pre-test evaluation chart on page 30. For each question that you missed on the pre-test, review the<br />
corresponding sections in the book as given in the evaluation chart. Read the instructional material, do the practice<br />
exercises, and take the section review tests at the end of each section.<br />
Scoring the Pre-Test<br />
The following pre-test can be used as practice for the SATP2 Biology I test, but it is primarily a diagnostic tool to help<br />
you identify which skills you can improve in order to prepare better for the actual test. Any pre-test question answered<br />
incorrectly may identify a skill needing improvement or mastery. <strong>Review</strong> the corresponding skill(s) indicated in the<br />
Pre-Test Evaluation Chart by reading the instructional material on the given pages and completing the practice<br />
exercises and reviews. By reviewing each skill, you will improve mastery of the material to be tested on the SATP2<br />
Biology I test and potentially increase the score you receive on that test. (The practice tests, which are given in<br />
separate booklets, are provided to give you additional practice taking tests similar to the actual SATP2 Biology I test.)<br />
SATP2 Biology I<br />
© 2011 <strong>Enrichment</strong> <strong>Plus</strong>, LLC<br />
7 Pre-Test
1 The bottle of a chemical used in a biology<br />
laboratory is labeled with the following symbol.<br />
4 Look at the pedigree graphic below.<br />
KEY<br />
normal<br />
male<br />
normal<br />
female<br />
affected<br />
male<br />
carrier<br />
female<br />
What does this laboratory safety symbol indicate<br />
about the chemical?<br />
A<br />
B<br />
C<br />
D<br />
It should be heated first before it is used.<br />
It evaporates easily and should be used only<br />
under a vent hood.<br />
It is corrosive and should not be allowed to<br />
contact the skin.<br />
It is flammable and should not be used around<br />
open flames.<br />
This pedigree shows that only males are affected<br />
by a certain disorder. What type of inheritance is<br />
indicated by the pedigree?<br />
F<br />
G<br />
H<br />
J<br />
recessive<br />
dominant<br />
incomplete<br />
sex-linked<br />
A B C D<br />
F G H J<br />
2 Which of the following is NOT found in a<br />
carbohydrate?<br />
5 Which two processes cycle carbon and oxygen<br />
between living organisms?<br />
F<br />
Carbon<br />
A<br />
Oxidation and combustion<br />
G<br />
Hydrogen<br />
B<br />
Transpiration and condensation<br />
H<br />
Nitrogen<br />
C<br />
Pollination and fertilization<br />
J<br />
Oxygen<br />
D<br />
Cellular respiration and photosynthesis<br />
F G H J<br />
A B C D<br />
3 In which circumstance would a high rate of<br />
mutation in a population be beneficial to the<br />
population?<br />
6 Millions of acres of rainforests are destroyed<br />
each year. Which of the following is a negative<br />
result of this human activity?<br />
A<br />
B<br />
C<br />
D<br />
Only if the environment is very stable<br />
Only if the environment is changing rapidly<br />
Only if the environment is changing very<br />
slowly over a long period of time<br />
In any environment regardless of its stability<br />
F<br />
G<br />
H<br />
J<br />
A decrease in atmospheric carbon dioxide<br />
A decrease in biodiversity<br />
An increase in atmospheric oxygen<br />
An increase in precipitation<br />
A B C D F G H J<br />
SATP2 Biology I<br />
© 2011 <strong>Enrichment</strong> <strong>Plus</strong>, LLC<br />
9 Pre-Test
30 A diagram of a food web is shown below.<br />
grass insect frog snake<br />
Which of the following organisms gets the MOST energy directly from the sun?<br />
F<br />
G<br />
H<br />
J<br />
frog<br />
grass<br />
insect<br />
snake<br />
F G H J<br />
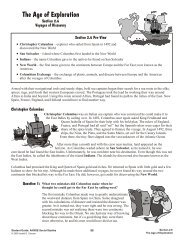
31 The graph below is a climatogram of Limon, Costa Rica.<br />
450<br />
Climatogram of Limon, Costa Rica<br />
40<br />
400<br />
30<br />
Avg. Monthly<br />
Precipitation (mm)<br />
350<br />
300<br />
250<br />
200<br />
150<br />
20<br />
10<br />
0<br />
–10<br />
–20<br />
Avg. Monthly<br />
Temperature (°C)<br />
100<br />
–30<br />
50<br />
–40<br />
Precipitation<br />
Jan Feb Mar Apr May Jun Jul Aug Sep Oct Nov Dec<br />
–50<br />
Temperature<br />
Which behavioral adaptation would be seen in animals in this biome?<br />
A<br />
B<br />
C<br />
D<br />
Likely to hibernate during winter months<br />
Prefer to live in trees to escape predators<br />
Dig deep underground tunnels to get to water<br />
Likely to migrate during dry months<br />
A B C D<br />
SATP2 Biology I<br />
© 2011 <strong>Enrichment</strong> <strong>Plus</strong>, LLC<br />
16 Pre-Test
Biology I<br />
Pre-Test<br />
Evaluation Chart<br />
Circle the questions you answered incorrectly on the chart below, and review the corresponding sections in the book. Read the<br />
instructional material, do the practice exercises, and take the section review tests at the end of each section.<br />
If you missed<br />
question #:<br />
1<br />
2<br />
3<br />
4<br />
5<br />
6<br />
7<br />
8<br />
9<br />
10<br />
11<br />
12<br />
13<br />
14<br />
15<br />
16<br />
17<br />
18<br />
19<br />
20<br />
21<br />
22<br />
23<br />
24<br />
25<br />
26<br />
27<br />
28<br />
29<br />
30<br />
Go to<br />
section(s):<br />
1.7<br />
5.2<br />
14.1, 14.2<br />
10.1, 10.2, 10.3, 11.3, 11.4<br />
8.2, 8.3, 8.4, 18.2, 18.3<br />
21.4<br />
2.1<br />
5.6<br />
14.2<br />
19.2, 19.3, 19.4<br />
15.1, 15.2, 15.3, 16.1<br />
4.2, 4.3, 4.4, 4.5, 4.6, 5.1<br />
6.2, 6.3<br />
17.7<br />
10.1, 10.2, 11.3<br />
14.1, 14.2<br />
10.1, 10.2, 10.3<br />
16.6<br />
21.4<br />
3.1<br />
14.1, 14.2<br />
13.3<br />
16.1, 16.2, 16.3<br />
4.6<br />
17.1, 17.2, 17.3, 17.4, 17.5, 17.6<br />
10.1, 10.2<br />
4.7, 5.6<br />
12.1, 12.2<br />
7.2<br />
19.3, 19.4<br />
If you missed<br />
question #:<br />
31<br />
32<br />
33<br />
34<br />
35<br />
36<br />
37<br />
38<br />
39<br />
40<br />
41<br />
42<br />
43<br />
44<br />
45<br />
46<br />
47<br />
48<br />
49<br />
50<br />
51<br />
52<br />
53<br />
54<br />
55<br />
56<br />
57<br />
58<br />
59<br />
60<br />
Go to<br />
section(s):<br />
17.8, 20.1, 20.2<br />
12.3<br />
6.2, 6.3, 8.2, 8.3<br />
1.6, 1.7<br />
9.1<br />
13.4<br />
9.1<br />
3.1<br />
16.7, 20.1<br />
9.2<br />
2.3, 2.4<br />
17.8, 20.3<br />
4.7<br />
13.2<br />
9.2, 12.4<br />
6.2<br />
14.2, 14.3, 14.4<br />
4.7<br />
8.1, 8.2, 8.3<br />
12.3<br />
5.4<br />
17.7, 17.8, 20.1, 20.2, 20.3<br />
17.8, 20.2<br />
1.1, 1.3<br />
10.1, 10.2<br />
1.5<br />
9.4<br />
21.1, 21.4<br />
2.1, 2.2, 2.3<br />
6.1<br />
If you missed<br />
question #:<br />
61<br />
62<br />
63<br />
64<br />
65<br />
66<br />
67<br />
68<br />
69<br />
70<br />
71<br />
72<br />
73<br />
74<br />
75<br />
76<br />
77<br />
78<br />
79<br />
80<br />
81<br />
82<br />
83<br />
84<br />
85<br />
Go to<br />
section(s):<br />
12.1<br />
11.3, 11.4<br />
9.1<br />
6.4, 16.6<br />
14.4, 14.5<br />
10.1, 10.2, 11.2<br />
13.2<br />
2.3<br />
10.1, 10.2, 11.1<br />
15.2, 15.4, 19.3<br />
10.1, 10.2, 10.3, 11.4<br />
18.4<br />
12.5<br />
19.2<br />
12.5, 13.5<br />
7.3<br />
13.1<br />
12.2, 12.4<br />
6.4<br />
13.4<br />
9.1, 9.2, 9.3<br />
15.1<br />
16.6<br />
6.4<br />
14.1, 14.2<br />
SATP2 Biology I<br />
© 2011 <strong>Enrichment</strong> <strong>Plus</strong>, LLC<br />
30 Pre-Test
Equipment, Procedures,<br />
and Safety<br />
Section 1.1<br />
Length and Measurement<br />
Pre-View 1.1<br />
Ruler or meter stick – equipment used in the laboratory to measure length in<br />
millimeters, centimeters, or meters<br />
Meter – metric unit for length<br />
Accuracy – the correctness of a measurement or how close the measurement is to the actual value<br />
Precision – the exactness of a measurement in terms of how many decimal places are used; determined by<br />
the smallness of the increments used in the measurement; can also be a measure of how reproducible or<br />
repeatable the data is<br />
In general, biology is the scientific study of living things. Various types of equipment are used when studying biology,<br />
especially when conducting laboratory experiments. Biologists often use this equipment to make measurements. In<br />
your study of biology, it is important to know the names of some basic equipment and glassware and to understand<br />
when and how they are used. It is also important for you to know how to make meaningful measurements.<br />
Measuring Length in a Laboratory<br />
One of the most basic laboratory measurements is length. Just about everyone knows how to use a ruler to measure<br />
the length of an object, but scientists must measure length using metric units instead of feet and inches. A ruler or<br />
meter stick with metric units usually has several types of marks. The smallest marks indicate millimeters (mm). By<br />
the way, these marks are also called graduation marks or graduations. Graduation marks are found on many types of<br />
scientific equipment, so you will see this term again.<br />
The centimeter ruler shown in figure 1-1 is<br />
drawn to scale. There are 1000 mm in one<br />
meter. The longer marks that are numbered<br />
show centimeters — 10 mm = 1 cm, and there<br />
are 100 cm in one meter. A man who is six feet<br />
tall is around 1.8 meters tall (or 1 meter, 80<br />
centimeters). The “.8” means eight-tenths, and<br />
eight-tenths of a meter is 80 centimeters.<br />
1 cm 10 mm<br />
1 2 3 4 5 6 7 8 9<br />
Fig. 1-1 Centimeter Ruler (To Scale)<br />
A large paperclip is approximately 3 cm long.<br />
Much longer lengths or distances are measured in kilometers (km), which are 1000 meters. One mile is about<br />
1.6 kilometers.<br />
Some scientific equipment is digital and gives a number on a readout. Other pieces of equipment, like rulers and<br />
meter sticks, require you to determine the measurement by manually reading a scale. In the real world, measurements<br />
rarely fall exactly at a graduation mark. Most of the time, the reading falls between two graduation marks. To get the<br />
reading, you simply estimate between the marks. Look at an example.<br />
SATP2 Biology I<br />
© 2011 <strong>Enrichment</strong> <strong>Plus</strong>, LLC<br />
31<br />
Section 1.1<br />
Equipment, Procedures, and Safety
Performing<br />
Scientific Experiments<br />
Section 2.2<br />
Setting Up Experiments<br />
Experiment – a set of steps used to test a hypothesis<br />
Data – observations, measurements, and other information gathered in an experiment<br />
Quantitative data – measured data; data associated with numbers or specific amounts<br />
Qualitative data – descriptive data; data not associated with numbers or amounts<br />
Control group – the group that is used for comparison; it does not receive the tested element<br />
Experimental group – a group that receives one element being tested<br />
Bias – a belief or opinion that may affect experimental results<br />
Unbiased – having no opinion or being impartial<br />
Pre-View 2.2<br />
Placebo – a substance given to a control group that has no effect on the experiment but is used to eliminate<br />
bias<br />
Constants – factors that remain the same for all groups during an experiment<br />
Variable – a factor that is changed during an experiment in order to test its effect<br />
Independent variable – the variable used to produce an effect<br />
Dependent variable – the measurable change that occurs because of the independent variable<br />
An experiment is a set of steps that are performed to collect data. The data can then be used either to prove or to<br />
disprove the hypothesis. The experiment must be designed carefully so that the data collected gives meaningful<br />
information. The following questions should be considered when designing an experiment.<br />
<br />
<br />
<br />
<br />
Designing an Experiment<br />
What data should be collected and how? Will there be a placebo used?<br />
How many groups will be used?<br />
What are the important constants?<br />
How many subjects per group should be used?<br />
What is the independent variable?<br />
What will be the control group?<br />
What is the dependent variable?<br />
Data<br />
Data is any information gathered during an experiment. Measured data, such as length, mass,<br />
pH, temperature, or time of day is called quantitative data. Remember, a quantity is an amount<br />
of something, so quantitative data deals with numbers or amounts. The data recorded in most<br />
experiments is quantitative. Descriptive data, on the other hand, is called qualitative data. Color,<br />
odor, taste, feel, or any other described quality is considered qualitative data.<br />
Many kinds of information can be recorded during an experiment. However, the only data that<br />
should be collected in an experiment is the information that can be used to prove or disprove the<br />
hypothesis. The scientist must decide which information is important to record and which isn’t.<br />
SATP2 Biology I<br />
© 2011 <strong>Enrichment</strong> <strong>Plus</strong>, LLC<br />
64 Section 2.2<br />
Performing Scientific Experiments
Section 3.1, continued<br />
Using Line Graphs<br />
to Organize and Interpret Data<br />
Plant Height<br />
(in cm)<br />
y-axis<br />
y-axis label<br />
90<br />
80<br />
70<br />
60<br />
50<br />
40<br />
30<br />
20<br />
10<br />
y-axis scale<br />
(10 cm increments)<br />
x-axis scale<br />
(1 week increments)<br />
Well-Constructed Graph<br />
Tomato Plant Height Over Time<br />
1 2 3 4 5<br />
Weeks<br />
line<br />
data points<br />
x-axis label<br />
title<br />
x-axis<br />
The graph on the left is a good example of how a line<br />
graph should be drawn.<br />
Title: The title of a graph should give a general<br />
explanation of the data shown by the graph. In this<br />
example, the title is “Tomato Plant Height Over Time.”<br />
Axes and Labels: The x and y axes should be labeled to<br />
show what kind of data is being given. In this case, the<br />
x-axis represents “weeks” and the y-axis represents<br />
“plant height in centimeters.”<br />
Scale: The scale is shown by the numbers that are<br />
labeled on the x and y axes. In this example, the x-axis<br />
has a scale of one week per increment. The y-axis has a<br />
scale that is marked in 10-centimeter increments.<br />
Plant Height<br />
(in cm)<br />
100<br />
50<br />
200<br />
150<br />
Poorly-Constructed Graph<br />
Plant Data<br />
1 2 3 4 5<br />
Weeks<br />
Do you recognize all the reasons this graph is poorly<br />
constructed?<br />
Title: Although this graph does have a title, it is not very<br />
descriptive of the data represented. For example, it<br />
doesn’t tell what kind of plant.<br />
Axes and Labels: The x-axis and the y-axis are correctly<br />
labeled, but they are crooked. Be sure that you use a<br />
straight edge when drawing graphs by hand, and you will<br />
probably want to use graph paper as well.<br />
Scale: When constructing a graph, choose a scale so that<br />
your data fills the space. In this example, the poorly<br />
chosen scale causes the data to fill only a small corner of<br />
the graph. Also, increments should be equally spaced.<br />
Notice that the spacing between the weeks is not equal.<br />
When constructing line graphs, remember the following: Use a descriptive title that explains the data. Label the x and<br />
y axes and give the units. In the examples above, labeling the y-axis as “Plant Height” is useless unless you also give<br />
the units. Likewise, labeling the x-axis as “Time” would not be an appropriate label. No one would know what the 1,<br />
2, 3, 4, or 5 represented — days, weeks, months, etc. Use an appropriate scale so that your data is spread out over the<br />
length and width of the graph. And of course, be very neat by drawing straight lines to represent your axes.<br />
SATP2 Biology I<br />
© 2011 <strong>Enrichment</strong> <strong>Plus</strong>, LLC<br />
82<br />
Section 3.1<br />
Analyzing Scientific Experiments
Section 3 <strong>Review</strong>, continued<br />
Read about the following experiment, study the graph, and answer the questions that follow.<br />
The Beefmaster tomato plant is a variety that produces large tomatoes ideal for slicing and using on<br />
sandwiches. An experiment is performed to determine how the amount of rain, or watering, affects the height<br />
of Beefmaster tomato plants. Seedlings of equal height were planted in four large tubs. Each tub contained<br />
three plants, and all plants received the same amount of sunlight and fertilizer. The only difference was the<br />
amount of water that each tub received. The data from the experiment is summarized in the graph below.<br />
Effect of Water Amount on Beefmaster Tomato Plant Height<br />
200<br />
Average. Plant Height in centimeters<br />
150<br />
100<br />
50<br />
Tub 1, 1 L/day<br />
Tub 2, 3 L/day<br />
Tub 3, 5 L/day<br />
Tub 4, 10 L/day<br />
0<br />
0 1 2 3 4 5 6 7 8<br />
Weeks<br />
6. Which of the following conclusions is supported by the graph?<br />
F<br />
G<br />
H<br />
J<br />
Rain helps tomato plants produce healthy, firm tomatoes.<br />
Beefmaster tomato plants grow taller than other varieties.<br />
Beefmaster tomato plants die when they are over-watered.<br />
Beefmaster tomato plants grow taller when they receive more water.<br />
F G H J<br />
7. Based on the graphed data, which of the following would be a logical prediction?<br />
A<br />
B<br />
C<br />
D<br />
Beefmaster tomato plants will thrive in gardens that are consistently watered.<br />
Beefmaster tomato plants will grow taller when they are planted in tubs.<br />
Beefmaster tomato plants will need more sunlight and fertilizer when planted in a garden.<br />
Beefmaster tomato plants will grow well during a drought.<br />
A B C D<br />
SATP2 Biology I<br />
© 2011 <strong>Enrichment</strong> <strong>Plus</strong>, LLC<br />
97<br />
Section 3 <strong>Review</strong><br />
Analyzing Scientific Experiments
Biochemical Concepts<br />
Section 4.6<br />
The Chemistry of Water<br />
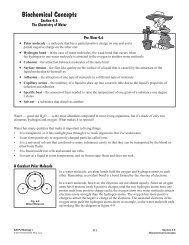
Pre-View 4.6<br />
Polar molecule – a molecule that has a partial positive charge on one end and a<br />
partial negative charge on the other end<br />
Hydrogen bond – in the case of water molecules, the weak bond that occurs when<br />
the hydrogen in one water molecule is attracted to the oxygen in another water molecule<br />
Cohesion – the attraction between molecules of the same kind<br />
Surface tension – the film-like quality on the surface of a liquid that is caused by the attraction of the<br />
liquid molecules to themselves<br />
Adhesion – the attraction of one type of molecule to a different type of molecule<br />
Capillary action – the tendency of a liquid to draw up into a narrow tube due to the liquid’s properties of<br />
cohesion and adhesion<br />
Specific heat – the amount of heat needed to raise the temperature of one gram of a substance one degree<br />
Celsius<br />
Solvent – a substance that dissolves another<br />
Water — good old H O — is the most abundant compound in most living organisms, but it’s made of only two<br />
2<br />
elements, hydrogen and oxygen. What makes it so special?<br />
Water has many qualities that make it important to living things:<br />
• It is transparent, so it lets sunlight pass through it to reach organisms that live underwater.<br />
• It can form positively or negatively charged particles called ions.<br />
• It is a universal solvent that can dissolve many substances easily so that they can be transported by the blood or<br />
other body fluids.<br />
• It is found inside our cells and around our cells.<br />
• It exists as a liquid at room temperature, and its frozen state floats and does not sink.<br />
A Covalent Polar Molecule<br />
In a water molecule, covalent bonds hold the oxygen and hydrogen atoms to each<br />
other. Remember, a covalent bond is a bond formed by the sharing of electrons.<br />
H<br />
O<br />
Fig. 4-9<br />
Water Molecule<br />
H<br />
In a water molecule, however, the electrons are not shared equally. Since an oxygen<br />
atom has 8 protons (with 8 positive charges) and the two hydrogen atoms have one<br />
proton each (one positive charge each), the oxygen atom in a water molecule attracts<br />
electrons more strongly than the hydrogen atoms. The oxygen has more positive<br />
charge to attract the negative charge of the electrons. The unshared electrons in the<br />
oxygen atom push the hydrogen atoms down at an angle, so the water molecule ends<br />
up looking like the diagram in figure 4-9.<br />
SATP2 Biology I<br />
© 2011 <strong>Enrichment</strong> <strong>Plus</strong>, LLC<br />
111<br />
Section 4.6<br />
Biochemical Concepts
Section 5.6, continued<br />
Enzymes<br />
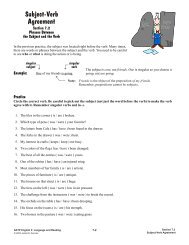
Both temperature and pH will change the shape of an enzyme. Since the shape of the enzyme affects how well it<br />
works on a substrate, enzymes work best at an optimum temperature and pH. Look at the graphs below that show<br />
how temperature and pH generally affect reaction rate.<br />
as temperature<br />
increases, reaction<br />
rate increases<br />
optimum<br />
temperature<br />
as temperature<br />
increases, reaction<br />
rate decreases<br />
as pH increases,<br />
reaction<br />
rate increases<br />
optimum<br />
pH<br />
as pH<br />
increases, reaction<br />
rate decreases<br />
reaction rate<br />
reaction rate<br />
temperature<br />
pH<br />
Although the shapes of the curves are a little different, they both show the same trend. They simply show that as<br />
temperature or pH increases, reaction rate increases until it gets to an optimum temperature or pH. Then the reaction<br />
rate decreases when temperature or pH gets any higher. What point on the graphs represents the optimum temperature<br />
and optimum pH? The optimum is represented by the highest peak on the curve. Generally, enzymes work well in a<br />
narrower pH range than temperature range, so the “hill” of the curve is narrower and steeper on the pH graph.<br />
Types of Enzymes<br />
Humans produce two types of enzymes: metabolic enzymes and digestive enzymes. Humans also obtain and use a<br />
third kind of enzyme, food enzymes, from eating raw foods. Remember, enzymes are needed to speed up the rate of<br />
reaction. Reactions that could take days to complete can be completed in minutes or hours when enzymes are used.<br />
Metabolic enzymes enable cells to perform cellular reactions. These reactions allow cells to make energy, repair<br />
tissues, and eliminate or neutralize wastes and toxic substances.<br />
Digestive enzymes are ones that may be<br />
more familiar to you. The name of a<br />
digestive enzyme usually ends in -ase, and<br />
the first part of the name often indicates<br />
what it helps to digest (or break down into<br />
smaller components). Look at the chart on<br />
the right for common digestive enzymes<br />
and the substances they digest. For<br />
example, lactase is an enzyme that breaks<br />
down lactose, the sugar found in milk, into<br />
the monosaccharides of galactose and<br />
Enzyme Breaks down —<br />
amylase<br />
lactase<br />
sucrase<br />
protease<br />
lipase<br />
Common Digestive Enzymes<br />
carbohydrates<br />
lactose (milk sugar)<br />
sucrose (table sugar)<br />
proteins<br />
fats<br />
Into products of —<br />
Disaccharides, monosaccharides<br />
galactose and glucose<br />
glucose and fructose<br />
polypeptides, amino acids<br />
glycerol and fatty acids<br />
glucose. These are only a few of many. As you can see in the chart, digestive enzymes help to digest the different<br />
types of macronutrients. They allow the body to break down food in hours instead of days.<br />
Food enzymes also help to break down the foods we eat. Since food enzymes are destroyed at high temperatures, they<br />
are only found in uncooked (raw) foods or from supplements. Consuming food enzymes from raw foods helps the<br />
body to digest the foods without causing as much strain on the body to produce additional digestive enzymes.<br />
SATP2 Biology I<br />
© 2011 <strong>Enrichment</strong> <strong>Plus</strong>, LLC<br />
138<br />
Section 5.6<br />
The Components of Life
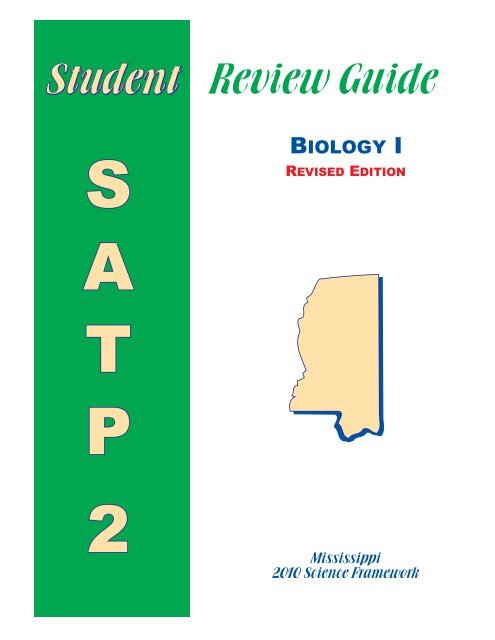
Section 6.3, continued<br />
Plant and Animal Cells<br />
Figure 6-5 below shows a labeled diagram of a typical plant and animal cell.<br />
Typical Plant Cell<br />
Typical Animal Cell<br />
cell wall<br />
cell membrane<br />
mitochondria<br />
centrioles<br />
vacuole<br />
chloroplasts<br />
nucleus<br />
ribosomes<br />
Golgi<br />
apparatus<br />
endoplasmic<br />
reticulum<br />
lysosome<br />
Fig. 6-5<br />
Both plant and animal cells can reproduce, but the way that they divide into new cells is different. Both have some<br />
cell processes such as cellular respiration that are similar. In cellular respiration, cells use oxygen to help break down<br />
glucose to release energy and carbon dioxide. You’ll see more about this process in Section 8.<br />
Special Animal Organelles<br />
Animal cells contain centrioles and lysosomes, neither of which are found in plant cells. Remember, centrioles play an<br />
important role in cell division, and lysosomes store enzymes that keep the cell free from debris.<br />
Special Plant Organelles<br />
From the chart on the previous page and the diagrams above, can you summarize a few things that are different<br />
between plant cells and animal cells? Hopefully, you see that the presence of a cell wall, the size of vacuoles, and the<br />
presence of chloroplasts make plant cells different. Let’s take a closer look at each of these.<br />
The Cell Wall<br />
Plant cells have cell walls, but animal cells do not. The cell wall in a plant cell is made of cellulose, a material unique<br />
to plant cells. Similar to starch, cellulose is a type of carbohydrate. (Cellulose is also known as “fiber,” an important<br />
part of a human diet.) The cell wall gives support and extra protection to the plant cell.<br />
Vacuoles<br />
Many plant cells have one large vacuole that is filled with water. The vacuole may take up 50% or more of the space<br />
inside the cell. Vacuoles are used to store water, salts, sugars, wastes, etc. In plants, they can help provide support for<br />
the cell. Most animal cells do not contain vacuoles, and when found in cells other than plant cells, the vacuoles are<br />
small. Single-celled organisms such as paramecium contain contractile vacuoles that help control fluid balance.<br />
Chloroplasts<br />
Only plant cells (and some types of algae) have chloroplasts, so they can go through a special process called<br />
photosynthesis. In photosynthesis plant cells use light energy, carbon dioxide, and water to produce oxygen and<br />
glucose. Remember that glucose is a monosaccharide carbohydrate, or in other words, a simple sugar. Also remember<br />
that glucose and other carbohydrates store energy. (See Section 5.2 if you need more review on carbohydrates.)<br />
Glucose molecules “link” together to form starch molecules, which are stored in plant cells for future use.<br />
SATP2 Biology I<br />
© 2011 <strong>Enrichment</strong> <strong>Plus</strong>, LLC<br />
153<br />
Section 6.3<br />
Cell Structure and Function
Cellular Energy<br />
Section 8.3<br />
Photosynthesis<br />
Pre-View 8.3<br />
Heterotrophs (also called consumers) – organisms, such as animals, that obtain energy by consuming<br />
plants and other animals<br />
Autotrophs (also called producers) – organisms, such as plants, that usually use energy directly from the<br />
sun to produce glucose and other carbohydrates<br />
Carbon fixation – the process of converting the inorganic carbon found in carbon dioxide to organic<br />
carbon in glucose<br />
Photosynthesis – process used by autotrophs that uses the sun’s energy to convert water and carbon<br />
dioxide to glucose (simple sugar) and oxygen<br />
Chlorophyll – the green pigment found in the chloroplasts of plant cells that absorbs energy from the sun<br />
and uses that energy in the first stage of photosynthesis<br />
Calvin cycle – the stage of photosynthesis that does not require light<br />
You know that all living things need energy, but where does that energy come from? In Sections 8.1 and 8.2, we<br />
discussed how energy comes from converting glucose (or simple sugar) into ATP, but where does the glucose come<br />
from? The sun is actually the main source of energy for living organisms although many organisms can’t use that<br />
energy in its original form. All living organisms live by releasing energy found in chemical compounds such as<br />
glucose, but some can also use energy directly from the sun to make glucose.<br />
Living organisms can be divided into two main groups: autotrophs and heterotrophs. Heterotrophs are organisms,<br />
such as animals, that get energy from the sun indirectly by consuming foods that have energy stored in them.<br />
Heterotrophs are also called consumers since they must consume food for energy. Autotrophs are organisms, such as<br />
plants, that can directly use the sun’s energy to produce energy-containing chemical compounds such as glucose and<br />
other carbohydrates. Autotrophs are also called producers since they can produce their own food.<br />
Through the process of photosynthesis, most autotrophs use the energy in sunlight to change water and carbon<br />
dioxide (CO ) into glucose and oxygen. The net equation for photosynthesis is shown in figure 8-10 below:<br />
2<br />
6CO 2 + 6H2O<br />
light energy C H O + 6<br />
carbon<br />
dioxide<br />
water<br />
Photosynthesis<br />
enzymes and chlorophyll<br />
Fig. 8-10<br />
6 12 6 O 2<br />
glucose<br />
(simple sugar) oxygen<br />
Do you remember the difference between organic and inorganic compounds that you saw in Section 4.1? You may<br />
remember that carbon dioxide is an inorganic compound even though it contains carbon. Glucose, on the other hand,<br />
is an organic compound. So photosynthesis converts carbon from an inorganic compound into an organic one. This<br />
conversion is called carbon fixation. (Hint: Carbon dioxide cannot be used as food for us as humans. Once plants<br />
convert it into glucose, it is “fixed” into food that we can eat. The glucose made by photosynthesis helps to make up<br />
the potatoes, apples, lettuce, wheat, etc. that we eat.)<br />
SATP2 Biology I<br />
© 2011 <strong>Enrichment</strong> <strong>Plus</strong>, LLC<br />
184 Section 8.3<br />
Cellular Energy
Cellular Reproduction<br />
Section 9.2<br />
Sexual Reproduction and Meiosis<br />
Pre-View 9.2<br />
Somatic cells – all cells except sex cells; for example: blood cells, liver cells, skin cells<br />
Sex cells (or gametes) – the cells other than somatic cells that are formed through a process called meiosis<br />
Meiosis – the process that forms the sex cells called gametes (ova and sperm cells)<br />
Haploid cells – sex cells produced through the process of meiosis that contain half the number of<br />
chromosomes for that organism; have an n number of chromosomes<br />
Diploid cells – somatic cells produced through the process of mitosis that contain the full number of<br />
chromosomes for that organism; have a 2n number of chromosomes<br />
Homologous chromosomes (or homologues) – the two chromosomes that make up each pair of human<br />
somatic cells (23 pairs for a total of 46 chromosomes in humans)<br />
Sex chromosomes – the pair of chromosomes that determines gender (male or female)<br />
Autosomes – the pairs of chromosomes that do not include the one pair of sex chromosomes and that do<br />
not determine gender<br />
Tetrad – homologous chromosomes paired together side by side during meiosis<br />
Crossing over – the exchange of DNA between paired homologous chromosomes during meiosis<br />
Gametes (Sex Cells)<br />
Organisms that reproduce sexually have two types of cells. As we reviewed in Section 9.1, the cells that make up the<br />
body of the organism are called somatic cells, and they reproduce through the process of mitosis. The other cells are<br />
called sex cells or gametes, and they are formed using a process called meiosis.<br />
Meiosis occurs only in reproductive cells to form egg cells and sperm cells. Unlike mitosis, meiosis does not produce<br />
two new genetically identical cells. Instead, the cells produced by meiosis are called haploid cells. Haploid cells have<br />
only half the usual number of chromosomes that other cells have. These cells are said to have an n number of<br />
chromosomes. Somatic cells are said to be diploid and contain the full number of chromosomes for any given<br />
organism. Somatic cells are said to have a 2n number of chromosomes. For example, human somatic cells have<br />
23 pairs of chromosomes for a total of 46 chromosomes. The diploid number of chromosomes for humans is 46.<br />
Human egg and sperm cells are haploid, which means they have only 23 chromosomes, not 23 pairs. When one egg<br />
with 23 chromosomes is fertilized by one sperm with 23 chromosomes, the offspring will have 46 chromosomes<br />
(23 pairs), the correct number for humans. If gametes were produced by mitosis, then each gamete would have<br />
46 chromosomes, and the first set of offspring would have 92 chromosomes — twice as many as normal!<br />
Somatic cells in an organism contain pairs of chromosomes that carry similar genetic information. The two<br />
chromosomes that make up each pair are called homologous chromosomes or homologues. One chromosome from<br />
each pair came from the mother’s egg cell, and the other chromosome for each pair came from the father’s sperm cell.<br />
Each pair of homologues contains similar information. For example, one pair of homologues will contain genes that<br />
determine eye color. One of the chromosomes may have information for blue eyes from the mother, and the other may<br />
have information for brown eyes from the father.<br />
SATP2 Biology I<br />
© 2011 <strong>Enrichment</strong> <strong>Plus</strong>, LLC<br />
197 Section 9.2<br />
Cellular Reproduction
Applied Genetics<br />
Section 11.1<br />
Dihybrid Crosses<br />
<br />
Pre-View 11.1<br />
Dihybrid cross – studying two traits crossed from parent organisms<br />
Law of Independent Assortment – a natural law that explains how traits are inherited independently of<br />
other traits<br />
So far we have looked at monohybrid crosses, which only study one trait at a time. Many times scientists study two or<br />
more traits at a time. Studying two traits at a time is called a dihybrid cross.<br />
When at least two traits at a time are studied, they illustrate the Law of Independent Assortment, which means that<br />
inheriting one trait doesn’t affect the inheritance of another trait. For instance, having brown eyes has nothing to do<br />
with having freckles. The genes are inherited independently of each other. Again, Mendel was the first to make these<br />
observations, so this law is often called Mendel’s Law of Independent Assortment. (You’ll see later how this “law”<br />
isn’t always true.)<br />
To show a dihybrid cross, let’s pick two different traits, such as handedness and freckles. Being right-handed (R) is<br />
dominant over being left-handed (r), and having freckles (F) is dominant over not having freckles (f).<br />
Let’s say that both the mother and the father are heterozygous for both traits. We can create a Punnett square of this<br />
dihybrid cross to analyze how these traits might appear in their children. The Punnett square is bigger and looks more<br />
complicated, but it really isn’t difficult to do. Just follow these steps.<br />
Step 1:<br />
First, pick a parent. The mother is heterozygous for both traits, (RrFf),<br />
so she has a dominant R gene and a recessive r gene. She also has a<br />
dominant F gene and a recessive f gene. She can pass on each of these<br />
traits independently to her children. What are the four possible<br />
combinations of these traits? They are RF, Rf, rF, and rf.<br />
1<br />
RrFf = RF<br />
3<br />
RrFf = rF<br />
2<br />
RrFf = Rf<br />
4<br />
RrFf = rf<br />
Step 2:<br />
Step 3:<br />
Next, consider the father. He is also heterozygous for both traits, so the combinations of traits are<br />
the same: RF, Rf, rF, and rf.<br />
Now fill in a Punnet square with these combinations. Since there are four combinations for each<br />
parent, the square is 4 × 4 instead of 2 × 2. But you fill it in the same way.<br />
Mother<br />
RF Rf rF rf<br />
RF<br />
RRFF<br />
RRFf<br />
RrFF RrFf<br />
Father<br />
Rf<br />
rF<br />
rf<br />
RRFf<br />
RRff<br />
RrFf Rrff<br />
RrFF RrFf rrFF rrFf<br />
RrFf Rrff rrFf rrff<br />
SATP2 Biology I<br />
© 2011 <strong>Enrichment</strong> <strong>Plus</strong>, LLC<br />
229<br />
Section 11.1<br />
Applied Genetics
Section 12.4, continued<br />
Genetic Mutations<br />
Remember, amino acids make up polypeptide chains, polypeptide chains make up proteins, and proteins are a vital<br />
component of living materials and carry out vital cellular processes. Remember also that genes in the DNA are made<br />
up of nucleotide sequences that are “read” in groups of threes similar to the three-word sentences shown on the<br />
previous page. The sequence of the letters in the mRNA determines the amino acid that is added to the polypeptide<br />
chain. If one or more amino acids added to that polypeptide chain are wrong, the organism will not be able to build<br />
proteins with the correct structure. Look at figure 12-7 to review the different types of gene mutations and how they<br />
affect protein production. Notice that the amino acids that make up the protein can change when different gene<br />
mutations occur. Gene mutations are sometimes called point mutations because the mutation occurs at only one point<br />
in the DNA. Insertions or deletions of a single nucleotide are also called frameshift mutations because they shift<br />
how the codons are read and can result in different amino acids being added to the protein. (Note: Since some<br />
nucleotide sequences “code” for the same amino acid, not all gene mutations result in a different amino acid.) Both<br />
point mutations and frameshift mutations may also create a stop codon, which will stop protein synthesis. The<br />
resulting protein will be shorter than it is supposed to be.<br />
Types and Examples of Gene Mutations<br />
U inserted<br />
Normal<br />
mRNA<br />
amino<br />
acids<br />
A G U C G G U G U A A G<br />
serine arginine cysteine lysine<br />
Insertion<br />
mRNA<br />
amino<br />
acids<br />
A G U C G G U U G U A A G<br />
serine arginine leucine<br />
different amino acid<br />
stop<br />
codon<br />
Substitution<br />
mRNA<br />
amino<br />
acids<br />
U substituted for G<br />
U deleted<br />
A G U C G G U U U A A G Deletion<br />
mRNA<br />
amino<br />
acids<br />
A G U C G G G U A A G<br />
serine arginine phenylal. lysine<br />
serine arginine valine<br />
different amino acid<br />
different amino acid<br />
Fig. 12-7<br />
Chromosome Mutations<br />
The other type of mutation is a chromosomal mutation, where the structure or<br />
numbers of chromosomes change. The structure of a chromosome can change if a<br />
part of a chromosome is broken off or lost during the processes of mitosis or<br />
meiosis. The following types of chromosomal mutations can occur by a change in<br />
chromosome structure.<br />
• A broken part can sometimes reattach to a sister chromatid and cause<br />
duplication of genetic information in one chromatid and deletion of genetic<br />
information in the other.<br />
• If the broken part reattaches backwards, it is called an inversion.<br />
• The broken part may also attach to another chromosome and is called<br />
translocation.<br />
Types and Examples<br />
of Chromosomal Mutations<br />
A B C D E<br />
F G H<br />
normal chromosome<br />
A B E<br />
deletion<br />
duplication<br />
F G H<br />
A B C D C D E F G H<br />
C B A D E F G H<br />
inversion<br />
In any of these cases, the genes on the broken portion of the chromosome are now<br />
in the wrong place. Figure 12-8 shows the different types of chromosomal<br />
mutations.<br />
C D M N O P<br />
translocation<br />
Q R<br />
Fig. 12-8<br />
SATP2 Biology I<br />
© 2011 <strong>Enrichment</strong> <strong>Plus</strong>, LLC<br />
260<br />
Section 12.4<br />
Molecular Genetics and Technology
Section 13.1, continued<br />
Spontaneous Generation<br />
and Biogenesis<br />
John Needham and Lazzaro Spallanzani<br />
Francesco Redi’s experiment proved to most that large living organisms, like flies, did not come from nonliving<br />
things. But about 100 years after Redi, the question over spontaneous generation was still debated, especially when it<br />
came to organisms that could now be observed with a microscope.<br />
In 1745, John Needham attempted to prove spontaneous generation does occur with microscopic organisms. At the<br />
time, it was known that heat kills living organisms. In an experiment, Needham heated chicken broth in a flask to kill<br />
all living microscopic organisms. He then let the flask and broth cool and sit. After some time, the broth became<br />
cloudy with microorganisms. This experiment gave Needham “proof” that microorganisms were created by the broth.<br />
Another scientist, Lazzaro Spallanzani, repeated Needham’s experiment, but Spallanzani suspected that the<br />
microorganisms were coming from the air. Spallanzani’s experiment removed the air from the flask by creating a<br />
partial vacuum after the broth had been heated. In Spallanzani’s experiment, no microorganisms grew, so he believed<br />
his experiment disproved spontaneous generation of microorganisms.<br />
Spallanzani’s experiment did not convince everyone because many believed that air was necessary for spontaneous<br />
generation to occur. Some believed that all Spallanzani proved was that spontaneous generation could not occur<br />
without air.<br />
Louis Pasteur<br />
Another hundred years passed by before Louis Pasteur finally<br />
Pasteur’s Swan-necked Flask<br />
designed an experiment that disproved spontaneous generation once<br />
and for all. In the late 1850s, Pasteur performed a variation of<br />
Needham’s and Spallanzani’s experiments. Pasteur sterilized broth<br />
by heating it, but he designed and used a special flask. See<br />
figure 13-2. The swan-like neck of the flask allowed air to enter,<br />
but it trapped microorganisms and other contaminants so that they<br />
could not reach the broth. Using this specially-designed flask,<br />
Pasteur was able to show that microorganisms lived in the air, but<br />
they were not formed by the air. He proved that microorganisms<br />
come from other microorganisms, not broth and air. Fig. 13-2<br />
Disproving the idea of spontaneous generation was just one of Pasteur’s contributions to science. He is considered the<br />
father of microbiology and of immunology. Pasteur was the first to determine that yeast were responsible for<br />
fermentation, an important process in the making of beer and wine. He also developed the germ theory, the idea that<br />
diseases are caused by microorganisms, and he created vaccines for rabies and anthrax. Pasteur created the process of<br />
pasteurization, the heating of milk or other liquids to kill harmful bacteria. His discoveries in microbiology led to<br />
antiseptic techniques still used by doctors and nurses today to prevent the spreading of diseases.<br />
Biogenesis<br />
Pasteur’s broth experiment led to the widely-accepted belief that living organisms come only from other living<br />
organisms. This belief became known as the law of biogenesis, a law that has been firmly established. A scientific law<br />
is a general fact of nature. Gravity, for example, is another scientific law.<br />
SATP2 Biology I<br />
© 2011 <strong>Enrichment</strong> <strong>Plus</strong>, LLC<br />
274<br />
Section 13.1<br />
Evolutionary Theory
Section 14.4, continued<br />
Evidences of Evolution<br />
Comparative Anatomy<br />
Another way that scientists look for evidence of change in species is by<br />
looking at similarities in living organisms.<br />
Homologous and Analogous structures: Homologous structures<br />
develop from the same tissues as embryos and have similar internal<br />
structures. They may look different on the outside, and they may have<br />
different functions. For example, if you looked at the forelimb of a bat, a<br />
human, a crocodile, and a bird, you would see that they all have the same<br />
skeletal structures — humerus, ulna, carpals, and radius — although they<br />
have different functions. See figure 14-1. These similarities suggest that<br />
they may have had a common ancestor long ago.<br />
Homologous structures should not be confused with analogous<br />
structures, structures that have similar functions but are not believed to<br />
have evolved from a common ancestor. A bird’s wing and a butterfly’s<br />
wing are analogous structures. Both have the same function, to enable<br />
flight, but these two types of wings are structurally very different.<br />
Homologous Structures<br />
human arm bird wing whale flipper<br />
Fig. 14-1<br />
Vestigial structures: Sometimes an animal has structures that seem to have no useful purpose now although they<br />
resemble structures that are useful in other species. These structures are called vestigial structures. The flightless<br />
wings of the ostrich, the sightless eyes of the cave salamander, and the pelvis bone found in some whales are<br />
considered examples of vestigial structures.<br />
Embryology: Embryos of many vertebrates look very similar, especially in the earliest stages of development. These<br />
physical similarities suggest that the organisms have genetic similarities as well. By looking at the similarities in<br />
embryological development, scientists can determine if two very different species might have had a common ancestor.<br />
Biogeography<br />
Plate tectonics theory explains that the surface or “crust” of the earth is divided into large plates that float on a semimolten<br />
layer underneath the earth’s surface. According to this theory, these plates continually move, and this<br />
movement explains earthquake and volcanic activity as well as continental drift. Continental drift is the movement of<br />
continents. Scientists believe that all land mass was once consolidated together in a single continent called Pangaea.<br />
Over time, the different continents have been formed as the plates of the earth drifted apart.<br />
Biogeography is the study of how plants and animals are distributed around the world. This distribution depends on<br />
the migration ability of a particular species and how plants and animals have been separated from one another over<br />
time by continental drift.<br />
Scientists use this distribution of organisms to figure out how and when species may have evolved. For example, some<br />
species are isolated to specific continents. Apes, including all fossils of apes, are found only in Africa and Asia.<br />
Marsupials, mammals with pouches, are found only in Australia. These species must have been separated from a<br />
common ancestor early in their history and then evolved differently. In other cases, species on a nearby island are<br />
similar but not exactly the same as those on the nearest mainland. Darwin made many of these observations about<br />
species on the Galapagos Islands. The explanation of how these different species may have evolved differently is<br />
explained by speciation, which you saw in Section 14.3.<br />
SATP2 Biology I<br />
© 2011 <strong>Enrichment</strong> <strong>Plus</strong>, LLC<br />
308<br />
Section 14.4<br />
Evidence of Change
Kingdom Plantae<br />
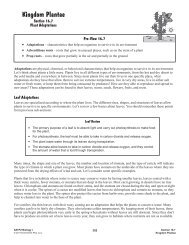
Section 16.7<br />
Plant Adaptations<br />
<br />
<br />
<br />
Pre-View 16.7<br />
Adaptations – characteristics that help an organism to survive in its environment<br />
Adventitious roots – roots that grow in unusual places, such as on the stem of a plant<br />
Prop roots – roots that grow partially in the air and partially in the ground<br />
Adaptations are physical, chemical, or behavioral characteristics that help an organism to survive in its environment.<br />
Let’s think about plants a little more. Plants live in all different types of environments, from the hot and dry desert to<br />
the cold tundra and everywhere in between. Since most plants live out their lives in one specific place, what<br />
adaptations do they have that allow them to survive extreme temperatures, live in very dry areas, live in either salt<br />
water or fresh water, or keep them from being consumed by predators? How are they able to reproduce and spread to<br />
new areas? These adaptations can be found in their leaves, stems, seeds, flowers, fruits, and roots.<br />
Leaf Adaptations<br />
Leaves are specialized according to where the plant lives. The different sizes, shapes, and structures of leaves allow<br />
plants to survive in specific environments. Let’s review a few basics about leaves. You should remember these points<br />
from previous sub-sections:<br />
Leaf <strong>Review</strong><br />
<br />
<br />
<br />
<br />
The primary purpose of a leaf is to absorb light and carry out photosynthesis to make food<br />
for the plant.<br />
For photosynthesis, the leaf must be able to take in carbon dioxide and release oxygen.<br />
The plant loses water through its leaves during transpiration.<br />
The stomata allow leaves to take in carbon dioxide and release oxygen, and they control<br />
the amount of water that is lost through transpiration.<br />
Many times, the shape and size of the leaves, the number and location of stomata, and the type of cuticle will indicate<br />
the type of climate in which a plant can grow. Most plants have stomata on the underside of the leaves where they are<br />
protected from the drying effects of wind and sun. Let’s consider some specific examples.<br />
Plants that live in habitats where water is scarce may conserve water by having smaller leaves, leaves coated with a<br />
thick waxy cuticle, fewer stomata, or stomata that are deep in the leaves. Most cacti growing in deserts have no true<br />
leaves. Chloroplasts and stomata are found on their stems, and the stomata are closed during the day and open at night<br />
when it is cooler. The spines of a cactus are modified leaves that have no chloroplasts and contain no stomata, so they<br />
reduce water loss to the plant. The spines also protect the cactus from herbivores, provide some shade to the plant, and<br />
help to channel rain water to the base of the plant.<br />
For conifers, the thin leaves with their waxy coating are an adaptation that helps the plants to conserve water. Many<br />
conifers can live in fairly dry climates. They also tolerate colder temperatures. By keeping most of their leaves, these<br />
plants can begin photosynthesis very early in the spring when plants without leaves are still dormant. Since they don’t<br />
have to produce an entire set of new leaves every year, they can grow in habitats where nutrients are not as available.<br />
SATP2 Biology I<br />
© 2011 <strong>Enrichment</strong> <strong>Plus</strong>, LLC<br />
352<br />
Section 16.7<br />
Kingdom Plantae
Section 17.8, continued<br />
Animal Adaptations<br />
Adaptations for Obtaining and Eating Food<br />
Many adaptations help animals get food. These adaptations can include the ability to hunt or graze, a keen sense of<br />
sight or smell, or even the different types of beaks that allow birds of different species to have very different diets.<br />
Some specific examples are given below.<br />
• Rattlesnakes and other snakes called pit vipers have special sense organs on each side of the head that alert the<br />
snakes to mice or other warm-blooded prey that are nearby.<br />
• Birds have a number of special adaptations that help them obtain and eat food. The keen eyesight of hawks and<br />
eagles allow them to spot their prey. Sharp claws called talons allow them to grasp their prey, and sharp beaks<br />
allow them to tear apart and eat their prey. On the other hand, birds like the finches have short, strong beaks for<br />
cracking and eating seeds. Pelicans have large beaks designed to catch and eat fish. Woodpeckers have long, sharp<br />
beaks best suited for finding and eating insects. Some of these beak adaptations can be seen in figure 17-3 below.<br />
• Some animals migrate in the fall to warmer climates with more plentiful food supplies. They migrate back to<br />
their original climates once weather and food conditions improve in the spring. Many different types of animals<br />
migrate, including birds, bats, fish, whales, elk, and butterflies. Even underground animals, such as termites and<br />
earthworms, “migrate” farther under the soil to find more favorable living conditions.<br />
• Baleen whales are filter feeders and have special structures to strain their food out of the water as they swim.<br />
• Herbivores, animals such as cows that eat only plants, have specially designed teeth to grind grasses and grains<br />
and special stomachs to digest them.<br />
• Carnivores, animals like those in the cat family that eat other animals, usually have sharp claws and teeth to catch<br />
and eat their prey. They may also have special coloration that camouflages them as they hunt.<br />
• Some animals use aggressive mimicry to lure prey to them. For example, the body of the angler fish resembles a<br />
rock. It uses a part of its spine as a lure, which looks like a much smaller fish, to lure prey to itself. Other animals<br />
may use scent or other signals to lure prey.<br />
• Animals may be nocturnal, active at night and asleep during the day, or diurnal, active during the day and asleep<br />
at night. Since most people are diurnal, we are usually more familiar with diurnal animals, the ones that are awake<br />
when we are. But, you probably know some nocturnal animals as well. Many nocturnal animals have extra large<br />
eyes to allow them to see their prey at night. They may also have a very keen sense of smell to help them locate<br />
food when it is dark.<br />
Examples of Bird Beak Adaptations<br />
short, strong beak for<br />
cracking seeds<br />
long, sharp beak for<br />
spearing fish<br />
sharp, hooked beak for<br />
tearing flesh<br />
Fig. 17-3<br />
SATP2 Biology I<br />
© 2011 <strong>Enrichment</strong> <strong>Plus</strong>, LLC<br />
378<br />
Section 17.8<br />
Kingdom Animalia
Environmental<br />
Interdependence<br />
Section 19.4<br />
Food Chains, Food Webs,<br />
and Energy Pyramids<br />
Pre-View 19.4<br />
Food chain – a simple representation of how energy is passed from a producer to consumers<br />
Food web – a more complex representation of how energy is passed from producers to consumers in an<br />
ecosystem<br />
Trophic level – each “step” in a food chain that represents how many times energy has been transferred from<br />
one organism to the next<br />
Energy pyramid – a representation in the shape of a pyramid that shows how energy is passed from one<br />
trophic level to the next<br />
Top consumer (or top predator) – animal at the top of a food chain; usually a carnivore that has no natural<br />
predators<br />
Food Chains<br />
The simple explanation for the flow of energy from autotrophs to heterotrophs is called a food chain. A simple<br />
example of a food chain is shown in figure 19-2.<br />
Example of a Food Chain<br />
grass energy energy<br />
grasshopper<br />
mouse energy snake energy hawk<br />
producer<br />
primary<br />
consumer<br />
secondary<br />
consumer<br />
tertiary<br />
consumer<br />
quaternary<br />
consumer<br />
Fig. 19-2<br />
In the food chain shown in figure 19-2, the grass is the producer. The grasshopper eats the grass, so it is the primary<br />
consumer. The grass gives energy to the grasshopper. The mouse eats the grasshopper, so the mouse is the secondary<br />
consumer. The mouse gets its energy from the grasshopper. The snake then eats the mouse. The snake is the tertiary<br />
consumer, which simply means “third level” consumer. The snake is then eaten by the hawk. The hawk is the<br />
quaternary consumer, or “fourth level” consumer. So you can see how a food chain represents how energy is passed<br />
from one organism to the next.<br />
Note: Don’t let the terms “tertiary” and “quaternary” scare you. “Tertiary” is another word for “third.” Quaternary is<br />
another word for “fourth.”<br />
Example 1:<br />
In the food chain given in figure 19-2, which organisms are predators? Which are prey?<br />
The mouse, the snake, and the hawk are all predators. The grasshopper is prey for the mouse, the mouse is prey<br />
for the snake, and the snake is prey for the hawk.<br />
SATP2 Biology I<br />
© 2011 <strong>Enrichment</strong> <strong>Plus</strong>, LLC<br />
403<br />
Section 19.4<br />
Environmental Interdependence
Changes in Ecosystems<br />
Section 21.1<br />
Population Factors<br />
Pre-View 21.1<br />
Carrying capacity – the largest number of organisms that can be supported to<br />
live in an ecosystem<br />
Logistic growth – natural population growth the follows an S-shapped pattern<br />
Limiting factors – things that limit how many organisms can live in a population<br />
Immigration – the movement of organisms into an area<br />
Emigration – the movement of organisms out of an area<br />
Density dependent factors – limiting factors that depend on the number of organisms in a population;<br />
examples: available food, water, and suitable habitats<br />
Density independent factors – limiting factors that do not depend on the number of organisms in a<br />
population; examples: natural disasters or human activities<br />
Exponential growth – unrestricted population growth that follows a J-shaped pattern<br />
Limiting Factors of Populations<br />
Initially, all populations in an ecosystem tend to increase in number. In a<br />
population that is new to an ecosystem, the population may grow slowly at first<br />
and then more quickly since the population will initially have unlimited resources.<br />
After a while, the rate of population growth slows down until it stops or levels off.<br />
It levels off when the environment has reached its carrying capacity, which is the<br />
largest number of organisms of a species that can be supported by the environment.<br />
Natural populations have a pattern of growth that follows an S-shaped curve as<br />
shown in figure 21-1. This S-shaped pattern is called logistic growth.<br />
Population Size<br />
Natural Population Growth<br />
(Logistic Growth)<br />
carrying capacity<br />
The population growth is limited by several main factors: the birth/death rate of<br />
organisms in the population, the number of organisms entering and leaving the<br />
Time<br />
population, and the amount of available resources. These factors are called limiting<br />
factors because they limit how large a population can grow. If the birth and death<br />
rates are about even, and the immigration and emigration rates are even, then availability of resources becomes the<br />
main limiting factor. (Immigration is the movement of organisms into an area, and emigration is the movement of<br />
organisms out of an area.) Limiting factors can be biotic or abiotic. A biotic factor for animals could be competition<br />
for or the availability of food. For plants, these factors might be abiotic, such as sunlight, water, soil, and nutrients.<br />
Fig. 21-1<br />
Example:<br />
Cacti grow in desert areas, but they are often well-spaced. Which of the following is<br />
the most likely limiting factor for cacti in a desert: sunlight, water, soil, or<br />
consumption by herbivores?<br />
In a desert climate, the most common limiting factor for plants is the availability of water. Desert<br />
plants get plenty of sunlight and have lots of space and sand to grow. Consumption by herbivores is<br />
probably not a main limiting factor. Instead, the number of herbivores that can survive in the desert<br />
is most likely determined by the number of plants that can grow to feed them.<br />
SATP2 Biology I<br />
© 2011 <strong>Enrichment</strong> <strong>Plus</strong>, LLC<br />
425<br />
Section 21.1<br />
Changes in Ecosystems