Jerome Delli Priscoli, PH.D - National Waterways Conference
Jerome Delli Priscoli, PH.D - National Waterways Conference
Jerome Delli Priscoli, PH.D - National Waterways Conference

Create successful ePaper yourself
Turn your PDF publications into a flip-book with our unique Google optimized e-Paper software.
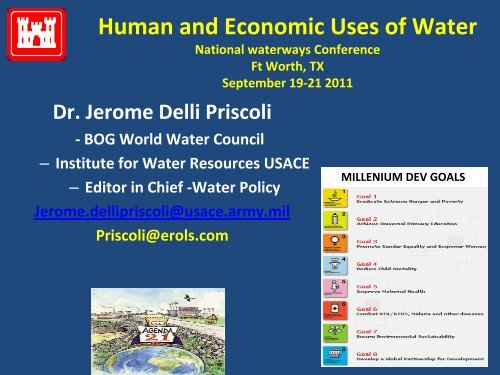
Human and Economic Uses of Water<br />
<strong>National</strong> waterways <strong>Conference</strong><br />
Ft Worth, TX<br />
September 19‐21 2011<br />
Dr. <strong>Jerome</strong> <strong>Delli</strong> <strong>Priscoli</strong><br />
‐ BOG World Water Council<br />
– Institute for Water Resources USACE<br />
– Editor in Chief ‐Water Policy<br />
<strong>Jerome</strong>.dellipriscoli@usace.army.mil<br />
<strong>Priscoli</strong>@erols.com<br />
MILLENIUM DEV GOALS
TWO STORIES
Imagine a Place Where:<br />
• 94% of property owners/98% of tenants have no electricity<br />
• 30% of owners/41% of tenants no toilets or outhouses<br />
• 65% of owners/ 78% of tenants must go 300 yards for water<br />
• 8% owners/3% tenants owned radios<br />
• Less the 50% of owners/25% tenants read newspapers<br />
• Less then 26% of owners/16% tenants own cars or trucks<br />
• Over 60% of the horsepower required was from horses/ 6% from electric<br />
stations<br />
• More then 90% have no lighting<br />
• More then 90% no refrigeration –thus loss of more then 25% of meat<br />
• Most live on subsistence farming<br />
• Over used ruined soil<br />
• Flooding serious and repetitive to soil and cities<br />
THIS IS NOT A PART OF AFRICA TODAY<br />
–IT IS THE TENNESSE VALLEY IN 1935
In a Generation ++<br />
• $224 million flood damages prevented<br />
– in Tenn valley –Ohio ‐ Miss rivers each year<br />
• $4.9 billion flood damages prevented in Chattanooga<br />
• $5.4 Billion in whole valley<br />
• Literacy almost 100%<br />
• Life expectancy in 70’s – small pox, malaria, typhoid gone<br />
• Industrial production up over 500% ‐vibrant silicon valley industry<br />
• Almost 700 miles of navigable water links to sea<br />
• Tonnage increased from 32 million ton‐miles in 1933 to 161 million<br />
ton‐miles in 1942.<br />
• Innovations in soil conservation,<br />
integrated watershed management,<br />
land use, non‐structural FC, other areas<br />
• Median incomes at national levels
Columbia River
Water Ways &Establishing <strong>National</strong> Federal<br />
Interventions Over Interstate Issues<br />
1808: Gallatin Report<br />
<strong>Waterways</strong> to be used for:<br />
Building Political Unity and Nation<br />
<strong>National</strong> Defense<br />
Economic Development<br />
Marshal<br />
Gibbons<br />
Ogden<br />
1824: GIBBONS VS. OGDEN<br />
(Estbl. Federal Powers vs. States)<br />
Claims are said to be repugnant–<br />
1st. To that clause in the constitution which<br />
authorizes Congress to regulate commerce.<br />
2d. To that which authorizes Congress to<br />
promote the progress of science and useful arts.<br />
1920’s -“308” Reports: Congress Authorizes USACE do Comp.<br />
assessments of all major rivers of the US
Lyndon Johnson,<br />
The Creator of U.S. War On Poverty<br />
On: Water, Role of Government,<br />
Water and Poverty, His Public Achievements<br />
Breaking the Cycle of Poverty<br />
Platform for Growth<br />
“Of all the endeavors on which I have worked<br />
In public life, I am proudest of the accomplishments<br />
In developing the Colorado River. It is not the damming<br />
of the stream or the harnessing of the Floods in which<br />
I take pride. But rather in the ending of the waste of the<br />
region. The region – so unproductive in my youth - Is now<br />
a vital part of the national economy and potential. More<br />
important, the wastage of human resources in the whole<br />
region. Has been reduced. Men and women have been<br />
released From the waste of drudgery and toil against the<br />
Unyielding rocks of the Texas hills. This is the true<br />
fulfillment of the true responsibilities of government”<br />
(Lyndon Johnson 1958)<br />
Water and People<br />
Mutli purposes
Key Lessons<br />
• Key to socio‐economic growth Building a minimum level<br />
of basic infrastructure development (for transport,<br />
hydroelectricity, flood and drought control, irrigation, water supply).<br />
Questions:<br />
• Need for multipurpose projects (i.e. power generation, flood &<br />
drought control, water supply, malaria eradication, promotion of improved<br />
Is this IWRM?<br />
farming techniques, access to credit)<br />
Can IWRM be Done w/o<br />
Importance of hydropower as a source of cheap electricity<br />
• Short‐term financing via government or other reliable<br />
resources. Infrastructure?<br />
• Medium to long‐term financing can be privately managed,<br />
using cross‐subsidies (i.e. between power and irrigation components)<br />
• Local decentralized IWRM not planning just technical<br />
projects respond to needs<br />
and better implementation<br />
IWRM includes political message
2. Context:<br />
World Water<br />
Situation
Poor and Privatization<br />
• Of the 100 recent cases ‐ 80% in<br />
middle income countries<br />
• A few International companies<br />
4‐5<br />
• The Poor pay far higher % of<br />
income:<br />
– $1/cm ‐ $2.50/cm on average<br />
– In US we pay $.30 ‐ $.80 on<br />
average<br />
– Connected poor pay $1/cm &<br />
unconnected $5.50‐$16.50/cm!<br />
Cochambamba Bolivia<br />
Increased Urbanization
7,000<br />
6,000<br />
5,000<br />
4,000<br />
3,000<br />
2,000<br />
1,000<br />
-<br />
Reservoir Storage per Capita (m3/cap), 2003<br />
4,717<br />
3,386<br />
2,486<br />
38<br />
1,104 1,277<br />
687<br />
5,961<br />
South Africa<br />
Mexico<br />
Thailand<br />
China<br />
Brazil<br />
Australia<br />
North America<br />
Ethiopia<br />
World Bank
TYPE AND DISTRIBUTION OF DISASTERS<br />
Type of water-related natural<br />
disasters, 1990-2001<br />
Distribution of water-related<br />
disasters, 1990-2001<br />
More than 2,200 major and minor water‐related disasters occurred in the<br />
world between 1990 and 2001. Asia and Africa were the most affected<br />
continents, with floods accounting for half of these disasters.<br />
Extracted from the Executive Summary of the World Water Development report. CRED (Centre for Research on the Epidemiology of Disasters). 2002.<br />
The OFDA/CRED International Disaster Database. Brussels, Université Catholique de Louvain.
3. Water Infrastructure<br />
Investment Matters<br />
•Can be correlations between<br />
capital investment in water and<br />
movements in private sector productivity<br />
•Investing in Managing Uncertainty Creates<br />
Platform for Growth<br />
•Ratio of non-structural/behavioral measures to<br />
structural measures matters:<br />
•If too high - extreme events can crack social<br />
system as leaders have no tools to respond<br />
•If too low - ecological costs are too high<br />
Myth of Soft Path = More Democratic
AFRICA<br />
Adaptive Security Matrix<br />
First-Order Resource Availability Expressed as Freshwater<br />
Availability in 1998 m 3 /cap/yr -1 X 10 3<br />
28 Namibia<br />
26<br />
24<br />
22<br />
20<br />
Congo DR<br />
18<br />
16<br />
Angola<br />
14<br />
Mozambique<br />
12<br />
Zambia<br />
10<br />
9<br />
Adaptively Insecure<br />
Botswana<br />
8<br />
7<br />
Tanzania<br />
Malawi<br />
Eritrea<br />
6<br />
Sudan<br />
5<br />
Swaziland<br />
4<br />
Uganda<br />
3<br />
Lesotho<br />
Ethiopia<br />
2<br />
Zimbabwe<br />
Kenya<br />
1<br />
Egypt<br />
Burundi<br />
Water Insecure Water Secure<br />
Adaptively Secure<br />
Mauritius<br />
South Africa<br />
©Turton & Warner, 2002.<br />
1 2 3 4 5 6 7 8 9 10<br />
Second-Order Resource Availability Expressed as GNP PPP for<br />
1998 in US$/cap/yr -1 X 10 3
Average Income levels and irrigation intensity in India<br />
“Poverty is worst Polluter…” Gandhi<br />
China: 30 years<br />
•0 growth in Irrigation water use<br />
•Increase effectiveness by 8 million hectares<br />
•Increase grain yield by 50%<br />
Water Resources in China, MWR.www.waterpub.com.cn<br />
Net effect: districts with:<br />
• < 10% of cropped area irrigated --- 69% below poverty line<br />
• > 50% of cropped area irrigated --- 26% below poverty line
Economy‐wide impacts<br />
15.0<br />
3.0<br />
Real GDP growth (%)<br />
10.0<br />
5.0<br />
0.0<br />
-5.0<br />
1979<br />
1980<br />
1981<br />
1982<br />
1983<br />
Real GDP grow th (%)<br />
1984<br />
1985<br />
1986<br />
1987<br />
1988<br />
1989<br />
1990<br />
1991<br />
1992<br />
1993<br />
2.0<br />
1.0<br />
0.0<br />
-1.0<br />
-2.0<br />
-3.0<br />
Variability in Rainfall (Meter)<br />
Variability in Rainfall (Meter)<br />
-10.0<br />
Years<br />
Rainfall & GDP growth: Zimbabwe 1978‐1993<br />
-4.0<br />
percentage<br />
80<br />
60<br />
40<br />
20<br />
0<br />
-20<br />
1982<br />
1983<br />
1984<br />
1985<br />
1986<br />
Ethiopia’s….limited ability to cope with droughts and floods….are<br />
25<br />
estimated to cost the economy one‐third of its growth potential<br />
20<br />
(IWMI, Water Policy Brief, Issue 31, 2009)<br />
1987<br />
1988<br />
1989<br />
1990<br />
1991<br />
1992<br />
1993<br />
1994<br />
1995<br />
1996<br />
1997<br />
1998<br />
1999<br />
2000<br />
15<br />
10<br />
5<br />
0<br />
-5<br />
-10<br />
-40<br />
-15<br />
rainfall variation around the mean<br />
-20<br />
-60<br />
GDP growth<br />
-25<br />
-80<br />
-30<br />
year<br />
Rainfall & GDP growth: Ethiopia 1982‐2000
700<br />
600<br />
Billion $<br />
% GDP<br />
14<br />
12<br />
Losses %<br />
GDP<br />
400<br />
300<br />
10<br />
8<br />
Economic<br />
Losses<br />
200<br />
6<br />
100<br />
4<br />
0<br />
Richest Nations<br />
Poorest Nations<br />
2<br />
0<br />
Disasters Losses, Total and as Share of GDP, In the<br />
Richest and Poorest Nations, 1985 – 99 (world watch 2001)
Emerging Nations
Figure 5<br />
Benefits of Federal Projects (Damages Prevented)<br />
Accumulative Corps Expenditures (Principle plus O&M)<br />
$800<br />
Billions of Dollars (Adjusted to 1999 using Construction Cost Index)<br />
$700<br />
Billionsof Dollars<br />
$600<br />
$500<br />
$400<br />
$300<br />
$200<br />
$100<br />
$0<br />
1928<br />
$1 spent = $6 return<br />
Accumulative Benefits<br />
Accumulative Expenditures<br />
Annual Benefits<br />
1931<br />
1934<br />
1937<br />
1940<br />
1943<br />
1946<br />
1949<br />
1952<br />
1955<br />
1958<br />
1961<br />
1964<br />
1967<br />
1970<br />
1973<br />
1976<br />
1979<br />
1982<br />
1985<br />
1988<br />
1991<br />
1994<br />
1997<br />
1999<br />
Fiscal Year<br />
0.3<br />
0.2<br />
0.1<br />
0.0<br />
<strong>National</strong> Flood Damages Suffered<br />
•Impairment to Human activity and Creativity is key;<br />
0.6<br />
0.5<br />
• not just # Trigger Events: (e.g. Damage % of GDP…)<br />
0.4<br />
Percent of GNP<br />
1903<br />
1907<br />
1911<br />
1915<br />
1919<br />
1923<br />
1927<br />
1931<br />
1935<br />
1939<br />
1943<br />
1947<br />
1951<br />
1955<br />
1959<br />
1963<br />
1967<br />
1971<br />
1975<br />
1979<br />
1983<br />
1987<br />
Year<br />
1991<br />
1995
Flood damage and flood control investment<br />
in Japan<br />
Casual t i es and mi ssi ng peeaons ( number )<br />
6,000<br />
5,000<br />
4,000<br />
3,000<br />
2,000<br />
1,000<br />
Casual i t i es and Mi ssings<br />
Damage<br />
Fl ood cont r ol i nvest ment<br />
4,000<br />
3,500<br />
3,000<br />
2,500<br />
2,000<br />
1,500<br />
1,000<br />
500<br />
Damage, Fl ood cont r ol i nvest ment (bi l l i on yen)<br />
0<br />
1955 1960 1965 1970 1975 1980 1985 1990 1995 2000<br />
Year<br />
0<br />
1987 – 2001 $36 Billion in FD prevented – Spent $32 Billion
GAP ‐ SE Anatolia<br />
REGIONWIDE CHANGES 1985-2000<br />
1985 2000 Turkey 2000<br />
(%) (%) (%)<br />
RURAL WATER SUPPLY 57 60<br />
URBAN WATER SUPPLY 15 65<br />
RURAL ELECTRICITY 66 99<br />
VILLAGE ACCESS 71 98<br />
LITERACY 55 69<br />
INFANT MORTALITY (%0) 111 60<br />
LANDLESS POPULATION* 40 ** 25<br />
75<br />
73<br />
99<br />
99<br />
85.1<br />
35.3<br />
25<br />
* Irrıgable areas<br />
** 1995 figures
Water Actions as Key Societal<br />
Adaptation Tools<br />
Investment in Water Infrastructure, IWRM, Flood Management<br />
Water Security (small s)<br />
Minimum Platform for Growth<br />
Internal Stability<br />
and Security (large S)<br />
Strategic<br />
Security
4. The Changing Terms of Discourse on World<br />
Water
Climate Change Policy<br />
Political Dialogue of Ministers from DC’s‐LDC’s‐TC’S<br />
(August 2008 IWA and WWW)<br />
. Developed countries are more<br />
Best No regret<br />
likely to think of environment and<br />
Practises<br />
security in terms of global<br />
Climate<br />
proofing<br />
Developed<br />
environmental<br />
+<br />
changes<br />
+<br />
and<br />
+<br />
countries developing countries more with<br />
Countries the human + security implications +/- of -<br />
in<br />
local and regional problems<br />
Transition<br />
ODA + -/+ -
Pakistan Floods 2010<br />
Social Stability, Relative Deprivation, Political Unity, Security<br />
“Every dimension of our<br />
Relationship ‐politics, economics and<br />
Security……..is going to see major<br />
Shifts as a result of this historic disaster…”<br />
(U.S. White House, coordinator for Afgh &Pak, Aug 23, 2010)<br />
“..instead of forging unity, the<br />
Disaster seems to have deepened age‐old<br />
fissures…in ways that could incite strife….the<br />
four provinces are engaged in cut throat battles<br />
for shares of flood aid money….well Risk connected<br />
accused of diverting flood waters to save their<br />
own property..flood refuges stream to the city<br />
Karachi…”<br />
(Wash Post p.A8 Sept 11, 2010)<br />
1/5 of country covered<br />
10 million homeless<br />
>21 million people affected<br />
Many Quick to Say‐ “Climate Change”<br />
BUT<br />
An event of (P) 50 yr. return rate!<br />
Why –such a big Impact? (Ec. Growth but no Inv. in<br />
Reduction)<br />
How many more such places are there in the World?
Ethics of Adaptation vs. Mitigation:<br />
Raising anxiety with change while denying means to cope?<br />
• Main Triggers used to build human concerns on climate<br />
change are water related (Droughts; Floods; Storm Surges..)<br />
Ethical Dilemma of Climate Change Policy and Water<br />
•<br />
Climate,<br />
Traditional<br />
water<br />
concerns<br />
and security<br />
of Water<br />
debates<br />
Managers:<br />
are<br />
Managing<br />
raising<br />
Variability<br />
public<br />
to Decrease Vulnerability: Why Humans became Engineers<br />
anxiety about Change while inadvertently denying adaptive<br />
means (water investments) to cope with projected events;<br />
• Investment in managing variability is key to Creating Platform<br />
thus for raising Socio‐Economic questions Transformation about the ethics + Breaking of adaptation Cycles of vs.<br />
Poverty +achieving small “s”<br />
mitigation<br />
• Water actions have been key Social actions for society's to<br />
adapt to variability in nature and climate
Nature's Destruction to Nature<br />
(or is it Creation)<br />
Who Gave God the Permit for this?<br />
Are We allowed to<br />
Protect Ourselves?<br />
Part of nature?<br />
Separate from nature?<br />
Not Preservation?<br />
Not Restoration?<br />
We are in a process of<br />
Co Design
New Rhetoric ‐ Language (+ & ‐)<br />
• Sustainable Development<br />
– As Venue of Dialog: increase space for dialog<br />
– As Analytical:<br />
• Reductio ad absurdum…?<br />
• Sustainable (de facto) = no change or minimum<br />
change<br />
• Dev. = Change<br />
• SD = no change –change …!!<br />
• Adaptive Management<br />
– Brings focus to design performance criteria<br />
– Ecologists challenged to dev indicators<br />
– Emphasizes feedback into DM<br />
– Pushes us to conscious choice of end
New Rhetoric ‐ Language<br />
• Precautionary Principle<br />
– Not to decide is a decision with impacts since nature is<br />
changing (w/o Case)<br />
– So ‐ Ethics of no decision in face of needing to decide?<br />
– How much must we know to decide – 100% , 90%, 80%... ?<br />
– If believe we never know all complex interactions can PP<br />
be ethical?<br />
– Or is PP actually a norm for no action, minimum action,<br />
stasis, no risk..?
5. CONCLUSIONS<br />
• Identify Priority Areas of U.S. Security concerns<br />
Ask: “How can Water Actions be Used as Means to Achieve<br />
Security Ends in Each Priority Area?”<br />
• Move Beyond Humanitarian Assistance<br />
Ask: “How can we work to prevent and<br />
reduce vulnerability to Disasters?”<br />
•Moved from Preservation to an Age of Co‐Design Humans and Nature<br />
Our Rhetoric needs to Catch Up<br />
• Move Beyond Environment Alone and Ask:<br />
“How to use water to create platform for growth while<br />
designing mitigation cost to environment?”
Conclusions (con.)<br />
•Water talk grows but funding of tools to<br />
monitor/measure its behavior are reducing!<br />
•Most people live in places where the water comes<br />
only for a small % of year; a trend that is increasing:<br />
means Infrastructure and storage
Conclusions (con.)<br />
•How we decide on risk and water are central to the health of<br />
democratic political culture and individual freedom; need for the<br />
public to define and actively choose vs. passively accept<br />
management levels risks of the hydrograph extremes (floods and<br />
droughts).<br />
•All wealthy countries have managed to flatten the peaks and lows<br />
(floods and droughts) of hydrograph as a necessary preconditions<br />
to socio‐economic growth through water investments; the trend is<br />
to keep damages as percentage of GDP at around 5%; but for much<br />
of the poor countries this relationship is a socially and politically<br />
untenable trend at 25% ‐30%
A Story<br />
Imagine it is the sixth century, Rome has fallen,<br />
you are living in what we call today southern France…..<br />
It could happen here: it has happened other civilizations thru history
Water management (and water reform) is<br />
ALWAYS political…..<br />
Ancient Chinese Characters describing water<br />
management<br />
+<br />
=<br />
river<br />
+ dike<br />
=<br />
Political<br />
order