Limited Self-Control, Obesity and the Loss of ... - Index of - IZA
Limited Self-Control, Obesity and the Loss of ... - Index of - IZA
Limited Self-Control, Obesity and the Loss of ... - Index of - IZA

Create successful ePaper yourself
Turn your PDF publications into a flip-book with our unique Google optimized e-Paper software.
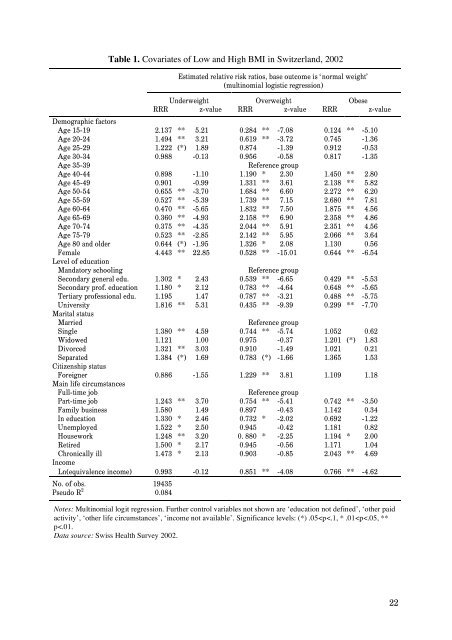
Table 1. Covariates <strong>of</strong> Low <strong>and</strong> High BMI in Switzerl<strong>and</strong>, 2002<br />
Estimated relative risk ratios, base outcome is ‘normal weight’<br />
(multinomial logistic regression)<br />
Underweight Overweight Obese<br />
RRR z-value RRR z-value RRR z-value<br />
Demographic factors<br />
Age 15-19 2.137 ** 5.21 0.284 ** -7.08 0.124 ** -5.10<br />
Age 20-24 1.494 ** 3.21 0.619 ** -3.72 0.745 -1.36<br />
Age 25-29 1.222 (*) 1.89 0.874 -1.39 0.912 -0.53<br />
Age 30-34 0.988 -0.13 0.956 -0.58 0.817 -1.35<br />
Age 35-39 Reference group<br />
Age 40-44 0.898 -1.10 1.190 * 2.30 1.450 ** 2.80<br />
Age 45-49 0.901 -0.99 1.331 ** 3.61 2.138 ** 5.82<br />
Age 50-54 0.655 ** -3.70 1.684 ** 6.60 2.272 ** 6.20<br />
Age 55-59 0.527 ** -5.39 1.739 ** 7.15 2.680 ** 7.81<br />
Age 60-64 0.470 ** -5.65 1.832 ** 7.50 1.875 ** 4.56<br />
Age 65-69 0.360 ** -4.93 2.158 ** 6.90 2.358 ** 4.86<br />
Age 70-74 0.375 ** -4.35 2.044 ** 5.91 2.351 ** 4.56<br />
Age 75-79 0.523 ** -2.85 2.142 ** 5.95 2.066 ** 3.64<br />
Age 80 <strong>and</strong> older 0.644 (*) -1.95 1.326 * 2.08 1.130 0.56<br />
Female 4.443 ** 22.85 0.528 ** -15.01 0.644 ** -6.54<br />
Level <strong>of</strong> education<br />
M<strong>and</strong>atory schooling Reference group<br />
Secondary general edu. 1.302 * 2.43 0.539 ** -6.65 0.429 ** -5.53<br />
Secondary pr<strong>of</strong>. education 1.180 * 2.12 0.783 ** -4.64 0.648 ** -5.65<br />
Tertiary pr<strong>of</strong>essional edu. 1.195 1.47 0.787 ** -3.21 0.488 ** -5.75<br />
University 1.816 ** 5.31 0.435 ** -9.39 0.299 ** -7.70<br />
Marital status<br />
Married Reference group<br />
Single 1.380 ** 4.59 0.744 ** -5.74 1.052 0.62<br />
Widowed 1.121 1.00 0.975 -0.37 1.201 (*) 1.83<br />
Divorced 1.321 ** 3.03 0.910 -1.49 1.021 0.21<br />
Separated 1.384 (*) 1.69 0.783 (*) -1.66 1.365 1.53<br />
Citizenship status<br />
Foreigner 0.886 -1.55 1.229 ** 3.81 1.109 1.18<br />
Main life circumstances<br />
Full-time job Reference group<br />
Part-time job 1.243 ** 3.70 0.754 ** -5.41 0.742 ** -3.50<br />
Family business 1.580 1.49 0.897 -0.43 1.142 0.34<br />
In education 1.330 * 2.46 0.732 * -2.02 0.692 -1.22<br />
Unemployed 1.522 * 2.50 0.945 -0.42 1.181 0.82<br />
Housework 1.248 ** 3.20 0. 880 * -2.25 1.194 * 2.00<br />
Retired 1.500 * 2.17 0.945 -0.56 1.171 1.04<br />
Chronically ill 1.473 * 2.13 0.903 -0.85 2.043 ** 4.69<br />
Income<br />
Ln(equivalence income) 0.993 -0.12 0.851 ** -4.08 0.766 ** -4.62<br />
No. <strong>of</strong> obs. 19435<br />
Pseudo R 2 0.084<br />
Notes: Multinomial logit regression. Fur<strong>the</strong>r control variables not shown are ‘education not defined’, ‘o<strong>the</strong>r paid<br />
activity’, ‘o<strong>the</strong>r life circumstances’, ‘income not available’. Significance levels: (*) .05