Limited Self-Control, Obesity and the Loss of ... - Index of - IZA
Limited Self-Control, Obesity and the Loss of ... - Index of - IZA
Limited Self-Control, Obesity and the Loss of ... - Index of - IZA

You also want an ePaper? Increase the reach of your titles
YUMPU automatically turns print PDFs into web optimized ePapers that Google loves.
Mean /<br />
fraction<br />
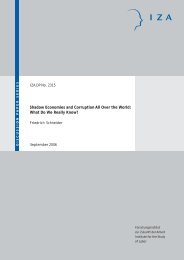
Table A.1. Descriptive Statistics<br />
Std. dev.<br />
Mean /<br />
fraction<br />
Std. dev.<br />
Subjective well-being 3.76 1.309 Citizenship status<br />
BMI 24.24 4.176 National 90.14%<br />
Demographic factors Foreigner 9.86%<br />
Age 47.81 17.044 Main life circumstances 39.20%<br />
Male 45.26% Full-time job 21.20%<br />
Female 54.74% Part-time job 0.54%<br />
Level <strong>of</strong> education Family business 0.48%<br />
M<strong>and</strong>atory schooling 14.79% In education 4.76%<br />
Secondary general edu. 6.08% Unemployed 1.70%<br />
Secondary pr<strong>of</strong>. edu. 58.46% Housework 20.32%<br />
Tertiary pr<strong>of</strong>essional edu. 10.46% Retired 17.53%<br />
University 7.31% Chronically ill 2.28%<br />
Marital status O<strong>the</strong>r 1.36%<br />
Married 55.62% Income<br />
Single 26.30% Ln(equivalence income) 8.23 0.499<br />
Widowed 7.86%<br />
Divorced 8.77%<br />
Separated 1.45%<br />
Household composition<br />
1 adult 28.01%<br />
2 adults 53.75%<br />
3 adults 10.58%<br />
4 adults <strong>and</strong> more 7.65%<br />
No children 72.86%<br />
1 child 10.90%<br />
2 children 12.05%<br />
3 children <strong>and</strong> more 4.19%<br />
Notes: Descriptive statistics are for <strong>the</strong> sample underlying <strong>the</strong> estimation in Table A.2 based on 15,108<br />
observations. Mean income is calculated based on 14,160 observations.<br />
Data source: Swiss Health Survey 2002.<br />
26