EUEC 2013 Session E8 - The EV Project
EUEC 2013 Session E8 - The EV Project
EUEC 2013 Session E8 - The EV Project

Create successful ePaper yourself
Turn your PDF publications into a flip-book with our unique Google optimized e-Paper software.
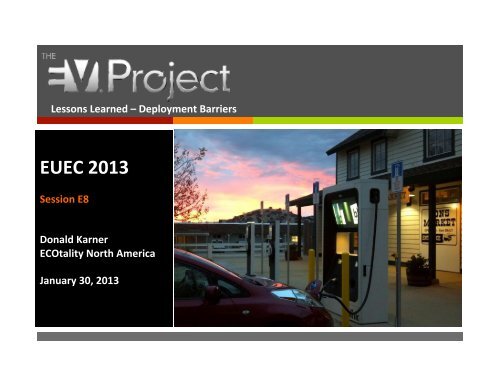
Lessons Learned – Deployment Barriers <br />
<strong>EUEC</strong> <strong>2013</strong> <br />
<strong>Session</strong> <strong>E8</strong> <br />
Donald Karner <br />
ECOtality North America <br />
January 30, <strong>2013</strong>
ECOtality <br />
ì Publicly Traded Company [NASDAQ:ecty] <br />
ì Formed in 1989 <br />
ì Advanced vehicle tesCng and evaluaCon <br />
ì 12+ million miles of advanced vehicle tesCng <br />
ì Electric, CNG, hydrogen, diesel <br />
ì Industrial vehicle infrastructure <br />
ì 6,000+ chargers installed <br />
ì DistribuCon warehouses, factories and airports <br />
ì On road infrastructure <br />
ì Planning, engineering, construcCon, operaCon, maintenance <br />
ì <strong>EV</strong> <strong>Project</strong>
<strong>EV</strong> <strong>Project</strong> Objectives <br />
ì IdenCfy Infrastructure Deployment Barriers <br />
ì Demonstrate Infrastructure Technologies <br />
ì Evaluate Infrastructure Business Models <br />
ì Develop Guidance For Future Infrastructure Deployment
60+ <strong>EV</strong> <strong>Project</strong><br />
Partners Include:<br />
<strong>EV</strong> <strong>Project</strong> Deployment
Blink Chargers <br />
ì Smart UI <br />
ì Internet <br />
ConnecCvity <br />
ì Energy/Power <br />
Metering <br />
ì Access <br />
Control <br />
ì Business Model <br />
Support
Deployment Status <br />
8000<br />
5000 200<br />
6,322<br />
78% <br />
2,840 <br />
55% <br />
48 <br />
24%
Vehicle Barriers – Observations <br />
ì Qualifier -‐ What do we know? <br />
We only do infrastructure! <br />
ì Divergent Standards <br />
ì Fast charge <br />
ì CHAdeMO <br />
ì SAE J1772 “Combo Connector” <br />
ì Wireless charging <br />
ì Technology Issues <br />
ì Desire To Use Electric Fuel
Electric Fuel Use <br />
38 miles all electric 73 miles all electric<br />
u Avg distance traveled per day (mi): 41.2<br />
u Avg trip distance (mi): 8.3<br />
u Avg # of trips between charging: 3.5<br />
u Avg distance between charging (mi): 29.3<br />
u Avg # of charging events/day: 1.4<br />
u Avg distance traveled per day (mi): 30<br />
u Avg trip distance (mi): 7.2<br />
u Avg # of trips between charging: 3.9<br />
u Avg distance between charging (mi): 27.9<br />
u Avg # of charging events/day: 1.1
Leaf Use
Volt Use
Vehicle <br />
Barriers <br />
CONCLUSIONS <br />
ì ObjecCve Should Be To Maximize <br />
Electric TransportaCon Fuel Use <br />
ì Higher power chargers – all about <br />
energy throughput <br />
ì Blink Lifestyle – opportunity charge <br />
ì Infrastructure is not the “Field of <br />
Dreams” <br />
ì <strong>The</strong> Past Does Not Predict <strong>The</strong> <br />
Future Of Infrastructure Use <br />
ì Do not rely solely on ICE data <br />
ì Do not ignore behavior change <br />
ì Value Remains King <br />
ì Societal costs are not part of the <br />
value determinaCon
Deployment Barriers -‐ Observations <br />
ì ResidenCal Permit Timeliness <br />
ì<br />
ì<br />
ì<br />
ì<br />
Most ciCes have posiCvely embraced P<strong>EV</strong>s <br />
ì <strong>EV</strong> <strong>Project</strong> outreach <br />
ì DOE Clean CiCes <br />
Majority of permits are over-‐the-‐counter <br />
Several CiCes allow self inspecCon <br />
ì Eliminates wait Cme for a City inspector <br />
ì Reduces City cost <br />
This is not currently an issue
Deployment Barriers -‐ Observations <br />
ì ResidenCal Permit Cost <br />
ì Permit fees vary significantly <br />
ì Fees are ogen a significant porCon of installaCon cost
Deployment Barriers -‐ Observations <br />
ì Non-‐ResidenCal Permihng <br />
ì Costs and delays <br />
are significant <br />
ì Load studies <br />
ì Zoning reviews <br />
ì Moving video <br />
ì Municipal Sites <br />
ì Statutory delays <br />
ì Legal barriers <br />
ì Street side locaCons <br />
very limited
Deployment Issues -‐ Observations <br />
ì Non-‐ResidenCal Cost <br />
ì<br />
ì<br />
Hosts are value sensiCve <br />
ì Cost is a major driver <br />
ì Revenue centric <br />
ì Image counts <br />
ADA compliance <br />
ì Major cost implicaCon <br />
ì No uniform applicaCon <br />
ì Accessibility issue <br />
ì Parking space count <br />
ì DOJ guidance criCcal
Deployment <br />
Barriers <br />
CONCLUSIONS <br />
ì ResidenCal Chargers <br />
ì<br />
ì<br />
Cost is significant but not limiCng <br />
External factors drive cost <br />
ì Permit fees and inspecCon costs <br />
ì Non-‐ResidenCal Chargers <br />
ì<br />
ì<br />
ì<br />
ì<br />
ì<br />
Not a “Field of Dreams” <br />
ROI is everything <br />
ì Cash <br />
ì Intangibles <br />
Permihng drives cost and delays <br />
Lack of clear regulaCon drives cost <br />
ì ADA <br />
ì ConnecCon standards <br />
Revenue will be criCcal
Operating Barriers -‐ Observations <br />
ì UClity commercial electricity rates do <br />
NOT promote P<strong>EV</strong>s <br />
ì Demand costs are significant at many <br />
uCliCes <br />
ì Some uCliCes offer commercial rates <br />
without demand charges <br />
ì Others incorporate a 20 kW to 50 kW <br />
demand threshold <br />
ì Demand rates can be as much as <br />
$25/kW per month
Operating Barriers -‐ Observations <br />
ì Monthly demand charges result in significant operaCng costs in <br />
many uClity service territories
Operating Barriers -‐ Observations <br />
ì Non-‐residenCal charging is inherently more expensive than <br />
home charging <br />
ì Equipment <br />
ì InstallaCon <br />
ì Energy <br />
ì Higher costs of non-‐residenCal charging must be reduced <br />
ì Vehicles will tether to home <br />
ì Market limited to homeowners <br />
ì Commercial energy costs are universally higher than <br />
residenCal energy costs – parCcularly with residenCal TOU
Operating Barriers -‐ Observations <br />
ì Time-‐of-‐use rates are very effecCve in moving residenCal <br />
transportaCon energy use to preferred Cmes <br />
ì<br />
ì<br />
ì<br />
Time available to charge is much greater than the Cme required <br />
to charge (even with only a 3.3 kW charger) <br />
Even modest on peak to off peak price raCos drive charging to <br />
off peak Cmes <br />
Convenient charge scheduling facilitates matching vehicle <br />
charging Cmes to off peak Cmes
Operating <br />
Barriers <br />
CONCLUSIONS <br />
ì <strong>EV</strong> chargers potenCally represent the <br />
first wide – scale deployment of smart <br />
devices incorporaCng energy storage <br />
ì Faster is berer – at least for <strong>EV</strong> <br />
charging <br />
ì ExisCng uClity rate structures cannot <br />
take advantage of the inherent <br />
flexibility <strong>EV</strong> charging can provide <br />
ì<br />
ì<br />
Carrot and sCck rates used to promote <br />
efficiency and transfer cost <br />
ì Tiered whole house rates <br />
ì Inability to handle embedded meters <br />
ì Significant demand costs <br />
Real Cme cost based rates for <br />
transportaCon energy are required
Nashville<br />
San Diego
Business Models -‐ Observations <br />
ì CompeCCon is Home Charging, Not Gasoline <br />
ì<br />
ì<br />
Lowest energy costs <br />
Special <strong>EV</strong> charging rates to encourage off peak use <br />
ì Free Charging Is Not Sustainable <br />
ì Access Fees Only Don’t Work <br />
ì<br />
ì<br />
ì<br />
ì<br />
Energy costs greater then home <br />
Demand charges don’t exist at home <br />
Equipment costs greater than home <br />
Maintenance costs greater than home
Sustainable Business <br />
ì Other value chains must support <br />
user and host value <br />
ì Branding <br />
ì Network services <br />
ì Grid services <br />
ì AdverCsing
Branding
Network Services
Grid Services <br />
ì Grid ConnecCon <br />
ì<br />
ì<br />
ì<br />
Cloud-‐to-‐Cloud <br />
UClity AMI <br />
Meter direct <br />
ì Dispatchable Load <br />
ì<br />
ì<br />
ì<br />
Demand reducCon <br />
Renewables <br />
absorpCon <br />
Economic dispatch
Advertising <br />
Our mission and vision is simple.<br />
Blink anywhere you go.<br />
Intelligent <strong>EV</strong> solutions
Information Dissemination <br />
ì 62 million miles in data base <br />
ì ≈100 million miles by end of <strong>EV</strong> <strong>Project</strong> <br />
ì 1.5 million charge events <br />
ì 10,000 MWh of electric fuel consumed <br />
ì Quarterly reporCng of informaCon <br />
ì Quarterly presentaCon of observaCons from data <br />
ì White papers present lessons learned and results <br />
ì Final report presents conclusions
Quarterly Reports <br />
ì Infrastructure Use <br />
ì<br />
ì<br />
ResidenCal <br />
Commercial (non-‐residenCal) <br />
ì Vehicle Use <br />
ì Electric UClity <br />
ì Nearly 100 pages per Quarter <br />
<strong>EV</strong> <strong>Project</strong> Overview Report<br />
<strong>Project</strong> to date through September 2012<br />
Charging Infrastructure<br />
Number of <strong>EV</strong> <strong>Project</strong> Number of Electricity<br />
Charging Units Charging Events Consumed<br />
Region¹<br />
Installed To Date Performed (AC MWh)<br />
Phoenix, AZ Metropolitan Area 661 84,521 626.03<br />
Tucson, AZ Metropolitan Area 182 22,424 157.89<br />
Los Angeles, CA Metropolitan Area 751 98,605 865.76<br />
San Diego, CA Metropolitan Area 1,089 227,990 2,046.84<br />
San Francisco, CA Metropolitan Area 1,428 264,138 2,536.02<br />
Washington, D.C. Metropolitan Area 196 25,758 164.35<br />
Oregon 892 128,122 984.63<br />
Chattanooga, TN Metropolitan Area 126 13,226 109.19<br />
Knoxville, TN Metropolitan Area 258 25,091 214.85<br />
Memphis, TN Metropolitan Area 75 9,453 74.09<br />
Nashville, TN Metropolitan Area 645 90,868 750.56<br />
Dallas/Ft. Worth, TX Metropolitan Area 283 22,501 135.84<br />
Houston, TX Metropolitan Area 141 14,407 93.58<br />
Washington State 1,056 199,763 1,555.50<br />
Chicago, IL Metropolitan Area 9 58 0.22<br />
Atlanta, GA Metropolitan Area 6 29 0.24<br />
Philadelphia, PA Metropolitan Area 0 0 0.00<br />
Total 7,798 1,226,954 10,315.59<br />
Vehicles<br />
<strong>EV</strong> <strong>Project</strong> Distance<br />
<strong>EV</strong> <strong>Project</strong> <strong>EV</strong> <strong>Project</strong><br />
Nissan Leafs Chevrolet Volts Smart Electric Drives Driven<br />
Region¹<br />
Enrolled to Date² Enrolled to Date² Enrolled to Date² (mi)<br />
Phoenix, AZ Metropolitan Area 259 83 — 2,938,251<br />
Tucson, AZ Metropolitan Area 79 7 — 692,134<br />
Los Angeles, CA Metropolitan Area 465 146 — 4,138,739<br />
San Diego, CA Metropolitan Area 657 153 300 8,379,969<br />
San Francisco, CA Metropolitan Area 1,441 — — 11,573,530<br />
Washington, D.C. Metropolitan Area 7 177 — 1,203,109<br />
Oregon 469 87 0 4,207,080<br />
Chattanooga, TN Metropolitan Area 50 11 — 488,318<br />
Knoxville, TN Metropolitan Area 88 17 — 960,641<br />
Memphis, TN Metropolitan Area 39 19 — 310,755<br />
Nashville, TN Metropolitan Area 394 29 — 3,363,328<br />
Dallas/Ft. Worth, TX Metropolitan Area 0 133 — 985,715<br />
Houston, TX Metropolitan Area 1 69 — 691,625<br />
Washington State 747 88 — 6,685,449<br />
Chicago, IL Metropolitan Area 2 19 — 51,824<br />
Atlanta, GA Metropolitan Area 17 5 — 14,589<br />
Philadelphia, PA Metropolitan Area 4 9 — 24,536<br />
Total 4,719 1,052 300 46,709,592<br />
Note: <strong>EV</strong> <strong>Project</strong> charging units may be used by vehicles that are not part of the <strong>EV</strong> <strong>Project</strong>. Likewise, <strong>EV</strong> <strong>Project</strong> vehicles may connect to non-<strong>EV</strong> <strong>Project</strong> charging units. <strong>The</strong>refore<br />
vehicle and charging infrastructure usage shown on this report are not directly comparable.<br />
¹ Regions: Oregon region includes the Greater Corvallis, Eugene, Portland, and Salem Metropolitan Areas<br />
Washington region includes the Greater Seattle and Olympia Metropolitan Areas<br />
² Vehicle enrollment numbers refer to the <strong>EV</strong> <strong>Project</strong> only. Numbers do not reflect total regional or national vehicles sales or production.<br />
© 2012 ECOtality<br />
10/24/2012 1:46:32 PM<br />
INL/MIS-11-21898
<strong>EV</strong> <strong>Project</strong> White Papers <br />
ì DC Fast Charge-‐Demand Charge ReducCon (May 2012) <br />
ì<br />
ì<br />
ì<br />
ì<br />
ì<br />
ì<br />
ì<br />
<strong>The</strong> <strong>EV</strong> Micro-‐Climate Planning Process (May 2012) <br />
Signage (April 2012) <br />
Greenhouse Gas Avoidance and Fuel Cost ReducCon (June 2012) <br />
First Responder Training (March 2011) <br />
Accessibility at Public <strong>EV</strong> Charging LocaCons (October 2011) <br />
Barery Electric Vehicle Driving and Charging Behavior Observed <br />
Early in <strong>The</strong> <strong>EV</strong> <strong>Project</strong> (April 2012) <br />
A First Look at the Impact of Electric Vehicle Charging on the Electric <br />
Grid in <strong>The</strong> <strong>EV</strong> <strong>Project</strong> (May 2012)
<strong>EV</strong> <strong>Project</strong> Website
Much More to Come <br />
This material is based upon work supported by the Department of Energy <br />
under Award Number DE-‐EE0002194. <br />
www.theevproject.com <br />
www.blinknetwork.com <br />
www.ecotality.com <br />
This report was prepared as an account of work sponsored by an agency of the United States <br />
Government. Neither the United States Government nor any agency thereof, nor any of their <br />
employees, makes any warranty, express or implied, or assumes any legal liability or responsibility <br />
for the accuracy, completeness, or usefulness of any informaCon, apparatus, product, or process <br />
disclosed, or represents that its use would not infringe privately owned rights. Reference herein <br />
to any specific commercial product, process, or service by trade name, trademark, manufacturer, <br />
or otherwise does not necessarily consCtute or imply its endorsement, recommendaCon, or <br />
favoring by the United States Government or any agency thereof. <strong>The</strong> views and opinions of <br />
authors expressed herein do not necessarily state or reflect those of the United States <br />
Government or any agency thereof.