Nutrient Management Efforts in a Minnesota Watershed
Nutrient Management Efforts in a Minnesota Watershed
Nutrient Management Efforts in a Minnesota Watershed

Create successful ePaper yourself
Turn your PDF publications into a flip-book with our unique Google optimized e-Paper software.
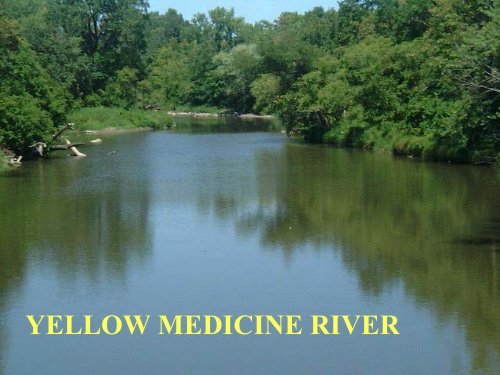
YELLOW MEDICINE RIVER
<strong>Nutrient</strong> <strong>Management</strong> <strong>Efforts</strong> <strong>in</strong> a<br />
M<strong>in</strong>nesota <strong>Watershed</strong><br />
Yellow Medic<strong>in</strong>e River Clean Water Partnership<br />
Yellow Medic<strong>in</strong>e River <strong>Watershed</strong> District<br />
Steve Howey, conservation agronomist
Yellow Medic<strong>in</strong>e River <strong>Watershed</strong> District, SW M<strong>in</strong>nesota<br />
M<strong>in</strong>nesota River<br />
Water monitor<strong>in</strong>g sites<br />
1997-2003<br />
Yellow Medic<strong>in</strong>e<br />
#<br />
#<br />
#<br />
#<br />
#<br />
#<br />
#<br />
#<br />
#<br />
#<br />
#<br />
#<br />
#<br />
#<br />
#<br />
Lyon<br />
L<strong>in</strong>coln
Water quality analysis<br />
■ Ortho P - plant available phosphorus<br />
■ Total P - all P <strong>in</strong> water and solids<br />
■ Total suspended solids - sediment,<br />
etc.<br />
■ Ammonia N<br />
■ Nitrate<br />
■ Total N
Some typical FWMC, mg/L (ppm)<br />
2 year averages (1998-99)<br />
■ Nitrates 2 to 17<br />
■ Ortho P .01 to .14<br />
■ Total P .07 to .40<br />
■ Total Suspended solids 9 to 241
Description of project<br />
■<br />
<strong>Nutrient</strong> management project that is one part of larger<br />
implementation that also <strong>in</strong>cludes CREP, buffers, etc.<br />
■ began <strong>in</strong> September 2001<br />
■<br />
collaboration with NRCS, MPCA, DNR, SWCD<br />
FOR MORE INFO...<br />
Greater Yellow Medic<strong>in</strong>e River Clean Water Partnership Phase II<br />
Work Plan 2001-2004
Project Goals<br />
■ Reduce nutrient loads significantly.<br />
■ Monitor water quality over time
NITRATES
SITE 1997 1998 1999 2001 2002 AVERAGE<br />
mg/L nitrates<br />
one 1.8 5.2 4.2 4.1 4.2 3.9<br />
two 1.8 4.3 3.4 3.2 3.9 3.3<br />
three 1.8 7.0 4.3 4.2 4.0 4.3<br />
four 3.1 27.9 6.9 6.4 6.7 10.2<br />
five 1.7 3.5 3.6 2.5 3.6 3.0<br />
six 2.5 3.3 3.9 1.9 2.3 2.8<br />
seven 1.4 2.7 2.3 3.3 1.6 2.3<br />
eight 1.5 2.6 1.6 2.0 1.8 1.9
Incentive programs example<br />
■ Registered feedlots were contacted.<br />
■ Incentive offered to do 2 foot nitrate<br />
test.<br />
■ Out of 38 feedlots contacted, 12<br />
committed to project, 7 followed through<br />
to completion.<br />
FOR MORE INFO...<br />
Steve Howey, agronomist. 1-507-872-6720.
Contd.<br />
■ 27 fields were sampled, previous crop<br />
soybean.<br />
■ Average nitrate <strong>in</strong> top two feet was 48<br />
lb./a.<br />
■ Recommendations were 43 LB/a lower<br />
than standard U of MN.
Evaluat<strong>in</strong>g Nitrogen<br />
<strong>Management</strong> - Two Fields
Conv.<br />
Ed &<br />
Scott<br />
Boehne<br />
Don Bot<br />
107<br />
acres<br />
No-till C / B<br />
till C/B<br />
38<br />
acres
1<br />
4<br />
2<br />
3
Check<strong>in</strong>g nitrogen management<br />
■ Variable rates were applied with<strong>in</strong> the<br />
field <strong>in</strong> the spr<strong>in</strong>g <strong>in</strong> year 1 (AA) and <strong>in</strong><br />
the fall of year 2 (band urea).<br />
■ 4 different areas of field po<strong>in</strong>t sampled<br />
<strong>in</strong> the fall of each year. No- till corn.<br />
■ Cornstalk nitrate test (September) and<br />
soil nitrate tests (Oct - Nov) taken at<br />
po<strong>in</strong>t sample locations as well as other<br />
rout<strong>in</strong>e tests <strong>in</strong> each year.
Objectives<br />
■ Try to use all available tools to evaluate<br />
N rate decisions after the fact us<strong>in</strong>g site<br />
specific po<strong>in</strong>ts <strong>in</strong> a field<br />
■ Identify specific sites with<strong>in</strong> fields that<br />
may need more N management<br />
■ Maybe learn someth<strong>in</strong>g ?????
1<br />
4<br />
2<br />
3
cornstalk tests<br />
year 1 year 2<br />
ppm<br />
9000<br />
8000<br />
7000<br />
6000<br />
5000<br />
4000<br />
3000<br />
2000<br />
1000<br />
0<br />
1 2 3 4<br />
Dra<strong>in</strong>ed<br />
depression<br />
po<strong>in</strong>t sample
post harvest nitrates <strong>in</strong> soil<br />
year 1 year 2<br />
lb / a nitrate N <strong>in</strong> two<br />
feet<br />
150<br />
100<br />
50<br />
0<br />
depression<br />
1 2 3 4<br />
po<strong>in</strong>t sample
Characteristics of the soil<br />
2 year<br />
cornstalk<br />
average,<br />
0 to 24 <strong>in</strong>ch sample<br />
Po<strong>in</strong>t ppm CEC pH CaCO3 % % OM<br />
1 1885 34.1 7.8 7.8 3.7<br />
2 7139 28.5 7.6 0.5 2.9<br />
3 1789 33.7 8.0 4.6 2.9<br />
4 1728 35.8 7.9 8.1 3.3
Conv.<br />
Ed &<br />
Scott<br />
Boehne<br />
Don Bot<br />
107<br />
acres<br />
No-till C / B<br />
till C/B<br />
38<br />
acres
X = open tile <strong>in</strong>take <strong>in</strong> depression<br />
Hybrid A<br />
X<br />
Hybrid B
Field size N treatments<br />
■ 40 lb/a N was applied late <strong>in</strong> fall with<br />
DAP<br />
■ 60, 80, or 105 lb/a sidedressed <strong>in</strong><br />
adjacent strips<br />
■ total N was 100, 120, and 145 lb/a<br />
■ yields weighed with weigh wagon
X = open tile <strong>in</strong>take <strong>in</strong> depression<br />
Hybrid A<br />
X<br />
Hybrid B
hybrid A hybrid B overall<br />
means means<br />
lb N /a<br />
100 170.3 / 21.3 157.3 / 16.9 166 / 19.9<br />
120 164.8 / 22.1 151.1 / 16.0 160 / 20.1<br />
145 165.7 / 21.9 148.6 / 15.2 160 / 19.7
Cornstalk tests from each strip<br />
Location <strong>in</strong> field cornstalk test 2 ft N yield<br />
(ppm) lb/a bu/a<br />
North (well dra<strong>in</strong>ed hill) 3075 45 158<br />
Middle (dra<strong>in</strong>ed depression) 477 “low” 19 176<br />
South ( level, SWPD) 5555 54 152
TYPICAL RELATIONSHIP on BOTH FIELDS<br />
rate of N vs nitrate s <strong>in</strong> 0 to 24"<br />
s oil nitrate N, lb/a<br />
Oct 6<br />
40<br />
30<br />
20<br />
10<br />
0<br />
90 110 130 150<br />
rate of N, lb/a
Summary of N evaluations<br />
■ Positive relationships between rate of N<br />
applied and the residual nitrates <strong>in</strong> soil<br />
■ Depressional areas appear to be good<br />
candidates for more N management<br />
■ N rates recommended by Univ. of MN<br />
were valid<br />
■ Cornstalk tests not related to soil tests
PHOSPHORUS
SOIL TESTING LOCATIONS<br />
Red- high, VH<br />
Yellow -<br />
medium<br />
Green -low
P soil tests <strong>in</strong> the YMRW, 2001-2003 197 fields<br />
35<br />
30<br />
OVERALL AVERAGE = 15 ppm<br />
average = 28 ppm<br />
25<br />
% of samples<br />
20<br />
15<br />
10<br />
5<br />
0<br />
very low low medium high very high<br />
Soil test category
WATER QUALITY / LAND USE / P SOIL TESTS<br />
Yellow Medic<strong>in</strong>e River <strong>Watershed</strong><br />
11/03<br />
grow<strong>in</strong>g season<br />
3 yr avg 4 yr avg avg avg %<br />
mg/ L mg/ L soil approx % river % hay % animal<br />
river ortho P Total P test acres acres slope cult. grass forest units/<br />
acres chnl SITE <strong>in</strong>cludes FWMC FWMC (ppm) test tested feet/mi land land acre<br />
300609 ma<strong>in</strong> 2 all ex. 4-->2 0.06 0.26 16 6240 2.1 16.2 91 7 4 0.22 0.36 15 2000 5.1 3.4 93 2 5 0.05 0.20 13 1840 2.3 22.6 84 8 6 0.18 0.33 14 1480 4.2 36.9 81 14 7 0.07 0.20 11 1480 3.4 23.3 80 13 8 0.06 0.30 10 1440 3.3 21.6 77 14
TYPICAL RESULTS - a relationship between soil<br />
test P and landscape position.<br />
P soil tests, 0 to 3 <strong>in</strong>ch, down a 6 to 12% slope<br />
35 ppm<br />
40 ppm<br />
42 ppm<br />
100 feet
PHOSPHORUS MOVEMENT IN THE FIELD<br />
100<br />
80<br />
60<br />
40<br />
20<br />
0<br />
Soil test, expressed as a<br />
% of <strong>in</strong>take sample<br />
P K<br />
<strong>Nutrient</strong><br />
Field average<br />
Around tile <strong>in</strong>takes
WHERE ARE THE HIGH PHOSPHORUS FIELDS ??<br />
Soil tests from sampl<strong>in</strong>g <strong>in</strong> YMRWD,<br />
fall 2001<br />
soil test as % of<br />
manure history<br />
field<br />
100<br />
50<br />
0<br />
N P K Zn<br />
<strong>Nutrient</strong>
MN P <strong>in</strong>dex experiences<br />
■ If BMPs for P are followed, current P<br />
<strong>in</strong>dex values would be “very low” or<br />
“low” for our watershed.<br />
■ Screen<strong>in</strong>g tool was developed to<br />
suggest what to do based on soil test,<br />
% slope, and texture.<br />
■ Possible applications to site specific<br />
work.
Some examples of calculated P<br />
<strong>in</strong>dex values <strong>in</strong> the watershed<br />
Field Soil test NRCS P <strong>in</strong>dex<br />
(ppm) RUSLE<br />
(tons/acre)<br />
1 50 3.4 0.82<br />
2 8 1.3 0.26<br />
3 29 1.3 0.32<br />
4 16 2.5 0.45<br />
5 20 2.5 0.47
“GRID” sampl<strong>in</strong>g and P <strong>in</strong>dex - what is<br />
the potential ?<br />
Dra<strong>in</strong>age Ditch<br />
Farm site<br />
1<br />
6<br />
8<br />
12<br />
<strong>in</strong>take<br />
2<br />
5<br />
3 4<br />
9<br />
11<br />
7 10<br />
This field is with<strong>in</strong> 1 mile<br />
of a large dairy operation,<br />
and has an average P soil<br />
test of 19 ppm. More<br />
manure applications are<br />
scheduled for the future.<br />
½ MILE
soil closest manure STP SDR soil P Path 1 Path 2 Path 3 P <strong>in</strong>dex<br />
test RUSLE distance factor total risk risk risk Value<br />
1 7 0.9 1100 0.75 0.2 0.25 0.9669 0.1 0.0 0.1 0.3<br />
2 14 2 600 0.75 0.2 0.28 1.0138 0.3 0.1 0.1 0.5<br />
3 13 1.1 100 0.75 0.2 0.4 1.0071 0.2 0.1 0.1 0.3<br />
4 23 0.9 600 0.75 0.2 0.28 1.0741 0.1 0.1 0.1 0.4<br />
5 15 2 500 0.75 0.2 0.28 1.0205 0.3 0.1 0.1 0.5<br />
6 24 2 500 0.75 0.2 0.28 1.0808 0.3 0.1 0.1 0.6<br />
7 19 0.9 500 0.75 0.2 0.28 1.0473 0.1 0.1 0.1 0.3<br />
8 16 0.9 10 0.75 0.2 0.5 1.0272 0.1 0.1 0.1 0.3<br />
9 16 0.9 10 0.75 0.2 0.5 1.0272 0.1 0.1 0.1 0.3<br />
10 19 0.9 700 0.75 0.2 0.26 1.0473 0.1 0.1 0.1 0.3<br />
11 26 4.1 400 0.75 0.2 0.3 1.0942 0.7 0.1 0.1 0.9<br />
12 32 4.1 450 0.75 0.2 0.3 1.1344 0.7 0.2 0.1 1.0
MN P <strong>in</strong>dex experiences<br />
■ IF phosphorus BMPs are followed, current P<br />
<strong>in</strong>dex values would be <strong>in</strong>terpretated “very<br />
low” or “low” for our watershed.<br />
■ Screen<strong>in</strong>g tool was developed to suggest<br />
what to do based on soil test, % slope, and<br />
texture.<br />
■ Possible applications to site specific work.
Average % Slope of Field or application area**<br />
Other<br />
less than 2 %<br />
2 to 6 % greater than 6% Sandy Flood<strong>in</strong>g<br />
P soil (nearly level) (gently slop<strong>in</strong>g) (hilly or steep) soils or Pond<strong>in</strong>g<br />
test 0-6"<br />
<strong>Nutrient</strong> Source<br />
Fertilizer Manure* Fertilizer Manure* Fertilizer Manure* All All<br />
Low A G A G A G K K<br />
Medium B G B G B G K K<br />
High C G C G E I K K<br />
Very High D H D I F J K K<br />
stop apply<strong>in</strong>g P2O5<br />
if over 80 ppm<br />
stop apply<strong>in</strong>g P2O5<br />
if over 40 ppm<br />
stop apply<strong>in</strong>g P2O5<br />
if over 20 ppm<br />
All L L L L L L L L
Future work <strong>in</strong> the Yellow<br />
Medic<strong>in</strong>e River <strong>Watershed</strong><br />
■ Phosphorus BMPs, erosion control,<br />
and state manure rules will be<br />
stressed.<br />
■ Soil and manure test<strong>in</strong>g.<br />
■ Field test<strong>in</strong>g of MN P <strong>in</strong>dex.<br />
■ Water quality will be monitored.