- Page 1 and 2:
Northern Provincial Council Statist
- Page 3 and 4:
1.11.7 GN DIVISION IN DIVISIONAL SE
- Page 5 and 6:
(TARGET & ACHIEVEMENT) (2007/2008 M
- Page 7 and 8: 06. LIVESTOCK 6.1 LIVESTOCK POPULAT
- Page 9 and 10: 8.3 MINOR TANKS BY DISTRICT IN NP -
- Page 11 and 12: 12.2 PARTICULARS OF RETURNEE & INTE
- Page 13 and 14: 15.4 HOUSING PROGRAMME IN KILINOCHC
- Page 15 and 16: 18.2 NAME AND LOCATION OF LOCAL AUT
- Page 17 and 18: FIGURES OF CONTENTS 1.1 LAND AREA O
- Page 19 and 20: Preface This book titled “Provinc
- Page 21 and 22: Figure 1.1 LAND AREA OF NORTHERN PR
- Page 23 and 24: Figure 1.4 ADMINISTRATIVE BOUNDARIE
- Page 25 and 26: DS DIVISION -Maritimepattu S.No GN
- Page 27 and 28: Table 1.5.2 GN DIVISION IN DIVISION
- Page 29 and 30: Figure 1.8 ADMINISTRATIVE BOUNDARIE
- Page 31 and 32: Table 1.8.2 GN DIVISION IN DIVISION
- Page 33 and 34: DS DIVISION : Musali S.No GN Divisi
- Page 35 and 36: Table: 1.10 AREA OF DIVISIONAL SECR
- Page 37 and 38: Table 1.11.1 GN DIVISIONS IN DIVISI
- Page 39 and 40: DS Division : Jaffna S.No GN Divisi
- Page 41 and 42: DS Division- Valakamam South S.No G
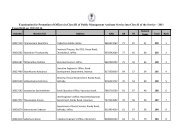
- Page 43 and 44: Table 1.11.7 GN DIVISIONS IN DIVISI
- Page 45 and 46: Table: 1.12 MONTHLY RAINFALL IN N.P
- Page 47 and 48: Table 1.14 MEAN RELATIVE HUMIDITY -
- Page 49 and 50: Table : 1.16 SOIL DISTRIBUTION IN N
- Page 51 and 52: Figure :2.1 Population by Ethnic Gr
- Page 53 and 54: Table: 2.3 URBAN & RURAL POPULATION
- Page 55 and 56: Table: 2.4.2 POPULATION DENSITY BY
- Page 57: Table: 2.5.1 POPULATION BY ETHNIC G
- Page 61 and 62: Table: 2.5.5 POPULATION BY ETHNIC G
- Page 63 and 64: Table: 2.6.2 POPULATION OF VAVUNIYA
- Page 65 and 66: Table: 2.6.4 POPULATION OF KILINOCH
- Page 67 and 68: Table: 2.7 LIVE BIRTHS BY DISTRICT
- Page 69 and 70: Table : 2.9 DEATHS BY DISTRICT _ 19
- Page 71 and 72: Table: 3.2 LAND USE PATTERN - VAVUN
- Page 73 and 74: Table: 3.4 LAND USE PATTERN - KILIN
- Page 75 and 76: Table: 4.1.1 FOREST RESERVE IN MULL
- Page 77 and 78: Name of FR/PR D.S.Division Extent i
- Page 79 and 80: Table : 4.2.1 STATE FOREST IN MULLA
- Page 81 and 82: Table: 4.2.3 STATE FOREST IN MANNAR
- Page 83 and 84: Figure 5.1: CULTIVATION PROGRAMME O
- Page 85 and 86: Table: 5.3.1 ACHIEVEMENT OF PADDY P
- Page 87 and 88: Table: 5.3.5 ACHIEVEMENT OF PADDY P
- Page 89 and 90: Figure : 5.2 ACHIEVEMENT OF OTHER F
- Page 91 and 92: Table: 5.5.1 LARGE ONION PRODUCTION
- Page 93 and 94: Table: 5.7 MAIZE PRODUCTION BY DIST
- Page 95 and 96: Table:5.10.1 COWPEA PRODUCTION BY D
- Page 97 and 98: Table: 5.12.1 BLACK GRAM PRODUCTION
- Page 99 and 100: Table: 5.14 EXTENT OF SELECTED FRUI
- Page 101 and 102: Table: 5.15.1 ACHIEVEMENT OF VEGETA
- Page 103 and 104: Table: 5.15.3 ACHIEVEMENT OF VEGETA
- Page 105 and 106: Table:5.17.1 AGRICULTURAL PARCELS I
- Page 107 and 108: Table: 5.17.5 AGRICULTURAL PARCELS
- Page 109 and 110:
Table: 5.19 INSTITUTIONS UNDER DEPA
- Page 111 and 112:
Table: 6.1 LIVESTOCK POPULATION BY
- Page 113 and 114:
Figure 6.2 : LIVESTOCK POPULATION I
- Page 115 and 116:
Table: 6.3.1 ARTIFICIAL INSEMINATIO
- Page 117 and 118:
District/Range Table: 6.3.2 ARTIFIC
- Page 119 and 120:
Figure 6.4 : ISSUE OF CHICKS IN NP
- Page 121 and 122:
Table: 6.6 VACCINATION IN CATTLE &
- Page 123 and 124:
District/Range VAVUNIYA DISTRICT Ta
- Page 125 and 126:
Figure 6.6: MILK COLLECTION BY DIST
- Page 127 and 128:
Table: 6.10 INSTITUTIONS UNDER PROV
- Page 129 and 130:
Table 6.11.2 LIVESTOCK FARM FAMILIE
- Page 131 and 132:
Table: 7.1 FISHING FAMILIES BY DIST
- Page 133 and 134:
Table: 7.3 NUMBER OF BENEFICIARIES
- Page 135 and 136:
Table: 7.4.2 DRIED FISH PRODUCTION
- Page 137 and 138:
Table: 7.6 ICE PLANTS AND PRODUCTIO
- Page 139 and 140:
Table 7.8 FISHING VILLAGES BY DFEO
- Page 141 and 142:
Table 7.10 FISHING VILLAGES BY DFEO
- Page 143 and 144:
Table: 7.13 Details of Fisheries Ha
- Page 145 and 146:
Table: 7.15.1 Details of Landing Si
- Page 147 and 148:
Table: 7.15.3 Details of Landing Si
- Page 149 and 150:
Table: 7.15.5 Details of Landing Si
- Page 151 and 152:
Table: 8.1.1 MAJOR / MEDIUM (PROVIN
- Page 153 and 154:
Table: 8.1.3 MAJOR/ MEDIUM (PROVINC
- Page 155 and 156:
Table: 8.2. MAJOR TANKS UNDER THE N
- Page 157 and 158:
Table: 8.4 RIVER BASINS IN NP - 200
- Page 159 and 160:
Table: 8.5.2 SALT WATER EXCLUSION S
- Page 161 and 162:
Table: 9.2 SMALL INDUSTRIES CENTRES
- Page 163 and 164:
Table 9.4 DETAILS OF HANDLOOM CENTR
- Page 165 and 166:
Figure 9.1 Petroleum Product Distri
- Page 167 and 168:
( Nos ) S. Vavuniya Mannar Mullaiti
- Page 169 and 170:
Table: 10.4 REGISTRATION OF CO-OPER
- Page 171 and 172:
Table: 10.6 MILK PRODUCTS & SALES B
- Page 173 and 174:
Figure 11.1 Beneficiaries under Soc
- Page 175 and 176:
Figure 11.2 CHILDREN BENIFITED IN H
- Page 177 and 178:
350 Figure 11.3 DISABLED BENIFITED
- Page 179 and 180:
Figure 11.4 ELDERS BENIFITED IN HOM
- Page 181 and 182:
Figure 11.5 CHILDREN BENIFITED IN D
- Page 183 and 184:
Figure 11.6 Handicapped assisted by
- Page 185 and 186:
Figure 11.7 Disabled Persons in NP
- Page 187 and 188:
Table :11.5.2 DISABLED PERSONS BY D
- Page 189 and 190:
Table 11.7 Details of Child Abuses
- Page 191 and 192:
Division Table: 12.1.1 INFORMATION
- Page 193 and 194:
Table: 12.1.3 INFORMATION ON DISPLA
- Page 195 and 196:
Table: 12.1.5 INFORMATION ON DISPLA
- Page 197 and 198:
Table :12.3 ISSUES OF DRY RATION BY
- Page 199 and 200:
TABLE : 12.5 DETAILS OF PENSIONERS
- Page 201 and 202:
TABLE : 12.6.2 PLACES OF WORSHIPS B
- Page 203 and 204:
Table: 13.1 ELECTRICITY UTILIZATION
- Page 205 and 206:
Table : 13.3 ELECTRICITY CONSUMER S
- Page 207 and 208:
Table: 14.1.2 INFORMATION ON MAJOR
- Page 209 and 210:
Table: 14.1.4 INFORMATION ON MAJOR
- Page 211 and 212:
Table: 14.1.5.2 INFORMATION ON MAJO
- Page 213 and 214:
Table: 14.3.1 Length of C Class Roa
- Page 215 and 216:
Table: 14.3.3 Length of C Class Roa
- Page 217 and 218:
Table: 14.3.5 Length of C Class Roa
- Page 219 and 220:
Table: 14.3.7 Length of C&D Class R
- Page 221 and 222:
RD. Code Name of Road DS Division F
- Page 223 and 224:
Table: 14.3.11 Length of C Class Ro
- Page 225 and 226:
District No. of Vehicles Table 14.4
- Page 227 and 228:
Figure 14.1 : REVENUE COLLECTION IN
- Page 229 and 230:
Table: 14.7 Vehicle Licences Issued
- Page 231 and 232:
District Main Post Office Table: 14
- Page 233 and 234:
District Main Post Office Table: 14
- Page 235 and 236:
Table: 15.1 HOUSING PROGRAMME IN MU
- Page 237 and 238:
Table: 15.3 HOUSING PROGRAMME IN MA
- Page 239 and 240:
Table: 15.5 HOUSING PROGRAMME IN JA
- Page 241 and 242:
Table : 16.2.1 DISTRIBUTION OF MEDI
- Page 243 and 244:
DPDHS REGION VAVUNIYA Table : 16.2.
- Page 245 and 246:
Table: 16.3 OUT - DOOR PATIENT TREA
- Page 247 and 248:
Table: 16.5 Preventive Care Institu
- Page 249 and 250:
Table :16.8.1 HEALTH STATUS AND HEA
- Page 251 and 252:
Table :16.8.3 HEALTH STATUS AND HEA
- Page 253 and 254:
Table : 16.9 BIRTH, DEATH & MORTALI
- Page 255 and 256:
DISEASES Table : 16.11 INCIDENCE OF
- Page 257 and 258:
Table: 17.1 SCHOOLS BY TYPE AND STA
- Page 259 and 260:
Table 17.3 DISTRIBUTION OF SCHOOLS
- Page 261 and 262:
Jaffna Zone Table 17.5 DISTRIBUTION
- Page 263 and 264:
Table: 17.7 FUNCTIONING SCHOOLS BY
- Page 265 and 266:
Table : 17.9 FUNCTIONING SCHOOLS BY
- Page 267 and 268:
Table 17.11 SECONDARY SCHOOLS AND C
- Page 269 and 270:
Table17.13 COMPARISON OF STUDENT EN
- Page 271 and 272:
Table 17.14 SCHOOLS BY SIZE OF POPU
- Page 273 and 274:
Table: 17.16 TEACHER CATEGORY BY DI
- Page 275 and 276:
Table 17.18 PUPIL TEACHERS RATIO BY
- Page 277 and 278:
S.No District Name of Zone Educatio
- Page 279 and 280:
Table :18.2 NAME AND LOCATION OF LO
- Page 281 and 282:
Description Table: 18.3.2 POPULATIO
- Page 283 and 284:
Table: 18.3.4 POPULATION, AREA, SER
- Page 285 and 286:
Table: 18.3.6 POPULATION, AREA, SER
- Page 287 and 288:
Table: 18.3.8 POPULATION, AREA, SER
- Page 289 and 290:
Table: 18.3.10 POPULATION, AREA, SE
- Page 291 and 292:
Table: 18.3.12 POPULATION, AREA, SE
- Page 293 and 294:
Table 18.5 Mother & Child Care Unit
- Page 295 and 296:
Table: 19.1 BANKS BY DISTRICT IN NP
- Page 297 and 298:
Table: 20.1. INTERNATIONAL N.G.OO -
- Page 299 and 300:
Table: 20.2.2 LOCAL N.G.OO - VAVUNI
- Page 301 and 302:
Table 20.2.4 UN Agencies - VAVUNIYA
- Page 303 and 304:
Table: 20.3.2 LOCAL NGOO - MANNAR D
- Page 305 and 306:
Table: 20.4 INTERNATIONAL N.G.OO -
- Page 307:
S/No. Name of NGOO Key Contact Pers