Socioeconomic Factors Influencing Adoption of Yam ... - Seea.org.in
Socioeconomic Factors Influencing Adoption of Yam ... - Seea.org.in
Socioeconomic Factors Influencing Adoption of Yam ... - Seea.org.in

You also want an ePaper? Increase the reach of your titles
YUMPU automatically turns print PDFs into web optimized ePapers that Google loves.
Indian Res. J. Ext. Edu. 8 (2&3), May & September 2008 3<br />
accord<strong>in</strong>g to farm size. About 34.55% <strong>of</strong> the<br />
respondents had farm size <strong>of</strong> less than one hectare.<br />
This was made up <strong>of</strong> young farmers who just came<br />
<strong>in</strong>to m<strong>in</strong>isett production. Fifty two or 47.27% fell with<strong>in</strong><br />
the group that cultivated between one and three hectares.<br />
However, 16.36% fell under 4-6 hectares while only<br />
1.82% had farm size <strong>of</strong> more than 6 hectares (Table 1).<br />
Those with a higher number <strong>of</strong> hectares had established<br />
<strong>in</strong> the bus<strong>in</strong>ess and devoted more land to rais<strong>in</strong>g yam<br />
m<strong>in</strong>isett. It could also be observed that this level <strong>of</strong><br />
farmers will readily adopt <strong>in</strong>novations <strong>in</strong> yam m<strong>in</strong>isett<br />
technology. It is feasible from on-farm adoptive research<br />
(OFAR) that farmers with greater areas <strong>of</strong> land readily<br />
chose to try new crop technologies and Udoh (2003)<br />
ma<strong>in</strong>ta<strong>in</strong>ed that farm size showed a significant<br />
relationship <strong>in</strong> adoption <strong>of</strong> cassava biotechnology by<br />
Nigerian farmers. It is also feasible that the level <strong>of</strong><br />
<strong>in</strong>come that they acquire from the sales <strong>of</strong> yam sets<br />
from m<strong>in</strong>isett will motivate them to adopt more<br />
<strong>in</strong>novations on yam production.<br />
Income : Due to food scarcity, seed yams have been<br />
significantly used for food. Consequently, the scarcity<br />
<strong>of</strong> seed yams has forced price <strong>of</strong> seed and ware yams<br />
up thus improv<strong>in</strong>g the <strong>in</strong>come levels <strong>of</strong> the farmers.<br />
The <strong>in</strong>come <strong>of</strong> farmers adopt<strong>in</strong>g yam m<strong>in</strong>isett technology<br />
is shown <strong>in</strong> Table 1 which showed that 17.27% <strong>of</strong> the<br />
respondents had <strong>in</strong>come <strong>of</strong> less than N5,000 from yam<br />
m<strong>in</strong>isett production. Sixty-one farmers or 55.45% <strong>of</strong><br />
respondents made an annual <strong>in</strong>come <strong>of</strong> between N 5000-<br />
N10,000 <strong>in</strong> yam cultivation. This group <strong>of</strong> <strong>in</strong>come<br />
formed the peak <strong>of</strong> the range <strong>of</strong> <strong>in</strong>come for the farmers.<br />
However, 12.82% <strong>of</strong> farmers made <strong>in</strong>come <strong>in</strong> the range<br />
<strong>of</strong> N 11,000 – N 15,000 from their yam m<strong>in</strong>isett<br />
production. F<strong>in</strong>ally, just 5.45% made an <strong>in</strong>come <strong>of</strong><br />
over N 15,000 from yam m<strong>in</strong>isett. The <strong>in</strong>come so<br />
realized is obta<strong>in</strong>ed from about 20% <strong>of</strong> the total harvest<br />
per hectare because while about 57% <strong>of</strong> the harvest is<br />
reserved for food, 23% is reserved for plant<strong>in</strong>g next<br />
season. It is feasible that more farmers will jo<strong>in</strong> their<br />
counterparts s<strong>in</strong>ce yam m<strong>in</strong>isett is an additional source<br />
<strong>of</strong> <strong>in</strong>come.<br />
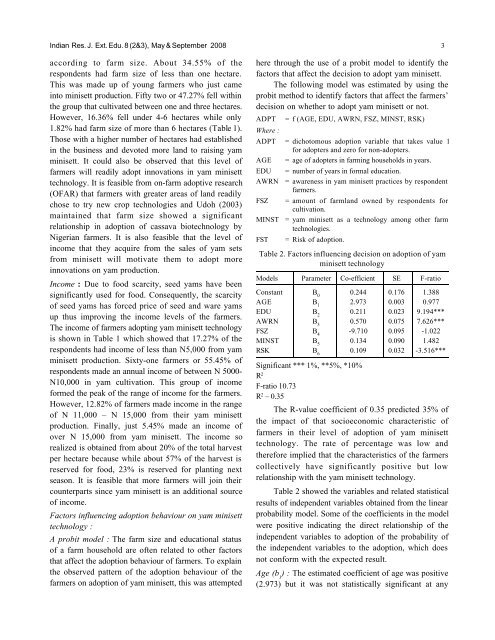
<strong>Factors</strong> <strong>in</strong>fluenc<strong>in</strong>g adoption behaviour on yam m<strong>in</strong>isett<br />
technology :<br />
A probit model : The farm size and educational status<br />
<strong>of</strong> a farm household are <strong>of</strong>ten related to other factors<br />
that affect the adoption behaviour <strong>of</strong> farmers. To expla<strong>in</strong><br />
the observed pattern <strong>of</strong> the adoption behaviour <strong>of</strong> the<br />
farmers on adoption <strong>of</strong> yam m<strong>in</strong>isett, this was attempted<br />
here through the use <strong>of</strong> a probit model to identify the<br />
factors that affect the decision to adopt yam m<strong>in</strong>isett.<br />
The follow<strong>in</strong>g model was estimated by us<strong>in</strong>g the<br />
probit method to identify factors that affect the farmers’<br />
decision on whether to adopt yam m<strong>in</strong>isett or not.<br />
ADPT<br />
Where :<br />
= f (AGE, EDU, AWRN, FSZ, MINST, RSK)<br />
ADPT = dichotomous adoption variable that takes value 1<br />
for adopters and zero for non-adopters.<br />
AGE = age <strong>of</strong> adopters <strong>in</strong> farm<strong>in</strong>g households <strong>in</strong> years.<br />
EDU<br />
AWRN<br />
FSZ<br />
MINST<br />
FST<br />
= number <strong>of</strong> years <strong>in</strong> formal education.<br />
= awareness <strong>in</strong> yam m<strong>in</strong>isett practices by respondent<br />
farmers.<br />
= amount <strong>of</strong> farmland owned by respondents for<br />
cultivation.<br />
= yam m<strong>in</strong>isett as a technology among other farm<br />
technologies.<br />
= Risk <strong>of</strong> adoption.<br />
Table 2. <strong>Factors</strong> <strong>in</strong>fluenc<strong>in</strong>g decision on adoption <strong>of</strong> yam<br />
m<strong>in</strong>isett technology<br />
Models Parameter Co-efficient SE F-ratio<br />
Constant B 0<br />
0.244 0.176 1.388<br />
AGE B 1<br />
2.973 0.003 0.977<br />
EDU B 2<br />
0.211 0.023 9.194***<br />
AWRN B 3<br />
0.570 0.075 7.626***<br />
FSZ B 4<br />
-9.710 0.095 -1.022<br />
MINST B 5<br />
0.134 0.090 1.482<br />
RSK B 6<br />
0.109 0.032 -3.516***<br />
Significant *** 1%, **5%, *10%<br />
R 2<br />
F-ratio 10.73<br />
R 2 – 0.35<br />
The R-value coefficient <strong>of</strong> 0.35 predicted 35% <strong>of</strong><br />
the impact <strong>of</strong> that socioeconomic characteristic <strong>of</strong><br />
farmers <strong>in</strong> their level <strong>of</strong> adoption <strong>of</strong> yam m<strong>in</strong>isett<br />
technology. The rate <strong>of</strong> percentage was low and<br />
therefore implied that the characteristics <strong>of</strong> the farmers<br />
collectively have significantly positive but low<br />
relationship with the yam m<strong>in</strong>isett technology.<br />
Table 2 showed the variables and related statistical<br />
results <strong>of</strong> <strong>in</strong>dependent variables obta<strong>in</strong>ed from the l<strong>in</strong>ear<br />
probability model. Some <strong>of</strong> the coefficients <strong>in</strong> the model<br />
were positive <strong>in</strong>dicat<strong>in</strong>g the direct relationship <strong>of</strong> the<br />
<strong>in</strong>dependent variables to adoption <strong>of</strong> the probability <strong>of</strong><br />
the <strong>in</strong>dependent variables to the adoption, which does<br />
not conform with the expected result.<br />
Age (b 1<br />
) : The estimated coefficient <strong>of</strong> age was positive<br />
(2.973) but it was not statistically significant at any