Analysis of Role Performance of Women in farm activities - Seea.org.in
Analysis of Role Performance of Women in farm activities - Seea.org.in
Analysis of Role Performance of Women in farm activities - Seea.org.in

You also want an ePaper? Increase the reach of your titles
YUMPU automatically turns print PDFs into web optimized ePapers that Google loves.
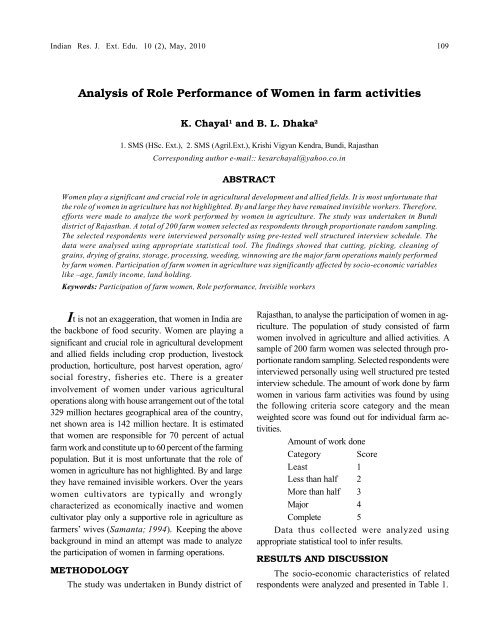
Indian Res. J. Ext. Edu. 10 (2), May, 2010 109<strong>Analysis</strong> <strong>of</strong> <strong>Role</strong> <strong>Performance</strong> <strong>of</strong> <strong>Women</strong> <strong>in</strong> <strong>farm</strong> <strong>activities</strong>K. Chayal 1 and B. L. Dhaka 21. SMS (HSc. Ext.), 2. SMS (Agril.Ext.), Krishi Vigyan Kendra, Bundi, RajasthanCorrespond<strong>in</strong>g author e-mail:: kesarchayal@yahoo.co.<strong>in</strong>ABSTRACT<strong>Women</strong> play a significant and crucial role <strong>in</strong> agricultural development and allied fields. It is most unfortunate thatthe role <strong>of</strong> women <strong>in</strong> agriculture has not highlighted. By and large they have rema<strong>in</strong>ed <strong>in</strong>visible workers. Therefore,efforts were made to analyze the work performed by women <strong>in</strong> agriculture. The study was undertaken <strong>in</strong> Bundidistrict <strong>of</strong> Rajasthan. A total <strong>of</strong> 200 <strong>farm</strong> women selected as respondents through proportionate random sampl<strong>in</strong>g.The selected respondents were <strong>in</strong>terviewed personally us<strong>in</strong>g pre-tested well structured <strong>in</strong>terview schedule. Thedata were analysed us<strong>in</strong>g appropriate statistical tool. The f<strong>in</strong>d<strong>in</strong>gs showed that cutt<strong>in</strong>g, pick<strong>in</strong>g, clean<strong>in</strong>g <strong>of</strong>gra<strong>in</strong>s, dry<strong>in</strong>g <strong>of</strong> gra<strong>in</strong>s, storage, process<strong>in</strong>g, weed<strong>in</strong>g, w<strong>in</strong>now<strong>in</strong>g are the major <strong>farm</strong> operations ma<strong>in</strong>ly performedby <strong>farm</strong> women. Participation <strong>of</strong> <strong>farm</strong> women <strong>in</strong> agriculture was significantly affected by socio-economic variableslike –age, family <strong>in</strong>come, land hold<strong>in</strong>g.Keywords: Participation <strong>of</strong> <strong>farm</strong> women, <strong>Role</strong> performance, Invisible workersIt is not an exaggeration, that women <strong>in</strong> India arethe backbone <strong>of</strong> food security. <strong>Women</strong> are play<strong>in</strong>g asignificant and crucial role <strong>in</strong> agricultural developmentand allied fields <strong>in</strong>clud<strong>in</strong>g crop production, livestockproduction, horticulture, post harvest operation, agro/social forestry, fisheries etc. There is a greater<strong>in</strong>volvement <strong>of</strong> women under various agriculturaloperations along with house arrangement out <strong>of</strong> the total329 million hectares geographical area <strong>of</strong> the country,net shown area is 142 million hectare. It is estimatedthat women are responsible for 70 percent <strong>of</strong> actual<strong>farm</strong> work and constitute up to 60 percent <strong>of</strong> the <strong>farm</strong><strong>in</strong>gpopulation. But it is most unfortunate that the role <strong>of</strong>women <strong>in</strong> agriculture has not highlighted. By and largethey have rema<strong>in</strong>ed <strong>in</strong>visible workers. Over the yearswomen cultivators are typically and wronglycharacterized as economically <strong>in</strong>active and womencultivator play only a supportive role <strong>in</strong> agriculture as<strong>farm</strong>ers’ wives (Samanta; 1994). Keep<strong>in</strong>g the abovebackground <strong>in</strong> m<strong>in</strong>d an attempt was made to analyzethe participation <strong>of</strong> women <strong>in</strong> <strong>farm</strong><strong>in</strong>g operations.METHODOLOGYThe study was undertaken <strong>in</strong> Bundy district <strong>of</strong>Rajasthan, to analyse the participation <strong>of</strong> women <strong>in</strong> agriculture.The population <strong>of</strong> study consisted <strong>of</strong> <strong>farm</strong>women <strong>in</strong>volved <strong>in</strong> agriculture and allied <strong>activities</strong>. Asample <strong>of</strong> 200 <strong>farm</strong> women was selected through proportionaterandom sampl<strong>in</strong>g. Selected respondents were<strong>in</strong>terviewed personally us<strong>in</strong>g well structured pre tested<strong>in</strong>terview schedule. The amount <strong>of</strong> work done by <strong>farm</strong>women <strong>in</strong> various <strong>farm</strong> <strong>activities</strong> was found by us<strong>in</strong>gthe follow<strong>in</strong>g criteria score category and the meanweighted score was found out for <strong>in</strong>dividual <strong>farm</strong> <strong>activities</strong>.Amount <strong>of</strong> work doneCategory ScoreLeast 1Less than half 2More than half 3Major 4Complete 5Data thus collected were analyzed us<strong>in</strong>gappropriate statistical tool to <strong>in</strong>fer results.RESULTS AND DISCUSSIONThe socio-economic characteristics <strong>of</strong> relatedrespondents were analyzed and presented <strong>in</strong> Table 1.
110 Indian Res. J. Ext. Edu. 10 (2), May, 2010The Table 1 depicts that majority (52.5 %) <strong>of</strong> therespondents belonged to middle age group followed byyoung age (30 %) and old age (17.5 %) group. It wasalso revealed that majority (60%) <strong>of</strong> respondents werebelonged to nuclear family and followed by (40 %) werefrom jo<strong>in</strong>t family. Result on family <strong>in</strong>come shows thatmajority (44.5 %) <strong>of</strong> respondents were belongs to<strong>in</strong>come group Rs. 60000-90000 followed by (27.5 %)<strong>in</strong>come group below Rs. 30000, (25%) <strong>in</strong>come groupRs. 30000-60000 and (3%) <strong>in</strong>come group above Rs.90000 annually. Results on cast categories <strong>in</strong>dicate thatmaximum (45%) were from other backward class and(42.5%) were from schedule tribe category and rest <strong>of</strong>respondents (7.5%) were belonged to schedule class.While look<strong>in</strong>g at their educational status, results revealedthat majority (57%) respondents were illiterate, (35%)were literate and (5%) were from primary level (2.5%) were from middle level and only (0.5 %) weregraduate. Result on land hold<strong>in</strong>g depicts that majority(42.5%) were had medium scale land followed by smallTable 1. Socio personal characteristics <strong>of</strong> respondents(N=200)Variable Categories N %ageAge Young (40) 35 17.5Type <strong>of</strong> family Jo<strong>in</strong>t family 80 40Nuclear family 120 60Annual family<strong>in</strong>come (Rs.) Below 30,000 55 27.530000-60000 50 2560000-90000 89 44.590000& above 6 3Caste General 10 5OBC 85 42.5Schedule caste 15 7.5Schedule tribes 90 45Education Illiterate 114 57literate 70 35Primary 10 5Middle 5 2.5Graduation 1 0.5Land hold<strong>in</strong>g Small 75 37.5Medium 85 42.5Large 40 20(37.5%) scale land and only (20%) had large scale land.The participation <strong>of</strong> selected respondents <strong>in</strong> <strong>farm</strong><strong>activities</strong> was analyzed and presented <strong>in</strong> Table 2. Thedata <strong>in</strong> Table 2 reveals that cutt<strong>in</strong>g, pick<strong>in</strong>g, clean<strong>in</strong>g <strong>of</strong>gra<strong>in</strong>s, dry<strong>in</strong>g <strong>of</strong> gra<strong>in</strong>s, storage and process<strong>in</strong>g are themajor <strong>farm</strong> operations where<strong>in</strong> women participation was100 percent. S<strong>in</strong>gh et.al. (2004) also reported thatthe <strong>farm</strong> operations <strong>in</strong> which the participation <strong>of</strong> womenwas100 percent were clean<strong>in</strong>g the produces, cutt<strong>in</strong>g,pick<strong>in</strong>g, storage and process<strong>in</strong>g. It was observed thatw<strong>in</strong>now<strong>in</strong>g, weed<strong>in</strong>g, gap fill<strong>in</strong>g, grad<strong>in</strong>g, shift<strong>in</strong>g produceto thresh<strong>in</strong>g floor and clean<strong>in</strong>g <strong>of</strong> field <strong>farm</strong> operations<strong>in</strong> which the participation <strong>of</strong> women was more than 75percent. The tasks <strong>in</strong> which women participation wasvaried between 50-75 percent were thrash<strong>in</strong>g, rais<strong>in</strong>gnursery for seedl<strong>in</strong>gs and th<strong>in</strong>n<strong>in</strong>g. The results also showTable 2. Participation <strong>of</strong> <strong>farm</strong> women <strong>in</strong> <strong>farm</strong> <strong>activities</strong>(N=200)S.No. Farm <strong>activities</strong> N %age1. Plough<strong>in</strong>g <strong>of</strong> field 4 22. Clean<strong>in</strong>g <strong>of</strong> field 170 853. Level<strong>in</strong>g <strong>of</strong> field 10 54. Rais<strong>in</strong>g nursery for seedl<strong>in</strong>g 110 55(okra, chilly, tomato, pea)5. Sow<strong>in</strong>g 51 25.56. Transplant<strong>in</strong>g 41 20.57. Mannure application 65 32.58. Fertilizer application 2 19. Weed<strong>in</strong>g 151 75.510. Th<strong>in</strong>n<strong>in</strong>g 121 60.511. Gap fill<strong>in</strong>g 161 80.512. Irrigation 52 2613. Plant protection measures(Insecticide, pesticide used) 0 014. Cutt<strong>in</strong>g 200 10015. Pick<strong>in</strong>g 200 10016. Shift<strong>in</strong>g production to 179 89.5thresh<strong>in</strong>g floor17. Thresh<strong>in</strong>g 100 5018. W<strong>in</strong>now<strong>in</strong>g 190 9519. Dry<strong>in</strong>g <strong>of</strong> gra<strong>in</strong>s 200 10020. Clean<strong>in</strong>g <strong>of</strong> gra<strong>in</strong>s 200 10021. Grad<strong>in</strong>g 180 9022. Storage 200 10023. Market<strong>in</strong>g 0 024. Process<strong>in</strong>g 200 100
Indian Res. J. Ext. Edu. 10 (2), May, 2010 111Table 3. Amount <strong>of</strong> work done by <strong>farm</strong> women <strong>in</strong> various<strong>farm</strong> <strong>activities</strong> (N=200)S.No.Farm <strong>activities</strong>1. Plough<strong>in</strong>g <strong>of</strong> field 12. Clean<strong>in</strong>g <strong>of</strong> field 4.93. Level<strong>in</strong>g <strong>of</strong> field 14. Rais<strong>in</strong>g nursery for seedl<strong>in</strong>g 4.5(lady f<strong>in</strong>ger, green chilly,tomato, cauliflower)5. Sow<strong>in</strong>g 3.46. Transplant<strong>in</strong>g 57. Mannure application 3.58. Fertilizer application 19. Weed<strong>in</strong>g 4.2110. Th<strong>in</strong>n<strong>in</strong>g 311. Gap fill<strong>in</strong>g 412. Irrigation 213. Plant protection measures 014. Cutt<strong>in</strong>g 2.915. Pick<strong>in</strong>g 416. Shift<strong>in</strong>g production to 4.9thresh<strong>in</strong>g floor17. Thresh<strong>in</strong>g 218. W<strong>in</strong>now<strong>in</strong>g 4.519. Dry<strong>in</strong>g <strong>of</strong> gra<strong>in</strong>s 520. Clean<strong>in</strong>g <strong>of</strong> gra<strong>in</strong>s 521. Grad<strong>in</strong>g 4.122. Storage 4.5923. Market<strong>in</strong>g 024. Process<strong>in</strong>g 5MWS = Mean weighted score)Work done(MWS)that sow<strong>in</strong>g, manure application and irrigation wereperformed on field by women 25 to 32.5 percent. Least<strong>in</strong>volvement <strong>of</strong> <strong>farm</strong> women was found <strong>in</strong> plough<strong>in</strong>g <strong>of</strong>field (2%) and <strong>in</strong> fertilizer application was (1%). Therewas no participation <strong>of</strong> women reported <strong>in</strong> market<strong>in</strong>g,plant protection measure.The data <strong>in</strong> Table 3 shows that the transplant<strong>in</strong>g,dry<strong>in</strong>g <strong>of</strong> gra<strong>in</strong>s, clean<strong>in</strong>g <strong>of</strong> gra<strong>in</strong>s and process<strong>in</strong>g weremajor <strong>farm</strong> <strong>activities</strong> which were completely done by<strong>farm</strong> women. Similar results were reported by S<strong>in</strong>ghet.al. (2004). The <strong>farm</strong> operations <strong>in</strong>clud<strong>in</strong>g clean<strong>in</strong>g<strong>of</strong> field, rais<strong>in</strong>g nursery for seedl<strong>in</strong>g ,weed<strong>in</strong>g, gap fill<strong>in</strong>g,pick<strong>in</strong>g, shift<strong>in</strong>g production to thresh<strong>in</strong>g floor, w<strong>in</strong>now<strong>in</strong>g,storage& grad<strong>in</strong>g <strong>in</strong> which major amount <strong>of</strong>work done by <strong>farm</strong> women. They do more than halfwork <strong>of</strong> sow<strong>in</strong>g, th<strong>in</strong>n<strong>in</strong>g, and manure application. The<strong>farm</strong> women do less than half work <strong>of</strong> irrigation, cutt<strong>in</strong>gand thresh<strong>in</strong>g operations. In case <strong>of</strong> plough<strong>in</strong>g <strong>of</strong>field, level<strong>in</strong>g <strong>of</strong> field, and fertilizer application leastamount <strong>of</strong> work was performed by women. Choudharyand S<strong>in</strong>gh (2003) also reported that the role <strong>of</strong> women<strong>in</strong> plough<strong>in</strong>g <strong>of</strong> field, application <strong>of</strong> manure and fertilizerwas found to be very less. The work was also notdone <strong>in</strong> market<strong>in</strong>g and plant protection measure by <strong>farm</strong>women.Efforts were made to f<strong>in</strong>d out the relationship ifexisted between the personal variables <strong>of</strong> women withtheir participations. Table 4 depicts that women agewas negatively correlated with agriculture operations.Obviously the young aged <strong>farm</strong> women are more proneto change. Their physical strength enables them toperform more agriculture <strong>activities</strong>. The f<strong>in</strong>d<strong>in</strong>gs aresupported by Choudhary and S<strong>in</strong>gh (2003). Type <strong>of</strong>family, education level, caste were found non significantwith women participation <strong>in</strong> agriculture. It is also showsby data that land hold<strong>in</strong>g and family <strong>in</strong>come were alsoeffects the participation <strong>farm</strong> women <strong>in</strong> agriculture<strong>activities</strong> significantly.Table 4. Relationship <strong>of</strong> personal variables <strong>of</strong> women withtheir participation <strong>in</strong> agriculture <strong>activities</strong> (N=200)S. No. Personal variables Coefficient <strong>of</strong>correlation “t”1 Age - 4.76*2 Type <strong>of</strong> family 1.28 NS3 Family <strong>in</strong>come 2.13 *4 Land hold<strong>in</strong>g 3.63 *5 Education level 1.4 NS6 Caste 1.08 NS* Significant at 5 percent level <strong>of</strong> significanceNS - Non significantCONCLUSIONThe present study concludes that the women playan significant and crucial role <strong>in</strong> agriculture and alliedfields. Research showed that <strong>farm</strong> women’sparticipation was maximum <strong>in</strong> Cutt<strong>in</strong>g, Pick<strong>in</strong>g, clean<strong>in</strong>g<strong>of</strong> gra<strong>in</strong>s, dry<strong>in</strong>g <strong>of</strong> gra<strong>in</strong>s, storage , process<strong>in</strong>goperations and major part <strong>of</strong> clean<strong>in</strong>g <strong>of</strong> field, rais<strong>in</strong>g
112 Indian Res. J. Ext. Edu. 10 (2), May, 2010nursery for seedl<strong>in</strong>g ,weed<strong>in</strong>g, shift<strong>in</strong>g production tothresh<strong>in</strong>g floor, w<strong>in</strong>now<strong>in</strong>g, & grad<strong>in</strong>g operations arealso done by <strong>farm</strong> women . In case <strong>of</strong> level<strong>in</strong>g <strong>of</strong> field,fertilizer application they do least amount <strong>of</strong> work,whereas there is no participation <strong>of</strong> <strong>farm</strong> women <strong>in</strong>plough<strong>in</strong>g <strong>of</strong> field, plant protection measures andmarket<strong>in</strong>g <strong>activities</strong>. The study also depicts that age,family <strong>in</strong>come, land hold<strong>in</strong>g <strong>in</strong>fluence the womenparticipation <strong>in</strong> agriculture and the women participation<strong>in</strong> agriculture. Type <strong>of</strong> family, education level, cast werenot effected by the women participation <strong>in</strong> agriculture.REFERENCES1. Choudhary, H. and S<strong>in</strong>gh, S. (2003). Farm women <strong>in</strong> agriculture operations. Agri.Ext.Rev. 15 (1):21-23.2. Samanta, R.K. (1994). The reap less than show. The H<strong>in</strong>du. April Issue,Chennai, India.3. S<strong>in</strong>gh, P.; Jhamtani, A.; Bhadauria, C.; Srivastava, R.; S<strong>in</strong>gh, R. and S<strong>in</strong>gh, J. (2004). Participation <strong>of</strong> women <strong>in</strong> agriculture.Ind. J. Ext. Edu. 30 (3&4):23-27.