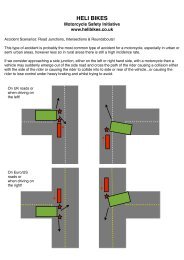
New Zealand Motorcycle Accident Statistics 1980 - Heli Bikes
New Zealand Motorcycle Accident Statistics 1980 - Heli Bikes
New Zealand Motorcycle Accident Statistics 1980 - Heli Bikes

Create successful ePaper yourself
Turn your PDF publications into a flip-book with our unique Google optimized e-Paper software.
Motorcyclists<br />
CRASH FACTSHEET<br />
2011<br />
CRASH STATISTICS FOR THE YEAR ENDED 31 DECEMBER 2010<br />
Prepared by the Ministry of Transport<br />
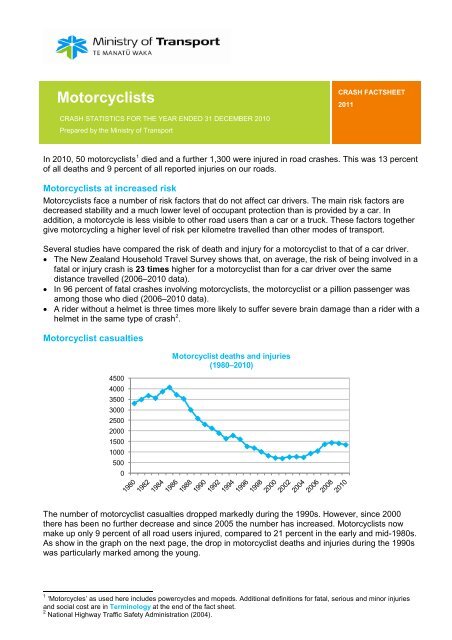
In 2010, 50 motorcyclists 1 died and a further 1,300 were injured in road crashes. This was 13 percent<br />
of all deaths and 9 percent of all reported injuries on our roads.<br />
Motorcyclists at increased risk<br />
Motorcyclists face a number of risk factors that do not affect car drivers. The main risk factors are<br />
decreased stability and a much lower level of occupant protection than is provided by a car. In<br />
addition, a motorcycle is less visible to other road users than a car or a truck. These factors together<br />
give motorcycling a higher level of risk per kilometre travelled than other modes of transport.<br />
Several studies have compared the risk of death and injury for a motorcyclist to that of a car driver.<br />
• The <strong>New</strong> <strong>Zealand</strong> Household Travel Survey shows that, on average, the risk of being involved in a<br />
fatal or injury crash is 23 times higher for a motorcyclist than for a car driver over the same<br />
distance travelled (2006–2010 data).<br />
• In 96 percent of fatal crashes involving motorcyclists, the motorcyclist or a pillion passenger was<br />
among those who died (2006–2010 data).<br />
• A rider without a helmet is three times more likely to suffer severe brain damage than a rider with a<br />
helmet in the same type of crash 2 .<br />
Motorcyclist casualties<br />
4500<br />
4000<br />
3500<br />
3000<br />
2500<br />
2000<br />
1500<br />
1000<br />
500<br />
0<br />
Motorcyclist deaths and injuries<br />
(<strong>1980</strong>–2010)<br />
The number of motorcyclist casualties dropped markedly during the 1990s. However, since 2000<br />
there has been no further decrease and since 2005 the number has increased. Motorcyclists now<br />
make up only 9 percent of all road users injured, compared to 21 percent in the early and mid-<strong>1980</strong>s.<br />
As show in the graph on the next page, the drop in motorcyclist deaths and injuries during the 1990s<br />
was particularly marked among the young.<br />
1 ‘<strong>Motorcycle</strong>s’ as used here includes powercycles and mopeds. Additional definitions for fatal, serious and minor injuries<br />
and social cost are in Terminology at the end of the fact sheet.<br />
2 National Highway Traffic Safety Administration (2004).
Time series<br />
Deaths and injuries of motorcycle riders and pillion passengers, <strong>1980</strong>–2010<br />
Deaths<br />
Injuries<br />
Year Riders Pillion<br />
passengers<br />
Total % road<br />
deaths<br />
Riders Pillion<br />
passengers<br />
Total % road<br />
injuries<br />
<strong>1980</strong> 79 12 91 15% 2753 469 3222 20%<br />
1981 104 12 116 17% 2945 432 3377 22%<br />
1982 99 14 113 17% 3090 478 3568 22%<br />
1983 98 10 108 17% 2970 481 3451 21%<br />
1984 107 18 125 19% 3266 480 3746 21%<br />
1985 118 14 132 18% 3413 527 3940 21%<br />
1986 107 20 127 17% 3161 432 3593 19%<br />
1987 130 14 144 18% 2945 444 3389 18%<br />
1988 125 21 146 20% 2496 365 2861 16%<br />
1989 122 19 141 19% 2153 303 2456 15%<br />
1990 95 19 114 16% 1936 267 2203 12%<br />
1991 64 14 78 12% 1841 217 2058 12%<br />
1992 75 13 88 14% 1606 210 1816 11%<br />
1993 74 6 80 13% 1402 159 1561 10%<br />
1994 61 11 72 12% 1542 179 1721 10%<br />
1995 66 12 78 13% 1379 160 1539 9%<br />
1996 42 6 48 9% 1112 111 1223 8%<br />
1997 52 4 56 10% 1039 103 1142 9%<br />
1998 47 7 54 11% 862 107 969 8%<br />
1999 39 3 42 8% 714 77 791 7%<br />
2000 29 2 31 7% 646 51 697 6%<br />
2001 34 1 35 8% 610 59 669 5%<br />
2002 28 2 30 7% 696 48 744 5%<br />
2003 27 1 28 6% 707 54 761 5%<br />
2004 32 2 34 8% 669 52 721 5%<br />
2005 33 3 36 9% 834 69 903 6%<br />
2006 35 3 38 10% 947 70 1017 7%<br />
2007 37 4 41 10% 1243 93 1336 8%<br />
2008 48 3 51 14% 1314 82 1396 9%<br />
2009 46 2 48 13% 1283 86 1369 9%<br />
2010 47 3 50 13% 1212 88 1300 9%<br />
Motorcyclist deaths and injuries by age group<br />
2000<br />
Deaths and injuries<br />
1800<br />
1600<br />
1400<br />
1200<br />
1000<br />
800<br />
600<br />
15–19 years<br />
20–24 years<br />
25–29 years<br />
30–39 years<br />
40 years and over<br />
400<br />
200<br />
0<br />
Year
Motorcyclist deaths and injuries — selected age groups<br />
15–19 years 20–24 years 25–29 years 30–39 years 40 years and<br />
over<br />
Deaths Injuries Deaths Injuries Deaths Injuries Deaths Injuries Deaths Injuries<br />
<strong>1980</strong> 35 1764 33 800 11 242 8 150 1 146<br />
1981 50 1711 38 895 8 263 10 184 6 160<br />
1982 37 1870 44 962 17 258 12 175 2 152<br />
1983 46 1622 35 1017 8 330 7 186 9 146<br />
1984 46 1693 50 1085 15 397 10 248 3 163<br />
1985 41 1786 48 1106 21 451 13 272 9 179<br />
1986 39 1567 51 991 15 383 14 291 4 210<br />
1987 48 1447 47 914 17 455 23 280 8 185<br />
1988 31 1098 52 813 27 401 19 266 13 163<br />
1989 41 919 38 639 22 355 21 286 11 157<br />
1990 26 769 43 622 17 315 20 254 6 165<br />
1991 21 693 22 571 12 288 11 302 11 148<br />
1992 23 568 29 517 9 244 10 267 15 166<br />
1993 15 484 29 428 18 220 8 232 7 161<br />
1994 7 500 16 519 10 235 18 250 16 172<br />
1995 12 404 21 451 14 226 16 248 9 172<br />
1996 16 277 11 304 7 212 4 212 8 177<br />
1997 8 256 12 245 11 186 12 234 9 178<br />
1998 3 188 14 178 14 160 9 216 12 185<br />
1999 3 145 4 138 7 114 16 185 10 174<br />
2000 3 112 4 117 7 111 8 155 9 174<br />
2001 6 119 4 104 4 81 5 159 14 184<br />
2002 4 151 4 90 4 86 10 169 8 212<br />
2003 3 138 1 106 6 72 8 180 10 231<br />
2004 4 133 5 105 2 73 5 141 17 236<br />
2005 6 165 3 133 3 81 7 186 13 299<br />
2006 3 183 5 148 2 92 15 209 13 343<br />
2007 2 251 5 174 1 121 15 238 17 504<br />
2008 7 203 6 219 6 128 9 268 21 525<br />
2009 3 208 3 199 7 124 16 233 18 560<br />
2010 3 153 9 195 3 110 17 211 17 599<br />
Note: columns do not necessarily add up to the totals due to unknown ages for some riders.<br />
Percentage of motorcyles with known<br />
vehicle cc<br />
25%<br />
20%<br />
15%<br />
10%<br />
5%<br />
0%<br />
Percentage of crash involved motorcycles by cc rating<br />
(2002–2010)<br />
2002 2003 2004 2005 2006 2007 2008 2009 2010<br />
Year<br />
0–59<br />
60–249<br />
250–499<br />
500–749<br />
750–999<br />
1000+<br />
Engine size, in cubic centimetres (cc), is currently not recorded on crash reports for between 9 and<br />
17 percent of crash-involved motorcycles. The graph above is based only on those motorcycles with<br />
recorded engine sizes.
<strong>Motorcycle</strong> size<br />
A higher proportion of crashes involving large bikes (500cc or bigger) result in death<br />
rather than injury — riders of large motorcycles make up 42 percent of all casualties<br />
but 69 percent of deaths. This is, at least partly, a result of riding patterns. Small<br />
motorcycles and scooters tend to be used for ‘around-town’ riding, where speeds<br />
are low, whereas large bikes spend a much greater proportion of time on the open<br />
road and travelling at higher speeds 3 . For bikes 500cc or bigger, over half (54<br />
percent) of all reported injuries are on the open road. This compares to only 15<br />
percent for small bikes with an engine size under 250cc, and a third (33 percent) for<br />
bikes with engine sizes of 250–499cc.<br />
Who was at fault?<br />
Motorcyclist fault in crashes (2006–2010)<br />
Single vehicle,<br />
no motorcyclist<br />
fault identified,<br />
2%<br />
Single vehicle,<br />
motorcyclist at<br />
fault, 31%<br />
Multi vehicle,<br />
no motorcyclist<br />
fault identified,<br />
37%<br />
Multi vehicle,<br />
motorcyclist<br />
primary<br />
responsibility,<br />
24%<br />
Multi vehicle,<br />
motorcyclist<br />
some<br />
responsibility,<br />
7%<br />
Percentage of motorcycle crashes in which a motorcyclist had the<br />
primary responsibility for the crash (2006–2010)<br />
Minor<br />
Serious<br />
Single vehicle<br />
Multiple vehicle<br />
Fatal<br />
0% 20% 40% 60% 80% 100%<br />
Percentage of crashes where motorcyclist has the primary responsibility<br />
for the crash<br />
For more serious crashes, the motorcyclist is more likely to have the primary responsibility 4 for the<br />
crash. The motorcycle rider has the primary responsibility for 68 percent of fatal motorcycle crashes,<br />
but the comparable figure for minor injury crashes is 50 percent.<br />
3 For riding patterns see the Ministry’s fact sheet here www.transport.govt.nz/research/Pages/LatestResults.aspx<br />
4 Primary responsibility (fault) for a crash is based on the crash movements and crash cause factors assigned in the Crash<br />
Analysis System. It is not based on legal liability or court conviction.
Motorcyclist alcohol/drugs and speed involvement in fatal crashes<br />
(2006–2010)<br />
Neither, 56%<br />
Speed, 21%<br />
Alcohol/drugs,<br />
11%<br />
Alcohol/drugs and<br />
Speed, 11%<br />
Of motorcyclists involved in fatal crashes, 22 percent are affected by alcohol/drugs; 32 percent are<br />
travelling too fast for the conditions; and 44 percent are travelling too fast for the conditions and/or<br />
are affected by alcohol/drugs.<br />
Types of crash<br />
Type of crash by speed limit area and crash severity (2006–2010)<br />
Speed limit area<br />
All motorcycle crashes<br />
Movement type Rural Urban Fatal Injury<br />
Fatal Injury Fatal Injury Number % Number %<br />
Overtaking/lane change 9 198 4 172 13 6% 370 6%<br />
Head on 48 185 2 105 50 22% 290 5%<br />
Lost control/run off road 60 1160 24 810 84 37% 1970 32%<br />
Rear end/obstruction 8 225 3 381 11 5% 606 10%<br />
Intersection 31 303 17 1960 48 21% 2263 37%<br />
Manoeuvring/miscellaneous 3 92 10 455 13 6% 547 9%<br />
Pedestrian 3 10 3 86 6 3% 96 2%<br />
Total 162 2173 63 3969 225 100% 6142 100%<br />
The rider losing control of the vehicle is a major feature in motorcycle crashes. As well as those<br />
shown in the ’Lost control/run off road’ category in the table above, over one-third of head-on crashes<br />
result from a rider losing control of the motorcycle.
Percentage of motorcycle crashes where the motorcyclist had the primary<br />
responsibility for the crash (2006–2010)<br />
Overtaking/lane change<br />
Head on<br />
Lost control/run off road<br />
Rear end/obstruction<br />
Intersection<br />
Manoeuvring/miscellaneous<br />
Pedestrian<br />
All motorcycle crashes<br />
Percentage of crashes of this type where motorcyclist had primary responsibility for<br />
crash<br />
0% 10% 20% 30% 40% 50% 60% 70% 80% 90% 100%<br />
Specific crash movements that account for more than 8 percent of all reported motorcycle crashes:<br />
Right turn<br />
against<br />
Lost control<br />
turning right<br />
Crossing<br />
vehicle turning<br />
12%<br />
13%<br />
8%<br />
In this type of crash it is most common that the other vehicle turns across<br />
the path of the motorcyclist. The motorcyclist has the primary responsibility<br />
in only 6 percent of these crashes.<br />
These are single-vehicle crashes in which the motorcycle rider loses<br />
control on a right-hand bend. Loss of control on left-hand bends accounts<br />
for a further 9 percent of crashes and loss of control on the straight also<br />
accounts for a further 9 percent.<br />
In this type of crash it is most common for another vehicle to pull out and<br />
turn across the path of the motorcyclist. The motorcyclist has the primary<br />
responsibility in only 9 percent of these crashes.<br />
When do crashes happen?<br />
Crashes<br />
450<br />
400<br />
350<br />
300<br />
250<br />
200<br />
150<br />
100<br />
50<br />
0<br />
Fatal and injury motorcycle crashes (2006–2010)<br />
Day<br />
Note: Crashes in 4 hour blocks beginning 00:00 Monday.<br />
The peak times for motorcycle crashes are between 12 noon and 4pm on Saturdays and Sundays,<br />
and between 4pm and 8pm on weekdays.
Where do crashes happen?<br />
<strong>Motorcycle</strong> crashes on urban roads (speed limit of 70km/h or less) and open roads<br />
(2006–2010)<br />
Type of road Fatal crashes Injury crashes Total crashes<br />
Urban 63 3,969 4,032<br />
Open road 162 2,173 2,335<br />
Total 225 6,142 6,367<br />
(Note: Rows do not always add to the total as the speed limit is not always recorded)<br />
Nearly two-thirds of all motorcycle injury crashes occur on urban (restricted speed) roads, but nearly<br />
three quarters of fatal crashes are on the open road.<br />
Most casualties are male<br />
• 82 percent of all injured motorcyclists, and 93 percent of motorcyclist deaths, are<br />
males.<br />
Licence status of motorcyclists in crashes<br />
Licence status of riders in crashes<br />
(2006–2010)<br />
Disqualified /<br />
Forbidden,<br />
3%<br />
Never<br />
licenced, 3%<br />
Unknown /<br />
other, 10%<br />
Learner, 20%<br />
Restricted,<br />
8%<br />
Full, 54%<br />
Overseas,<br />
3%<br />
Learner licence holders make up a greater percentage of motorcyclists involved in crashes (20<br />
percent) than car drivers involved in crashes (7 percent). In 2010, motorcyclist learner licence holders<br />
made up 12 percent of all motorcycle licence holders, whereas learner car licence holders made up<br />
only 8 percent of all car licence holders. Fifty-six percent of car learner licence holders were aged<br />
under 25 years old, whereas only 15 percent of motorcycle learner licence holders were aged under<br />
25 years.<br />
Despite the rule that learner and restricted licence holders are not permitted to ride motorcycles with<br />
an engine capacity greater than 250cc, 15 percent of riders on learner licences, and 25 percent of<br />
riders on restricted licences, were riding bikes of over 250cc at the time of their crashes.
Terminology<br />
Fatal injuries: injuries that result in death within 30 days of the crash.<br />
Serious injuries: fractures, concussions, internal injuries, crushings, severe cuts and lacerations,<br />
severe general shock necessitating medical treatment and any other injury involving removal to and<br />
detention in hospital.<br />
Minor injuries: injuries of a minor nature such as sprains and bruises.<br />
Social cost: a measure of the total cost of road crashes to the nation. It includes: loss of life and life<br />
quality; loss of productivity; and medical, legal, court, and property damage costs.<br />
Additional Information<br />
For further information on crash statistics see Motor Vehicle Crashes in <strong>New</strong> <strong>Zealand</strong>, the annual<br />
statistical statement produced by the Ministry of Transport. This publication is available in secondary<br />
school libraries, many public libraries and online at http://www.transport.govt.nz/.<br />
Enquires relating to crash statistics may be directed to the Ministry of Transport, PO Box 3175,<br />
Wellington, or by email at info@transport.govt.nz. For more information about road safety, visit the<br />
Ministry of Transport website at http://www.transport.govt.nz/.<br />
A selection of fact sheets is available via the research section of the Ministry of Transport website.<br />
These include:<br />
Crash facts:<br />
Travel survey:<br />
• Alcohol and drugs<br />
• Comparing travel modes<br />
• Speed<br />
• Driver travel<br />
• Cyclists<br />
• Parking<br />
• Diverted attention<br />
• Walking<br />
• Fatigue<br />
• Cycling<br />
• Motorcyclists<br />
• Public transport<br />
• Pedestrians<br />
• Motorcycling<br />
• Trucks<br />
• Risk on the road<br />
• Young drivers<br />
• Introduction and mode<br />
comparison<br />
• Drivers and their<br />
passengers<br />
• Pedestrians, cyclists and<br />
motorcyclists<br />
Reference: National Highway Traffic Safety Administration (NHTSA) <strong>Motorcycle</strong> Helmet Use Laws<br />
fact sheet. April 2004. www.nhtsa.dot.gov/people/injury/<strong>New</strong>-fact-sheet03/<strong>Motorcycle</strong>Helmet.pdf