Appendix D12 - Irrigation - McArthur River Mining
Appendix D12 - Irrigation - McArthur River Mining
Appendix D12 - Irrigation - McArthur River Mining

You also want an ePaper? Increase the reach of your titles
YUMPU automatically turns print PDFs into web optimized ePapers that Google loves.
Water use options<br />
<strong>McArthur</strong> <strong>River</strong> Mine<br />
Prepared for MET Serv<br />
December 2011<br />
FORESTRY | CROPPING | REHABILITATION | RENEWABLES | CARBON | WATER MANAGEMENT | MINING SERVICES
Tree Crop Technologies Pty Ltd<br />
Brisbane Toowoomba Sydney<br />
Level 14, 97 Creek Street<br />
Brisbane QLD 4000<br />
Tel: +61 (0)7 3221 1102<br />
Fax: +61 (0)7 3221 1136<br />
C/- University of Southern Queensland<br />
West Street<br />
Toowoomba Qld 4350<br />
Tel: +61 (0)7 4631 5320<br />
Suite 2.1, 64 Talavera Rd<br />
North Ryde NSW 2113<br />
Tel: +61 (0)2 9887 3980<br />
Tel: +61 (0)2 9887 3980<br />
info@treecroptech.com.au www.csgwatermanagement.com.au www.treecroptech.com.au<br />
Disclaimer<br />
This confidential report is issued by Tree Crop Technologies Pty Ltd (TCT) for its client’s use only and is not to<br />
be resupplied to any other person without the prior written consent of TCT. Use by, or reliance upon this<br />
document by any other person is not authorised by TCT and without limitation to any disclaimers provided,<br />
TCT is not liable for any loss arising from such unauthorised use or reliance. The report contains TCT’s opinion<br />
and nothing in the report is, or should be relied upon as, a promise or warranty by TCT that outcomes will be<br />
as stated. Future events and circumstances can be significantly different to those assumed in this report. TCT<br />
provides this report on the condition that, subject to any statutory limitation on its ability to do so, TCT<br />
disclaims liability under any cause of action including negligence for any loss arising from reliance upon this<br />
report.<br />
Confidentiality Statement<br />
© Tree Crop Technologies Pty Ltd.<br />
The contents of this report may represent proprietary, confidential information pertaining to Tree Crop<br />
Technologies Pty Ltd (TCT) intellectual property, products and professional service methods and is to be used<br />
solely for its intended purpose. By accepting this document, the recipient hereby agrees that the information in<br />
this document shall not be disclosed to any third party and shall not be duplicated, used, or disclosed for any<br />
purpose other than for its intended purpose.<br />
Dr Glenn Dale<br />
Managing Director and Chief Technical Officer<br />
2 December 2011<br />
C O M M E R C I A L – I N – C O N F I D E N C E<br />
DRN: QTE-007 Revision Date: 28 November 2011<br />
Document Title: MET101 Metserv Report V2 Final<br />
Page ii
Revision history<br />
Revision Author/Reviewer Date Remarks 1<br />
0.1 George Lambert 21/11/11 Working draft<br />
0.2 Steve Brown 23/11/11 Working draft<br />
0.3 Neil Halpin 24/11/11 Working draft<br />
0.4 Dan Rattray 24/11/11 Working draft<br />
0.5 Glenn Dale 24/11/11 Working draft<br />
1.0 Glenn Dale 28/11/11 Final Copy<br />
2.0 Glenn Dale 2/12/11 Final Copy<br />
1. Working draft; Draft for approval; Approved for release; Final copy;<br />
Distribution list<br />
Date Revision Name Title<br />
28/11/11 1.0 Brett Harwood Principal Consultant - Environment<br />
2/12/11 2.0 Brett Harwood Principal Consultant - Environment<br />
C O M M E R C I A L – I N – C O N F I D E N C E<br />
DRN: QTE-007 Revision Date: 28 November 2011<br />
Document Title: MET101 Metserv Report V2 Final<br />
Page iii
Table of contents<br />
TABLE OF CONTENTS ....................................................................................................................................... IV<br />
LIST OF TABLES ................................................................................................................................................. V<br />
LIST OF FIGURES .............................................................................................................................................. VI<br />
GLOSSARY ...................................................................................................................................................... VII<br />
EXECUTIVE SUMMARY .................................................................................................................................. VIII<br />
1. INTRODUCTION ........................................................................................................................................ 1<br />
1.1 EIS .......................................................................................................................................................... 1<br />
1.2 MINE WATER USE OPTIONS ........................................................................................................................... 1<br />
1.3 TERMS OF REFERENCE .................................................................................................................................. 1<br />
2. CLIMATE ................................................................................................................................................... 1<br />
3. SOILS ........................................................................................................................................................ 2<br />
3.1 CRACKING CLAY SOILS (CZ 28) ....................................................................................................................... 2<br />
3.2 YELLOW AND RED MASSIVE EARTHS (CZ 26 & CZ 27) ........................................................................................ 2<br />
3.3 RED DERMOSOL (CZ/PM3 (7,6) .................................................................................................................. 2<br />
4. CONCEPTUAL GROUNDWATER REUSE OPTIONS UTILISING CROP IRRIGATION ........................................ 3<br />
4.1 ANNUAL CROP SPECIES ................................................................................................................................. 3<br />
4.2 ANNUAL FORAGE SPECIES ............................................................................................................................. 4<br />
4.3 PERENNIAL FORAGE SPECIES .......................................................................................................................... 4<br />
4.3.1 Perennial pasture species – black cracking clay soils ........................................................................ 4<br />
4.3.2 Perennial pasture species - Red and yellow earths and red dermosols ............................................. 5<br />
5. CONCEPTUAL GROUNDWATER REUSE OPTIONS UTILISING TREE IRRIGATION ....................................... 10<br />
5.1 KHAYA SENEGALENSIS ................................................................................................................................ 10<br />
5.2 EUCALYPTUS CAMALDULENSIS ..................................................................................................................... 10<br />
5.3 PINUS CARIBAEA ....................................................................................................................................... 10<br />
6. ESTIMATION OF WATER DEMAND ......................................................................................................... 12<br />
6.1 CLIMATIC, CROP FACTOR AND WATER YIELD ASSUMPTIONS ................................................................................ 13<br />
6.2 IRRIGATED PASTURES ................................................................................................................................. 14<br />
6.3 CONTOUR BANK IRRIGATED PASTURES ........................................................................................................... 17<br />
6.4 TREES ..................................................................................................................................................... 21<br />
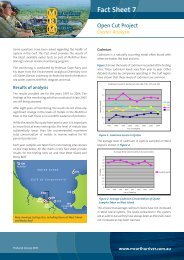
7. WATER QUALITY AND CONCEPTUAL WATER TREATMENT OPTIONS ...................................................... 25<br />
7.1 HARDNESS .............................................................................................................................................. 26<br />
7.2 LANGELIER SATURATION INDEX ................................................................................................................... 27<br />
7.3 SALINITY ................................................................................................................................................. 27<br />
C O M M E R C I A L – I N – C O N F I D E N C E<br />
DRN: QTE-007 Revision Date: 28 November 2011<br />
Document Title: MET101 Metserv Report V2 Final<br />
Page iv
7.4 SODICITY ................................................................................................................................................. 29<br />
7.5 IONIC COMPOSITION.................................................................................................................................. 30<br />
7.6 WATER QUALITY SUMMARY AND TREATMENT REQUIREMENTS ........................................................................... 31<br />
8. ESTIMATES OF COST/ HA OR COST/VOLUME OF WATER FOR EACH OPTION .......................................... 32<br />
8.1 COST SUMMARY ....................................................................................................................................... 32<br />
8.2 PIVIOT IRRIGATED PASTURES (GRASS PLUS LEGUMES) ....................................................................................... 32<br />
8.3 CONTOUR BANK IRRIGATED PASTURES WITH SUPPLEMENTARY PIVOT IRRIGATION ................................................... 33<br />
8.3.1 Contour bank irrigation ................................................................................................................... 33<br />
8.3.2 Pivot irrigation ................................................................................................................................. 33<br />
8.4 FOREST IRRIGATION SPECIES ........................................................................................................................ 34<br />
9. A PREFERRED CONCEPTUAL OPTION ...................................................................................................... 38<br />
9.1 OPTION 1 – PIVOT IRRIGATED PASTURES ....................................................................................................... 38<br />
9.2 OPTION 2 – CONTOUR BANK IRRIGATED PASTURES .......................................................................................... 39<br />
9.3 OPTION 3 – FOREST IRRIGATION .................................................................................................................. 39<br />
10. REFERENCES ........................................................................................................................................... 40<br />
List of Tables<br />
TABLE 1: SUMMARY OF CROP, FORAGE AND PASTURE SPECIES OPTIONS ................................................................................. 8<br />
TABLE 2: SUMMARY OF TREE SPECIES OPTIONS ................................................................................................................ 11<br />
TABLE 3: CLIMATIC, PLANT WATER USE AND WATER INFLOW ASSUMPTIONS .......................................................................... 13<br />
TABLE 4: PER HECTARE WATER BALANCE PARAMETERS – PASTURE IRRIGATION – AVERAGE RAINFALL YEAR .................................. 14<br />
TABLE 5: PASTURE IRRIGATION SCENARIOS – AVERAGE AND 90 TH PERCENTILE RAINFALL YEARS .................................................. 15<br />
TABLE 6: PER HECTARE WATER BALANCE PARAMETERS – PASTURE IRRIGATION – 90 TH PERCENTILE RAINFALL YEAR ........................ 16<br />
TABLE 7: TRADE-OFF BETWEEN PASTURE AREA AND POND STORAGE VOLUME ........................................................................ 17<br />
TABLE 8: EFFECTIVE WATER USE BY CONTOUR BANK IRRIGATED PASTURES, CONSECUTIVE AVERAGE RAINFALL YEARS...................... 20<br />
TABLE 9: EFFECTIVE WATER USE BY CONTOUR BANK IRRIGATED PASTURES, CONSECUTIVE YEAR OF 90 TH PERCENTILE RAINFALL ......... 20<br />
TABLE 10: PER HECTARE WATER BALANCE PARAMETERS – FOREST IRRIGATION – AVERAGE RAINFALL YEAR .................................. 21<br />
TABLE 11: FOREST IRRIGATION SCENARIOS – AVERAGE AND 90 TH PERCENTILE RAINFALL YEARS .................................................. 22<br />
TABLE 12: PER HECTARE WATER BALANCE PARAMETERS – FOREST IRRIGATION – 90 TH PERCENTILE RAINFALL YEAR ........................ 23<br />
TABLE 13: TRADE-OFF BETWEEN FOREST AREA AND POND STORAGE VOLUME ........................................................................ 24<br />
TABLE 14: PALAEOCHANNEL WATER QUALITY ANALYSIS .................................................................................................... 25<br />
TABLE 15: LSI (CARRIER) INDICATION OF CORROSION/FOULING POTENTIAL ................................................. 27<br />
C O M M E R C I A L – I N – C O N F I D E N C E<br />
DRN: QTE-007 Revision Date: 28 November 2011<br />
Document Title: MET101 Metserv Report V2 Final<br />
Page v
TABLE 16: MOLAR AMOUNTS OF PRINCIPAL CATIONS AND ANIONS ...................................................................................... 30<br />
TABLE 17: COST SUMMARY FOR THREE VIABLE IRRIGATED WATER MANAGEMENT OPTIONS ...................................................... 32<br />
TABLE 18: DETAILED COST SCHEDULE – PIVOT IRRIGATION OF PASTURES, AREA AND STORAGE FOR 90 TH RAINFALL ........................ 35<br />
TABLE 19: DETAILED COST SCHEDULE – CONTOUR PLUS PIVOT IRRIGATED PASTURES, AREA AND STORAGE FOR 90 TH RAINFALL ........ 36<br />
TABLE 20: DETAILED COST SCHEDULE – FOREST IRRIGATION, AREA AND STORAGE FOR 90 TH RAINFALL ........................................ 37<br />
List of Figures<br />
FIGURE 1: PROJECTED PIT INFLOW RATES (WRM WATER & ENVIRONMENT PTY LTD) ............................................................ 12<br />
FIGURE 2: RAINFALL/EVAPORATION WATER BALANCE FOR AN AVERAGE (TOP) & 90 TH PERCENTILE (BOTTOM) YEAR ...................... 18<br />
FIGURE 3: HARNESS BY BORE SITE ................................................................................................................................. 26<br />
FIGURE 4: SALINITY (ELECTRICAL CONDUCTIVITY) BY BORE SITE ........................................................................................... 28<br />
FIGURE 5: SODIUM ADSORPTION RATIO (SAR) BY BORE SITE ............................................................................................. 29<br />
FIGURE 6: CONCENTRATION OF DOMINANT PALAEOCHANNEL WATER IONIC COMPONENTS....................................................... 31<br />
C O M M E R C I A L – I N – C O N F I D E N C E<br />
DRN: QTE-007 Revision Date: 28 November 2011<br />
Document Title: MET101 Metserv Report V2 Final<br />
Page vi
Glossary<br />
ANZECC<br />
Ca<br />
dS/m<br />
ECe<br />
ET<br />
ha<br />
K<br />
Kp<br />
l<br />
LSI<br />
mg<br />
Mg<br />
Ml<br />
mm<br />
m molec<br />
Na<br />
SAR<br />
µS/cm<br />
Australian and New Zealand Environment and Conservation Council<br />
Calcium<br />
Deci siemens per metre<br />
Electrical conductivity of a saturated solution extract<br />
Evapotranspiration<br />
Hectare<br />
Potassium<br />
Pan coefficient<br />
Litre<br />
Langellier Saturation Index<br />
Milligram<br />
Magnesium<br />
Megalitre<br />
millimetres<br />
Millimoles charge units<br />
Sodium<br />
Sodium adsorption ratio<br />
Microsiemens per centimetre<br />
C O M M E R C I A L – I N – C O N F I D E N C E<br />
DRN: QTE-007 Revision Date: 28 November 2011<br />
Document Title: MET101 Metserv Report V2 Final<br />
Page vii
Executive Summary<br />
Concept level investigation has been carried out to establish the potential suitability for beneficial<br />
use of <strong>McArthur</strong> <strong>River</strong> mine inflow waters by irrigation of a range of tree and crop types. . The area<br />
investigated includes the mine tenement and surrounding pastoral land.<br />
Investigations ate this stage are based on limited available data. Notwithstanding, the study has<br />
found potential for irrigation development for a number of crop and soil type combinations. More<br />
detailed site investigation will be required, particularly for soil and landscape characteristics, in<br />
order to establish the suitability of specific on-ground sites and to inform irrigation system design.<br />
Crop options<br />
<br />
<br />
<br />
<br />
<br />
Potentially viable crop options from a technical and practical perspective include:<br />
o<br />
o<br />
o<br />
mixed pasture and legume species on red and yellow earth soils and on red dermosols<br />
under pivot/lateral move irrigation;<br />
mixed waterlogging tolerant pasture and legume species on black vertosols under contour<br />
bank irrigation;<br />
tree crops (nominally Khaya senegalensis) on red and yellow earth soils and on red<br />
dermosols under drip irrigation.<br />
Weed potential of specific legume species included in the pasture-legume mix needs to be<br />
considered, e.g., Leucaena may be prone to escape and off-site weed infestation as a result of<br />
seasonal flooding.<br />
Agricultural crops were reviewed but not considered practical for the location and soils due to<br />
the requirement for a very intensive and a high level of management expertise, combined with<br />
distance from markets.<br />
Annual forage cropping is an option more aligned to the existing grazing enterprise, but also<br />
requires a relatively high level of management expertise and may be subject to a number of soil<br />
limitations.<br />
Ponded pastures are technically feasible on the poorly drained black vertosol soils, but suitable<br />
species are generally declared weeds and it is unlikely that this option would not receive<br />
environmental approval.<br />
Water balance<br />
<br />
<br />
<br />
Potential annual plant water use demand for pastures and trees ranges from 2440 mm/yr to<br />
2660 mm/yr.<br />
Daily plant water use demand for pastures and trees ranges from 5.2 to 9.8 mm/day.<br />
The deficit of rainfall to evaporation is very low in the wet season months of December to March<br />
and high in the dry season months of April to November.<br />
C O M M E R C I A L – I N – C O N F I D E N C E<br />
DRN: QTE-007 Revision Date: 28 November 2011<br />
Document Title: MET101 Metserv Report V2 Final<br />
Page viii
In an average rainfall year, there is a rainfall deficit in all months of the year (small in wet season<br />
months).<br />
In a 90 th percentile rainfall year, there is an excess of rainfall over evaporative demand in the<br />
months of January, February and March.<br />
The low to negative wet season rainfall deficit requires some level of balancing storage for any<br />
irrigation solution.<br />
A number of crop/storage option combinations enable full utilisation of all mine water inflows.<br />
These are summarised below based a 16.1 Ml/yr mine water inflow rate, and on irrigation<br />
capacity to utlise rainfall from a succession of 90 th percentile rainfall years.<br />
Option<br />
No<br />
<br />
Crop Option<br />
Hectares required<br />
(ha)<br />
Required storage<br />
volume (Ml)<br />
1 Pivot irrigated pasture 308 2614<br />
2 Contour bank irrigated pasture plus balance of pivot<br />
irrigated pasture<br />
590 1638<br />
3 Forest irrigation (drip) 295 2275<br />
Required storage volume may be reduced to some extent by increasing the crop area, in effect<br />
utlising crops as a wet season storage. The surplus of rainfall over evaporation in wet years<br />
limits the capacity to implement this trade-off.<br />
Water quality and treatment<br />
<br />
<br />
There are no plant or soil impediments to use of the palaeochannel water for irrigation provided<br />
the water is applied to suitable soils and managed appropriately to ensure a leaching fraction<br />
(sufficient to avoid rootzone accumulation) is achieved. Accordingly, there is no requirement to<br />
treat this water for irrigation purposes.<br />
The water does have a high hardness which may cause fouling of irrigation equipment by<br />
scaling. This can be managed by use of poly lined irrigation infrastructure and periodic acid<br />
flushing of irrigation lines.<br />
Recommended options<br />
A hierarchy of three possible irrigation management options is recommended:<br />
1. Pivot irrigation of pasture grasses on red and yellow earths and red dermosol soils, with<br />
balancing storage for low water use months (nil discharge).<br />
2. Contour bank irrigation of water logging tolerant pasture grasses on black soils with<br />
supplementary pivot irrigation of red and yellow soils to utilise excess storage volume (nil<br />
discharge).<br />
3. Drip irrigation of forest species (Khaya senegalensis) on red and yellow earths and red<br />
dermosols soils, with balancing storage for low water use months (nil discharge).<br />
The viability of all options should be reviewed subject to site inspection and detailed soil evaluation.<br />
C O M M E R C I A L – I N – C O N F I D E N C E<br />
DRN: QTE-007 Revision Date: 28 November 2011<br />
Document Title: MET101 Metserv Report V2 Final<br />
Page ix
Total cost per megalitre for these three options over a 15 year project period is estimated at $12.7m,<br />
$13.2m and $10.8m.<br />
Average cost per megalitre for these three options over a 15 year project period is estimated at<br />
$144, $150 and $122 respectively. These are total cost estimates, and do not account for returns<br />
from grazing or timber. Costs will be substantially reduced when grazing/timber returns are<br />
considered.<br />
Potentially suitable soil types (particularly soils described as deep earthy sands, medium to deep<br />
yellow massive earths, and medium to deep red massive or structured earths) occur on the tenement<br />
area and surrounding grazing property.<br />
It should be noted that all options will require some degree of clearing existing native vegetation.<br />
Capacity to secure environmental approvals to allow clearing will need to be established.<br />
C O M M E R C I A L – I N – C O N F I D E N C E<br />
DRN: QTE-007 Revision Date: 28 November 2011<br />
Document Title: MET101 Metserv Report V2 Final<br />
Page x
1. Introduction<br />
1.1 EIS<br />
<strong>McArthur</strong> <strong>River</strong> Mine is a zinc, lead and silver open-cut mine located approximately 60 kilometres<br />
south of Borroloola in the Northern Territory. <strong>McArthur</strong> <strong>River</strong> Mine is owned by Xstrata.<br />
MET Serve is assisting <strong>McArthur</strong> <strong>River</strong> Mine in the preparation of an EIS in support of a proposed<br />
mine expansion.<br />
1.2 Mine water use options<br />
The mine expansion is expected to generate water at rates the order of around 16 Ml per day. MET<br />
Serve has requested Tree Crop Technologies (TCT) to prepare a high level paper on water use<br />
options. Lands on the adjoining <strong>McArthur</strong> <strong>River</strong> Pastoral Lease are available for irrigation.<br />
1.3 Terms of reference<br />
Met Serve has requested TCT to provide:<br />
<br />
<br />
<br />
<br />
<br />
Conceptual groundwater reuse options utilising tree/ crop irrigation;<br />
Estimates of water demand (volume/ha) for various tree/ crop irrigation options;<br />
Estimates of cost/ ha or cost/volume of water for each option;<br />
Conceptual treatment options based on limited water quality data available;<br />
A preferred conceptual option (based on water volume).<br />
2. Climate<br />
The climate is typical of the dry tropics of northern Australia which has a definite wet and dry<br />
season. The wet season generally runs from November to March, the wettest period being from<br />
December to February.<br />
The dry season is usually very dry with very little rain expected from April to October inclusive.<br />
3. Native vegetation<br />
It is assumed that all areas being considered for irrigation development will be suitably cleared of<br />
native vegetation so that development is not impeded. With pasture, it is possible and even<br />
beneficial to retain strategic trees or belts of trees for shade surrounding pivot irrigated areas.<br />
For all proposed irrigation developments, clearing of existing native vegetation will be required,<br />
particularly for pivot irrigation. Capacity to secure environmental approvals to allow clearing will<br />
need to be established. It is possible that a limited degree of clearing may be a condition under the<br />
grazing lease.<br />
C O M M E R C I A L – I N – C O N F I D E N C E<br />
DRN: QTE-007 Revision Date: 28 November 2011<br />
Document Title: MET101 Metserv Report V2 Final Page 1
4. Soils<br />
4.1 Cracking clay soils (Cz 28)<br />
From the data provided, this appears to be a very flat, flood prone, wet area containing melon<br />
holes. Soils are light clays being poorly drained, remaining wet and boggy for long periods during the<br />
wet season. Depending on the size of the melon holes, it may be very difficult to irrigate even<br />
through the dry season.<br />
4.2 Yellow and red massive earths (Cz 26 & Cz 27)<br />
From the data provided, Cz 26 & Cz 27 are on low sloping land (> 2%), either yellow or red massive<br />
earths with hard setting surfaces and reasonably deep profiles with low salts to 100cm+. It is<br />
assumed that unlimited irrigation is available.<br />
4.3 Red Dermosol (Cz/PM3 (7,6)<br />
Cz/PM3(7,6) is a red dermosol to 1.4m deep, but with a hard setting surface.<br />
From experience, it is assumed that these soils are very poor in chemical fertility (particularly P & K),<br />
have very low organic matter content and consequently very low water infiltration rates.<br />
Given the correct mechanical preparation and the support of irrigation, it should be possible to<br />
provide a suitable seed bed in the dry season.<br />
4.4 Suitability of red and yellow earths and dermosols<br />
Although limited soil information is available information, a number of factors indicate the likely<br />
suitability of the red and yellow soil types for irrigation.<br />
Firstly, the red/yellow colour of these soils indicates a high level of oxidation, in turn, indicating that<br />
these soils are freely draining. The yellow soils may be less well drained than the red soils, but<br />
should still be suitable for irrigation.<br />
The soils classed as Earths are now classified as Kandosols under the Australian soil classification.<br />
Both Kandosols and Dermosols are non-texture contrast soils (Dermosols with a structured B<br />
horizon and Kandosols with a massive B horizon). The lack of texture contrast indicates that the B<br />
horizon texture is not strongly contrasting with the surface texture. In contrast, texture contrast<br />
soils, such as Sodosols typically have a relatively low permeability heavy clay B horizon. The<br />
structured B horizon of dermosols indicates that these have good permeability. The massive<br />
structure of the B horizon of Kandosols indicates they lack structure, but this is typically due to a<br />
sandy loam texture which is normally inherently structure-less but free draining. Again, the red<br />
colouration supports this.<br />
Visual inspection of the imagery indicates that the red soils are located higher in the landscape. This<br />
is as expected, but also provides confidence that these soils are reasonably well drained.<br />
C O M M E R C I A L – I N – C O N F I D E N C E<br />
DRN: QTE-007 Revision Date: 28 November 2011<br />
Document Title: MET101 Metserv Report V2 Final Page 2
Soil depth will definitely require significantly more in-depth field investigation. Many pits show<br />
shallow soils, but equally, there are pits (particularly for Cz27 soils) greater than 2m depth. Section<br />
10.3 of the Terrain and Soils report describes moderate to deep earthy sands, medium to deep<br />
yellow massive earths, and medium to deep red massive or structured earths. These would all be<br />
worthy of more detailed investigation for irrigation.<br />
5. Conceptual groundwater reuse options utilising crop irrigation<br />
5.1 Annual crop species<br />
Based on the soils information provided, the only potentially suitable soils are Cz 26, Cz 27 (Red and<br />
Yellow Massive Earths) and Cz/PM3 (7,6) (Red Dermosol). These are not good cropping soils<br />
requiring very special management to prepare them to the stage of being suitable for sowing seed.<br />
Although not stated, it is assumed these soils are very poor in natural fertility and have a low plant<br />
available water holding capacity (PAWC), meaning that anything growing on them would need<br />
regular water applications i.e. 50 to 70 mm of irrigation every 5 to 10 days (depending on plant<br />
maturity) during the dry season.<br />
Possible grain crop options are grain sorghum, maize, soybean, peanuts, millets and even<br />
sugarcane. In southern areas of Queensland, these crops are grown during summer when the risk<br />
of frost is very low. In the <strong>McArthur</strong> <strong>River</strong> region, these crops would be grown during the winter dry<br />
season.<br />
However, limitations would include:<br />
<br />
<br />
<br />
<br />
<br />
<br />
Serious soil problems (hard setting surfaces, low organic matter levels, low fertility, very<br />
poor infiltration rates, low PAWC etc.);<br />
Long distances to transport produce;<br />
Variable prices for product;<br />
Lack of sufficient area to make it worthwhile to invest in infrastructure;<br />
Extremely difficult to access specialised machinery; and<br />
Handling equipment and personal expertise.<br />
Other limitations would include proliferation of insect pests and wild life such as pigs, birds (ducks,<br />
geese, parrots, finches etc.) and other grazing animals which tend to congregate onto isolated<br />
cultivated areas. This situation occurs in isolated areas on good soil in northern central Queensland.<br />
In this region, bird infestations alone make it uneconomic to grow grain sorghum, maize or<br />
sunflowers.<br />
In addition to the above crops, cotton is also a possibility but this crop requires very intensive and a<br />
high level of management expertise. Experience in the Ord river area suggests that insect pests and<br />
weed control may be serious limitations to the growth of cotton. Accordingly, it is not considered a<br />
viable option for <strong>McArthur</strong> <strong>River</strong>.<br />
C O M M E R C I A L – I N – C O N F I D E N C E<br />
DRN: QTE-007 Revision Date: 28 November 2011<br />
Document Title: MET101 Metserv Report V2 Final Page 3
Due to the combination of agronomic and commercial limitations, it is considered that cropping<br />
options are not viable for the <strong>McArthur</strong> <strong>River</strong> region.<br />
5.2 Annual forage species<br />
Forage sorghum, millet and lablab bean are possible species to grow in the well-drained areas<br />
(Cz 26, Cz 27 -Red and Yellow Massive Earths, and Cz/PM3 (7,6) - Red Dermosols). Being annuals,<br />
they need to be sown each year into a prepared seed bed, or by zero tillage methods.<br />
They cannot tolerate water logging for more than a few days and require high soil fertility<br />
conditions. Moisture requirements are high, requiring 50 to 70 mm of good quality water (electrical<br />
conductivity of water – < 0.65 to 1.0 dS/m) on reasonably free draining soil, every 5 to 10 days.<br />
However, they can be grown for grazing or for hay making, the later requiring specialised harvesting<br />
machinery and dry storage facilities. Hay making requires specialised skills.<br />
Annual forage crop species represent a possible alternative if cattle are being grazed on company or<br />
neighbouring properties, but are subject to the same soil management issues as annual crops.<br />
5.3 Perennial forage species<br />
All species listed here are tropical, intolerant to frosts unless specifically stated. They can all<br />
tolerate irrigation water quality to moderate salinity levels (0.65 to 1.3 dS/m conductivity) and<br />
moderate root zone soil salinity levels (ECe 0.95 to 1.9 dS/m).<br />
It is most desirable to combine grasses with legumes so that the latter can provide at least some of<br />
the nitrogen requirements for the companion grasses. All species given below are suited to mixed<br />
grass legume situations.<br />
5.3.1 Perennial pasture species – black cracking clay soils<br />
5.3.1.1 Conventional pasture species<br />
A selection of the best species suited to wet conditions, exhibiting tolerance to flooding, water<br />
logging and low to moderate salinity are listed below.<br />
Grasses<br />
1) Tully humidicola (Brachiara humidicola cv Tully). A strongly stoloniferous, very aggressive<br />
grass. It will tolerate acid, low soil fertility and high sodicity, but will perform well on fertile<br />
soil and responds well to fertiliser.<br />
2) Floren Blue grass (Dichanthium aristatum cv Floren). Tufted. Likes clay soils and tolerates<br />
moderately salinity. Produces extremely well under good fertility conditions. Very palatable.<br />
3) Bambatsi (Panicum coloratum (makarikariense) cv Bambatsi). Tufted. Likes clay soils.<br />
Specifically planted on clay soils of the brigalow flood plains in central Queensland. High<br />
yielding potential.<br />
C O M M E R C I A L – I N – C O N F I D E N C E<br />
DRN: QTE-007 Revision Date: 28 November 2011<br />
Document Title: MET101 Metserv Report V2 Final Page 4
4) Kazungula setaria (Setaria sphacelata (anceps) cv kazungula). Tufted. Very tolerant to<br />
flooding and water logging. High yielding given good soil fertility conditions.<br />
5) Digit grass (Digitaria milanjiana) Stoloniferous. Responds very well to fertility.<br />
Legumes<br />
(1) Glenn & Lee Joint vetch (Aeschyomene Americana). Short lived perennials. Tolerant to<br />
water logging and likes moderate soil fertility conditions.<br />
(2) Vigna luteola. Very productive, short term perennial. Tolerates poorly drained conditions.<br />
The above species are suited to establishment on black cracking clay soils subject to waterlogging,<br />
but may also be cultivated under shallow flooded conditions with a water depth to approximately<br />
0.5 m. This makes these species potentially suited to irrigation via construction of long shallow<br />
contour banks across broad areas. This may be economical where the natural gradient is less than<br />
1.5 o , allowing for wide spacing between water retention banks.<br />
The cultivation of waterlogging tolerant grass and legume species under a contour bank irrigation<br />
approach represents a technically feasible and relatively low cost option to provide a year round<br />
water management option on poorly drained black soil areas, subject to suitably level slope<br />
conditions (
and that reasonable growth should be achieved in the first season. The emphasis is on regular light<br />
irrigations as heavy applications would result in a very high runoff rate. Sprinkler irrigation systems<br />
or even low contour banks (level and only 10 to 20 cm high) would be seen to be the best<br />
alternative in the establishment phase. The idea is to keep the surface moist until germination and<br />
establishment has been achieved.<br />
By retaining all the plant material on the pastured sites for 12 months at least, the soil organic<br />
matter levels should gradually increase making them more receptive to heavier irrigation rates.<br />
Grazing may be commenced after that 12 month establishment phase. Fertiliser use is critical for<br />
pasture growth as growing plant material is the only way to improve the poor soil condition.<br />
The best pasture species options are given below. They are all capable of high dry matter yields and<br />
animal performance if soil fertility requirements are met. Special characteristics are:<br />
Grass species<br />
1) Rhodes grass (Chloris gayana cv Callide & Fine cut) – Quick growing, high growth rates and<br />
dry matter yield potential, tolerates moderate soil and water salinity, requires moderate soil<br />
fertility and tolerates moderate but not regular waterlogging. Both creeping and erect in<br />
habit. It is highly palatable and makes very good hay.<br />
2) Kazungula setaria (Setaria sphacelata (anceps) cv kazungula). Tufted. Very tolerant to<br />
flooding, water logging and drought. High yielding given good soil fertility conditions. It is<br />
quite palatable when young. Not suitable for horses because of high oxalate content.<br />
3) Bisset creeping blue grass (Bothriochloa insculpta cv Bisset). Stoloniferous with low fertility<br />
requirement, but responds very well to high fertility conditions. Slow to establish but then<br />
actively competes with all other companion species. Very palatable and drought tolerant but<br />
responds well to irrigation. Makes very good hay.<br />
4) Tully humidicola – described above. Tully humidicola – (Brachiara humidicola cv Tully). The<br />
toughest tropical grasses around. It is a strongly stoloniferous and very aggressive. It will<br />
tolerate acid, low soil fertility and high sodicity, but will perform well on fertile soil and<br />
responds very well to fertiliser applications. It is readily eaten when young and best managed<br />
by keeping it well grazed. Very aggressively competes against weeds.<br />
Legumes<br />
1) Glenn and Lee joint vetch (as above)<br />
2) Leucaena – under irrigated conditions, it is a forage legume grown in rows 3 to 5 m apart<br />
with a grass grown between the rows. This legume requires high soil fertility conditions<br />
particularly phosphorus. It is usually planted in rows 3 -6 months before sowing the grass to<br />
ensure good establishment before introducing the grass (any of the species mentioned<br />
above). Planting is done with a row planter and if irrigation is available, it could be planted in<br />
March /April at <strong>McArthur</strong> <strong>River</strong> and the soil surface kept wet until emergence to guard<br />
against soil surface crusting. Irrigate as necessary to keep it growing strongly. Weed control<br />
– Spray over the row with spinnaker and keep the weeds out of between the rows before<br />
C O M M E R C I A L – I N – C O N F I D E N C E<br />
DRN: QTE-007 Revision Date: 28 November 2011<br />
Document Title: MET101 Metserv Report V2 Final Page 6
planting the grass. Before grazing, the grass and the Leucaena should be well established<br />
and this may take 12 months. Other special management requirements are to make sure it is<br />
kept from growing too tall for animals to graze. At times this may mean trimming it down to<br />
1 m high. Most times it can be kept under control by heavy grazing. It will also require<br />
applications of phosphorus and perhaps sulphur every 2-3 years depending on soil<br />
requirements. Cattle grazing Leucaena need drenching with a special rumen fluid to<br />
introduce the correct rumen micro-organisms. Notwithstanding the highly productive<br />
grazing potential of Leucaena, there is a very high likelihood of escapes leading to off-site<br />
weed infestation. On this basis, Leucaena is not considered a viable crop option.<br />
3) Centrosema marcrocarpum (brasilianum) – tolerates acid conditions. Produces well under<br />
irrigation and good fertility conditions.<br />
4) Vigna luteola. Very productive, short term perennial. Tolerates poorly drained conditions.<br />
The cultivation of suitable grass and legume pasture species on well drained soils under pivot<br />
irrigation presents a highly feasible option to significantly enhance grazing reliability and yield. This<br />
option is substantially restricted to irrigation during the dry season.<br />
C O M M E R C I A L – I N – C O N F I D E N C E<br />
DRN: QTE-007 Revision Date: 28 November 2011<br />
Document Title: MET101 Metserv Report V2 Final Page 7
Productivity under<br />
fertile conditions<br />
Productivity under<br />
low fertility<br />
Waterlogging<br />
tolerance<br />
Fertility<br />
requirement<br />
Poorly drained<br />
Black soils<br />
Medium to well<br />
drained red soils<br />
Soil salinity<br />
tolerance<br />
Acid tolerance<br />
Weed potential<br />
Breadth of soil<br />
type adaptation<br />
Food crop<br />
Fodder value<br />
Habit<br />
Commercial<br />
suitability<br />
<strong>Irrigation</strong> salinity<br />
Table 1: Summary of crop, forage and pasture species options<br />
Annual crops<br />
Grain sorghum High × Low Yes na <br />
Maize High × Low Yes na <br />
Soybean High × Low Yes na <br />
Peanuts High × Low Yes na <br />
Millets High × Low Yes na <br />
Sugarcane High Low Yes na <br />
Annual forages<br />
Forage sorghum High × na
Productivity under<br />
fertile conditions<br />
Productivity under<br />
low fertility<br />
Waterlogging<br />
tolerance<br />
Fertility<br />
requirement<br />
Poorly drained<br />
Black soils<br />
Medium to well<br />
drained red soils<br />
Soil salinity<br />
tolerance<br />
Acid tolerance<br />
Weed potential<br />
Breadth of soil<br />
type adaptation<br />
Food crop<br />
Fodder value<br />
Habit<br />
Commercial<br />
suitability<br />
<strong>Irrigation</strong> salinity<br />
Ponded pasture<br />
perennial grass spp<br />
Native water couch × Stoloniferous<br />
Para grass × Stoloniferous<br />
Aleman grass × <br />
Tufted and<br />
stoloniferous<br />
Perennial legume<br />
pastures<br />
Glenn & Lee Joint<br />
vetch<br />
Upright <br />
Leucaena Upright shrub <br />
Centrosema<br />
marcrocarpum<br />
Stoloniferous <br />
Vigna luteola Stoloniferous <br />
C O M M E R C I A L – I N – C O N F I D E N C E<br />
DRN: QTE-007 Revision Date: 28 November 2011<br />
Document Title: MET101 Metserv Report V2 Final Page 9
6. Conceptual groundwater reuse options utilising tree irrigation<br />
6.1 Khaya senegalensis<br />
“African Mahogany”, a deciduous evergreen tree that can attain heights from 15 to 30 metre and a<br />
diameter up to 1 metre. It is a useful durable timber species. It’s nominal temperature range being<br />
24.5 – 31.5 degrees and mean annual rainfall from 400 – 1700 mm. It is tolerant to a wide range of<br />
soil conditions, from neutral to very strongly acidic and from well drained, coarse sandy loam to<br />
somewhat poorly drained clay. Khaya prefers neutral, deep, sandy loam soil that is well drained.<br />
Older trees have a resistance to fire but young plantings are susceptible. Pest and disease can be an<br />
issue with incidence of shoot borers and borer attack to sapwood.<br />
Being a high value cabinet wood, African Mahogany is reasonably well suited to production in small,<br />
isolated stands. It is likely that a quality resource would find market opportunities, either by log<br />
export to processing centres in northern Australia, or with initial on-site processing utilising portable<br />
break-down sawing equipment.<br />
6.2 Eucalyptus camaldulensis<br />
“<strong>River</strong> Red Gum”, an Australian native, occurs the length of the Murray Darling Basin extending into<br />
central north Queensland. It is a durable species growing on a range of soils from alluviums through<br />
to heavier clays with a pH range from 4.5 - 8. It tolerates periods of inundation. It’s timber is<br />
extremely durable with wide uses. It is susceptible to insect attack and form issues which may limit<br />
its application in the target region.<br />
6.3 Pinus caribaea<br />
“Caribbean Pine”, from the Caribbean Islands, has been extensively used as a plantation species in<br />
the sub-tropics. Its natural temperature range being 22 – 37 degrees and rainfall from 1000 – 3000<br />
mm. Soils are generally loams or sandy loams and generally well drained and with a pH range from<br />
5.0 – 5.5. It is an excellent timber species though with low durability. Pest and disease is not an<br />
issue with Australian plantings. It is susceptible to fire, especially in its younger years. While<br />
Caribbean pine is a well proven and reliable species throughout northern Australia, it is anticipated<br />
that the relative small resource that could be supported by irrigation at <strong>McArthur</strong> <strong>River</strong> would be<br />
difficult to market due its timber being a commodity wood product.<br />
C O M M E R C I A L – I N – C O N F I D E N C E<br />
DRN: QTE-007 Revision Date: 28 November 2011<br />
Document Title: MET101 Metserv Report V2 Final Page 10
Natural rainfall<br />
range (mm)<br />
Extended drought<br />
tolerance<br />
Frost tolerance<br />
Fire tolerance<br />
Salt tolerance<br />
Sodic soil<br />
tolerance<br />
pH range<br />
Cracking clay soils<br />
Breadth of soil<br />
type adaptation<br />
Commercial<br />
timber<br />
Mature density<br />
Biodiesel<br />
production<br />
Improvement<br />
program<br />
Represented in tax<br />
trials<br />
Represented in<br />
seed orchards<br />
Resistance to leps<br />
and scale<br />
Resistance to fugal<br />
disease<br />
Resistance to<br />
browsing insects<br />
Table 2: Summary of tree species options<br />
Species Climate and fire Soils and adaptation Commercial properties Domestication Pests and diseases<br />
K. senegalensis<br />
E. camaldulensis<br />
P. caribaea<br />
<br />
<br />
400 -<br />
1750<br />
250-<br />
1250<br />
1000-<br />
3000<br />
4.5 –<br />
8.5<br />
4.5-<br />
8.5<br />
850 <br />
? 800 ? ?<br />
5-5.5 650 <br />
C O M M E R C I A L – I N – C O N F I D E N C E<br />
DRN: QTE-007 Revision Date: 28 November 2011<br />
Document Title: MET101 Metserv Report V2 Final Page 11
Inflow Rate (ML/day)<br />
7. Estimation of water demand<br />
Assumptions regarding monthly variation in rainfall, evaporation, plant water use demand and<br />
water yield are summarised in Table 3.<br />
Water inflow assumptions are based on the average monthly variation in projected water yield for<br />
the period 1 January 2022 to 31 December 2036. This represents the period of stable and regular<br />
fluctuation in water inflow rates from year 11 to year 26 in Figure 1 (data provided by Dr Sharmil<br />
Markar, Director / Principal Engineer, WRM Water & Environment Pty Ltd).<br />
Potential per hectare water use of irrigated pastures and trees was modelled for average (50 th<br />
percentile) and wet (90 th percentile) rainfall years. Watload is a monthly time-step model.<br />
Figure 1: Projected pit inflow rates (WRM Water & Environment Pty Ltd)<br />
25<br />
Draft<br />
MRMP7 - Pit Inflow Rate all parameters as for MRMP5<br />
except Dolomite (K = 0.1 to 0.5 m/day) from Kaft…<br />
Modified…<br />
20<br />
15<br />
10<br />
5<br />
0<br />
0 1 2 3 4 5 6 7 8 9 10 11 12 13 14 15 16 17 18 19 20 21 22 23 24 25 26<br />
Years<br />
C O M M E R C I A L – I N – C O N F I D E N C E<br />
DRN: QTE-007 Revision Date: 28 November 2011<br />
Document Title: MET101 Metserv Report V2 Final Page 12
7.1 Climatic, crop factor and water yield assumptions<br />
Table 3: Climatic, plant water use and water inflow assumptions<br />
Month Jan Feb Mar Apr May Jun Jul Aug Sep Oct Nov Dec Annual<br />
Average (50 th percentile)<br />
rainfall (mm)<br />
208.4 186.7 143.7 33.7 7.3 1.7 2.4 0.4 4.9 21.2 49.1 122.1 784.2<br />
90 th percentile rainfall (mm) 415 368 291.4 79.2 16.4 4 1.2 0.2 11.9 56.5 133.5 207.1 1202.4<br />
Mean daily evaporation (mm) 7.4 6.7 6.7 6.8 6.4 5.8 5.9 7.2 8.9 9.7 9.9 8.9 7.5(av)<br />
Mean monthly evap (mm) 229.4 187.6 207.7 204 198.4 174 182.9 223.2 267 300.7 297 275.9 2747.8<br />
Pasture pan coefficient 0.84 0.89 0.91 0.90 0.89 0.90 0.90 0.87 0.89 0.87 0.91 0.90 0.89(av)<br />
Tree pan coefficient 0.92 0.97 0.99 0.98 0.97 0.98 0.98 0.95 0.97 0.95 0.99 0.98 0.97(av)<br />
ET trees (mm/day) 6.8 6.5 6.6 6.7 6.2 5.7 5.8 6.8 8.6 9.2 9.8 8.7 7.3(av)<br />
ET trees (mm/month) 211.0 182.0 205.6 199.9 192.4 170.5 179.2 212.0 259.0 285.7 294.0 270.4 2662<br />
ET pasture (mm/day) 6.2 6.0 6.1 6.1 5.7 5.2 5.3 6.3 7.9 8.4 9.0 8.0 6.7(av)<br />
ET pasture (mm/month) 192.7 167.0 189.0 183.6 176.6 156.6 164.6 194.2 237.6 261.6 270.3 248.3 2442<br />
ET past. practical (mm/month) 0 0 0 183.6 176.6 156.6 164.6 194.2 237.6 261.6 270.3 0 1645<br />
Water inflow (Ml/day) 22.4 20.7 16.1 14.0 13.2 13.1 12.8 12.6 13.8 15.0 18.0 21.4 16.1(av)<br />
Water inflow (Ml/month) 694.7 580.1 500.6 419.5 409.6 393.2 395.3 391.7 414.0 466.0 539.2 663.3 5867.2<br />
C O M M E R C I A L – I N – C O N F I D E N C E<br />
DRN: QTE-007 Revision Date: 28 November 2011<br />
Document Title: MET101 Metserv Report V2 Final Page 13
7.2 Irrigated pastures<br />
Irrigated pastures are suitable for the medium to well-drained, red and yellow earths and red<br />
dermosols. Centre pivot or lateral move irrigation is suitable for these soil types subject to more<br />
detailed evaluation of specific site conditions (slope, landform, adequate area). Preliminary visual<br />
inspection of satellite imagery in combination with limited soil type maps indicates that it should be<br />
possible to locate suitable areas of red/yellow soils for installation of centre pivots.<br />
Although pastures in this region have a high year round potential water demand, pivot irrigation in<br />
the wet season months is likely to be impractical due to access problems, and practical<br />
considerations relating to operation of pivots under excessively wet conditions. In any event, the<br />
potential irrigation loading in the wet season months is relatively low due to the majority of plant<br />
water use demand being met by rainfall. Accordingly, it has been assumed for design purposes, that<br />
irrigation water is not applied in the months of December to March inclusive.<br />
Preliminary calculations of leaching requirement necessary to maintain the rootzone salinity at less<br />
than 2 dS/m, indicate a leaching requirement in the order of 12% based on an irrigation rate of<br />
2300 mm/yr. Based on this leaching fraction, and assuming a sprinkler irrigation efficiency of 85%,<br />
per hectare water balance parameters for an average rainfall year are detailed in Table 10. Based<br />
on this scenario, irrigation loading rate is 2036 mm/ha/yr (20.4 Ml/ha/yr).<br />
Table 4: Per hectare water balance parameters – Pasture irrigation – average rainfall year<br />
Pan evaporation Pasture water <strong>Irrigation</strong> loading<br />
Month Rainfall (mm)<br />
(mm/ha) use (mm/ha) (mm/ha)<br />
Jan 208.4 229.4 193 0<br />
Feb 186.7 187.6 167 0<br />
Mar 143.7 207.7 189 0<br />
Apr 33.7 204 184 206<br />
May 7.3 198.4 177 224<br />
Jun 1.7 174 157 204<br />
Jul 2.4 182.9 165 214<br />
Aug 0.4 223.2 194 255<br />
Sep 4.9 267 238 307<br />
Oct 21.2 300.7 262 322<br />
Nov 49.1 297 270 303<br />
Dec 122.1 275.9 248 0<br />
Annual 781.6 2,748 2442 2036<br />
C O M M E R C I A L – I N – C O N F I D E N C E<br />
DRN: QTE-007 Revision Date: 28 November 2011<br />
Document Title: MET101 Metserv Report V2 Final Page 14
Based on these per hectare water balance characteristics, the overall design parameter of an<br />
irrigation system designed to achieve 100% utilisation of water (based on average annual rainfall), is<br />
summarised in the second column of Table 11. Under this scenario, assuming an annual<br />
groundwater production of 5685 Ml/yr (average 16.1 Ml/day) 100% of water can be consumed by<br />
pivot irrigation of a minimum area of 263 ha of pastures irrigated at the rate of 2036 mm/ha/yr,<br />
requiring a minimum pond storage of 2399 Ml (approximately 40 ha at an average depth of 6m).<br />
Table 5: Pasture irrigation scenarios – average and 90 th percentile rainfall years<br />
50th percentile 90 th percentile<br />
Water balance component<br />
rainfall year<br />
rainfall year<br />
Total groundwater produced per year 5865 Ml/yr 5865 Ml/yr<br />
Minimum pasture area required 263 ha 307.7 ha<br />
Annual effluent loading rate 2036 mm/ha/yr 1838 mm/ha/yr<br />
Minimum pond storage required 2399 Ml 2614 Ml<br />
Pond area (assuming average depth of 6m) 40.0 ha 43.6 ha<br />
Annual net pond loss/gain 676 Ml 387 Ml<br />
Total excess rainfall 542 mm 1051 mm<br />
Number of months of excess rainfall 4 4<br />
<strong>Irrigation</strong> method & rotation type Sprinkler (Pivot) Sprinkler (Pivot)<br />
Leaching Fraction 12% 12%<br />
Proportion of maximum <strong>Irrigation</strong> load applied 1.00 1.00<br />
Table 12 presents per hectare water balance parameter for pasture irrigation in a 90 th percentile<br />
rainfall year. Based on this scenario, irrigation loading rate is reduced to 1838 mm/ha/yr<br />
(18.4 Ml/ha/yr).<br />
Based on these per hectare water balance characteristics, the overall design parameter of an<br />
irrigation system designed to achieve 100% utilisation of water in an 90 th percentile rainfall), is<br />
summarised in the third column of Table 11. Under this scenario, assuming an annual groundwater<br />
production of 5685 Ml/yr (average 16.1 Ml/day) 100% of water can be consumed by pivot irrigation<br />
of a minimum area of 308 ha of pasture irrigated at the rate of 1838 mm/ha/yr, requiring a<br />
minimum pond storage of 2614 Ml (approximately 44 ha at an average depth of 6m).<br />
C O M M E R C I A L – I N – C O N F I D E N C E<br />
DRN: QTE-007 Revision Date: 28 November 2011<br />
Document Title: MET101 Metserv Report V2 Final Page 15
Table 6: Per hectare water balance parameters – Pasture irrigation – 90 th percentile rainfall year<br />
Pan evaporation Pasture water <strong>Irrigation</strong> loading<br />
Month Rainfall (mm)<br />
(mm)<br />
use (mm)<br />
(mm)<br />
Jan 415 229 211 0<br />
Feb 368 188 182 0<br />
Mar 291.4 208 206 0<br />
Apr 79.2 204 200 156<br />
May 16.4 198 192 214<br />
Jun 4 174 171 202<br />
Jul 1.2 183 179 216<br />
Aug 0.2 223 212 256<br />
Sep 11.9 267 259 299<br />
Oct 56.5 301 286 284<br />
Nov 133.5 297 294 212<br />
Dec 207.1 276 270 0<br />
Annual 1584.4 2748 2662 1838<br />
An alternative strategy to minimising pasture area by offsetting water surplus in the wet months<br />
with pond storage is to increase the pasture area, effectively utilising irrigated pastures as a<br />
balancing storage. This strategy involves deficit irrigation of the pasture area.<br />
Where the marginal value of pasture area required to utilise 1 Ml of water is less than the cost of<br />
dam storage for 1 Ml, this strategy will prove more economic. The trade-off between pasture area<br />
and pond storage volume for an average rainfall year is summarised in Table 13. It can be seen that<br />
pond storage can be virtually, but not fully eliminated for an average rainfall year with a pasture<br />
area of 3000 ha (residual storage volume requirement of 148 Ml). Note, however, economic<br />
pasture production requires intensive management and fertiliser application. Returns in<br />
productivity from pasture improvement are unlikely to be realised below an irrigation water supply<br />
of approximately 50% of the rainfall deficit. At this irrigation rate, pasture area is approximately 560<br />
ha, and storage volume requirement is 1196 Ml (20 ha). It is not recommended that a deficit<br />
irrigation strategy is requiring larger pasture areas be utilised.<br />
C O M M E R C I A L – I N – C O N F I D E N C E<br />
DRN: QTE-007 Revision Date: 28 November 2011<br />
Document Title: MET101 Metserv Report V2 Final Page 16
Pasture area (ha)<br />
Storage volume (Ml)<br />
Table 7: Trade-off between pasture area and pond storage volume<br />
Pasture<br />
area<br />
(ha)<br />
Storage<br />
volume<br />
(Ml)<br />
Storage<br />
area<br />
(ha)<br />
350 1531 25.5<br />
400 1401 23.4<br />
500 1259 21.0<br />
600 1155 19.3<br />
700 1052 17.5<br />
800 974 16.2<br />
900 937 15.6<br />
1000 899 15.0<br />
1500 712 11.9<br />
2000 524 8.7<br />
3000 148 2.5<br />
3500<br />
3000<br />
2500<br />
2000<br />
1500<br />
1000<br />
500<br />
0<br />
1 2 3 4 5 6 7 8 9 10 11 12<br />
Pasture area<br />
Storage volume<br />
1800<br />
1600<br />
1400<br />
1200<br />
1000<br />
800<br />
600<br />
400<br />
200<br />
0<br />
7.3 Contour bank irrigated pastures<br />
Contour bank irrigated pastures are potentially suited to the relatively low permeability, black<br />
vertosol soils with grades of less than 1 o .<br />
The concept of contour bank irrigated pastures is a less conventional approach to water<br />
management, but has potential in the circumstances of the present project.<br />
A potential downside of contour bank irrigated pastures would be control of wild life particularly<br />
pigs, large water loving snakes and crocodiles. Experience from central Queensland indicates water<br />
birds may be attracted, but are not a major production consideration. Conversely, this may have<br />
positive environmental benefits.<br />
Contour bank irrigated pastures can be expected to evaporate water at a rate equivalent to the pan<br />
evaporation rate (rate of evaporation from a ponded surface), and effective water use per hectare is<br />
therefore pan evaporation less rainfall, assuming these pastures are constructed to exclude run-on.<br />
A comparison of rainfall and evaporation, plus monthly net deficit/surplus of rainfall over<br />
evaporative losses, is illustrated in Figure 2 for an average and 90 th percentile rainfall year.<br />
C O M M E R C I A L – I N – C O N F I D E N C E<br />
DRN: QTE-007 Revision Date: 28 November 2011<br />
Document Title: MET101 Metserv Report V2 Final Page 17
Figure 2: Rainfall/evaporation water balance for an average (top) & 90 th percentile (bottom) year<br />
Effective water use per hectare for an average rainfall year is summarised in Table 8. Under this<br />
scenario, a 350 ha area of irrigated contour bank pastures flooded to 50 cm will hold a total volume<br />
of 1750 Ml. This is sufficient to absorb projected mine infows plus rainfall. The water held by the<br />
contour bank irrigated pastures increases to a peak of 1600 Ml in March, then gradually declines to<br />
zero in the months of September, October and November, before filling again from December.<br />
Under this scenario, the 330 should be able to operate as a closed system. However, this system<br />
has no buffer for above average rainfall years.<br />
C O M M E R C I A L – I N – C O N F I D E N C E<br />
DRN: QTE-007 Revision Date: 28 November 2011<br />
Document Title: MET101 Metserv Report V2 Final Page 18
Effective water use per hectare for a 90 th percentile rainfall year is summarised in Table 9 Under<br />
this scenario, a 500 ha area of irrigated contour bank pastures flooded to 50 cm will hold a total<br />
volume of 2500 Ml. This is sufficient to absorb projected mine infows plus rainfall in all months<br />
except February and March. Excess water from these months must be removed to storage<br />
(potentially for pivot irrigation of pastures). The water held by the pastures increases reaches peak<br />
capacity of 2500 Ml in March and April, then gradually declines to zero in the months of October<br />
and November, before filling again from December. Under this scenario, the 500 pasture area<br />
requires a storage volume of approximately 1638 Ml (allowing for rainfall inputs), requiring a<br />
ponded area of approximately 31 ha (based on a depth of 6m). This buffer allowance requires<br />
operation in conjunction with an alternative offtake system, but provides robust capacity to manage<br />
all mine inflows in a wet year.<br />
C O M M E R C I A L – I N – C O N F I D E N C E<br />
DRN: QTE-007 Revision Date: 28 November 2011<br />
Document Title: MET101 Metserv Report V2 Final Page 19
Table 8: Effective water use by contour bank irrigated pastures, consecutive average rainfall years<br />
Parameter - Average year sequence Dec Jan Feb Mar Apr May Jun Jul Aug Sep Oct Nov<br />
Pasture area (ha) 350 350 350 350 350 350 350 350 350 350 350 350<br />
Pasture flood depth (cm) 50 50 50 50 50 50 50 50 50 50 50 50<br />
Pasture storage capacity (Ml) 1750 1750 1750 1750 1750 1750 1750 1750 1750 1750 1750 1750<br />
Starting volume (Ml) 0 125 746 1323 1600 1424 1164 955 718 330 0 0<br />
Mine inflow (Ml) 663 695 580 501 420 410 393 395 392 414 466 539<br />
Net Pasture water losses (+ve)/gains (-ve) 538 74 3 224 596 669 603 632 780 917 978 868<br />
Spare Capacity (Ml) 1625 1004 427 150 326 586 795 1032 1420 1923 2262 2078<br />
Water held (Ml) 125 746 1323 1600 1424 1164 955 718 330 0 0 0<br />
Table 9: Effective water use by contour bank irrigated pastures, consecutive year of 90 th percentile rainfall<br />
Parameter - Average year sequence Dec Jan Feb Mar Apr May Jun Jul Aug Sep Oct Nov<br />
Pasture area (ha) 500 500 500 500 500 500 500 500 500 500 500 500<br />
Pasture flood depth (cm) 50 50 50 50 50 50 50 50 50 50 50 50<br />
Pasture storage capacity (Ml) 2500 2500 2500 2500 2500 2500 2500 2500 2500 2500 2500 2500<br />
Starting volume (Ml) 0 319 1942 2500 2500 2296 1795 1339 825 102 0 0<br />
Mine inflow (Ml) 663 695 580 501 420 410 393 395 392 414 466 539<br />
Net Pasture water losses (+ve)/gains (-ve) 344 -928 -902 -419 624 910 850 909 1115 1276 1221 818<br />
Spare Capacity (Ml) 2181 558 -924 1 -919 1 204 705 1162 1675 2398 3259 3255 2778<br />
Water held (Ml) 319 1942 3424 3419 2296 1795 1339 825 102 0 0 0<br />
Water held after removal of excess to<br />
storage(Ml) 319 1942 2500 2500 2296 1795 1339 825 102 0 0 0<br />
1. Overtopping of contour banks, diverted to storage for pivot irrigation.<br />
C O M M E R C I A L – I N – C O N F I D E N C E<br />
DRN: QTE-007 Revision Date: 28 November 2011<br />
Document Title: MET101 Metserv Report V2 Final Page 20
7.4 Trees<br />
Irrigated trees are suitable for the medium to well-drained, red and yellow earths and red<br />
dermosols. Drip irrigation is the only practical method for irrigation of trees on these soils.<br />
Preliminary calculations of leaching requirement necessary to maintain the rootzone salinity at less<br />
than 2 dS/m, indicate a leaching requirement in the order of 12% based on an irrigation rate of<br />
2300 mm/yr. Based on this leaching fraction, and assuming a drip irrigation efficiency of 95%, per<br />
hectare water balance parameters for an average rainfall year are detailed in Table 10. Based on<br />
this scenario, irrigation loading rate is 2381 mm/ha/yr (23.8 Ml/ha/yr).<br />
Table 10: Per hectare water balance parameters – Forest irrigation – average rainfall year<br />
Pan evaporation Plantation water <strong>Irrigation</strong> loading<br />
Month Rainfall (mm)<br />
(mm/ha) use (mm/ha) (mm/ha)<br />
Jan 208.4 229.4 211 47<br />
Feb 186.7 187.6 182 34<br />
Mar 143.7 207.7 206 103<br />
Apr 33.7 204 200 203<br />
May 7.3 198.4 192 219<br />
Jun 1.7 174 171 199<br />
Jul 2.4 182.9 179 209<br />
Aug 0.4 223.2 212 250<br />
Sep 4.9 267 259 300<br />
Oct 21.2 300.7 286 316<br />
Nov 49.1 297 294 299<br />
Dec 122.1 275.9 270 201<br />
Annual 781.6 2,748 2,662 2,381<br />
Based on these per hectare water balance characteristics, the overall design parameter of an<br />
irrigation system designed to achieve 100% utilisation of water (based on average annual rainfall), is<br />
summarised in the second column of Table 11. Under this scenario, assuming an annual<br />
groundwater production of 5685 Ml/yr (average 16.1 Ml/day) 100% of water can be consumed by<br />
drip irrigation of a minimum area of 236 ha of trees irrigated at the rate of 2381 mm/ha/yr,<br />
requiring a minimum pond storage of 1515 Ml (approximately 25.9 ha at an average depth of 6m).<br />
C O M M E R C I A L – I N – C O N F I D E N C E<br />
DRN: QTE-007 Revision Date: 28 November 2011<br />
Document Title: MET101 Metserv Report V2 Final Page 21
Table 11: Forest irrigation scenarios – average and 90 th percentile rainfall years<br />
50th percentile 90 th percentile<br />
Water balance component<br />
rainfall year<br />
rainfall year<br />
Total groundwater produced per year 5865 Ml/yr 5865 Ml/yr<br />
Minimum plantation area required 235.8 ha 294.7 ha<br />
Annual effluent loading rate 2381 mm/ha/yr 1937 mm/ha/yr<br />
Minimum pond storage required 1515 Ml 2275 Ml<br />
Pond area (assuming average depth of 6m) 25.3 ha 37.9 ha<br />
Annual net pond loss/gain 427 Ml 337.0 Ml<br />
Total excess rainfall 0 mm 282.0 mm<br />
Number of months of excess rainfall 0 3<br />
<strong>Irrigation</strong> method & rotation type Drip Drip<br />
Leaching Fraction 12% 12%<br />
Proportion of maximum <strong>Irrigation</strong> load applied 1.00 1.00<br />
Table 12 presents per hectare water balance parameter for forest irrigation in a 90 th percentile<br />
rainfall year. Based on this scenario, irrigation loading rate is reduced to 1937 mm/ha/yr<br />
(19.4 Ml/ha/yr).<br />
Based on these per hectare water balance characteristics, the overall design parameter of an<br />
irrigation system designed to achieve 100% utilisation of water in an 90 th percentile rainfall), is<br />
summarised in the third column of Table 11. Under this scenario, assuming an annual groundwater<br />
production of 5685 Ml/yr (average 16.1 Ml/day) 100% of water can be consumed by drip irrigation<br />
of a minimum area of 295 ha of trees irrigated at the rate of 1937 mm/ha/yr, requiring a minimum<br />
pond storage of 2275 Ml (approximately 37.9 ha at an average depth of 6m).<br />
C O M M E R C I A L – I N – C O N F I D E N C E<br />
DRN: QTE-007 Revision Date: 28 November 2011<br />
Document Title: MET101 Metserv Report V2 Final Page 22
Table 12: Per hectare water balance parameters – Forest irrigation – 90 th percentile rainfall year<br />
Pan evaporation Plantation water <strong>Irrigation</strong> loading<br />
Month Rainfall (mm)<br />
(mm)<br />
use (mm)<br />
(mm)<br />
Jan 415 229 211 0<br />
Feb 368 188 182 0<br />
Mar 291.4 208 206 0<br />
Apr 79.2 204 200 159<br />
May 16.4 198 192 209<br />
Jun 4 174 171 197<br />
Jul 1.2 183 179 210<br />
Aug 0.2 223 212 250<br />
Sep 11.9 267 259 293<br />
Oct 56.5 301 286 282<br />
Nov 133.5 297 294 218<br />
Dec 207.1 276 270 119<br />
Annual 1584.4 2748 2662 1937<br />
An alternative strategy to minimising forest area by offsetting water surplus in the wet months with<br />
pond storage is to increase the forest area, effectively utilising the forest as a balancing storage.<br />
This strategy involves deficit irrigation of the forest plantation area.<br />
Where the marginal value of forest area required to utilise 1 Ml of water is less than the cost of dam<br />
storage for 1 Ml, this strategy will prove more economic. The trade-off between forest area and<br />
pond storage volume for an average rainfall year is summarised in Table 13. It can be seen that<br />
pond storage can be eliminated for an average rainfall year with a forest area of 1910 ha. Note,<br />
however, that tree production will fall as the irrigation supply falls below approximately 50% of the<br />
rainfall deficit (i.e., below approximately 490 ha of irrigated forest, requiring a storage volume of<br />
1011 Ml).<br />
C O M M E R C I A L – I N – C O N F I D E N C E<br />
DRN: QTE-007 Revision Date: 28 November 2011<br />
Document Title: MET101 Metserv Report V2 Final Page 23
Forest area (ha)<br />
Storage volume (Ml)<br />
Table 13: Trade-off between forest area and pond storage volume<br />
Forest<br />
area<br />
(ha)<br />
Storage<br />
volume<br />
(Ml)<br />
Storage<br />
area<br />
(ha)<br />
250 1601 26.7<br />
300 1433 23.9<br />
400 1152 19.2<br />
500 996 16.6<br />
700 766 12.8<br />
800 694 11.6<br />
900 621 10.3<br />
1000 548 9.1<br />
1500 185 3.1<br />
1910 0 0.0<br />
2500<br />
2000<br />
1500<br />
1000<br />
500<br />
0<br />
1 2 3 4 5 6 7 8 9 10 11<br />
Forest area<br />
Storage volume<br />
1800<br />
1600<br />
1400<br />
1200<br />
1000<br />
800<br />
600<br />
400<br />
200<br />
0<br />
C O M M E R C I A L – I N – C O N F I D E N C E<br />
DRN: QTE-007 Revision Date: 28 November 2011<br />
Document Title: MET101 Metserv Report V2 Final Page 24
8. Water quality and conceptual water treatment options<br />
Water quality provided by MET Serv is based on monitoring bores which intercept one or two<br />
palaeochannels containing permeable sands and gravels that pass to the east of the existing<br />
<strong>McArthur</strong> <strong>River</strong> channel. The base of the palaeochannels is up to 34m below ground surface (RL<br />
5 m). Width is approximately 800m across the southern perimeter of the mine pit and represents a<br />
significant source of groundwater. Incomplete data, sampled over an 18 month period from June<br />
2009 to December 2010, is available from nine bores. Full data is detailed by MET Serv in the report<br />
“Assessment of Palaeochannel Water Quality for <strong>McArthur</strong> <strong>River</strong> Mine May 2011”. A summary of<br />
average data for all available analyses is presented in Table 14.<br />
Table 14: Palaeochannel water quality analysis<br />
Category<br />
Analysis<br />
Analysis<br />
value<br />
ANZECC<br />
Long Term<br />
Trigger<br />
Value -<br />
<strong>Irrigation</strong><br />
Physico-chemical pH 7.35 6-8.5<br />
ANZECC<br />
Stock<br />
Watering<br />
Guidelines<br />
Electrical Conductivity (EC)(µS/cm) 1451<br />
Salinity (PSS) 0.56<br />
Total Dissolved Solids (TDS) (mg/l) 869 4000<br />
Turbidity (NTU) 44.3<br />
Dissolved Oxygen (mg/l) 0.76<br />
Hardness (mg/l)<br />
< 60 1<br />
751<br />
>350 2<br />
Cations Calcium (mg/l) 109 1000<br />
Magnesium (mg/l) 110<br />
Sodium (mg/l) 48.3 230 3<br />
Potassium (mg/l) 0.0087<br />
Sulfate (mg/l) 130 1000<br />
SAR 0.70<br />
Anions Chloride (mg/l) 118 350 4<br />
Carbonate/Bicarbonate alkalinity (mg/l) 751<br />
Metals Arsenic (mg/l) 0.0042 0.1 0.5<br />
Cadmium (mg/l) 0.00017 0.01 0<br />
Copper (mg/l) 0.00065 0.2 1<br />
Lead (mg/l) 0.0014 2 0.1<br />
Zinc (mg/l) 0.056 2 20<br />
1. Hardness < 60 with respect to corrosion<br />
2. Hardness > 350 with respect to fouling.<br />
3. With respect to foliar injury to moderately tolerant plants<br />
4. With respect to increased cadmium uptake by crops (
Hardness (mg/l)<br />
Comparison of the available palaeochannel data indicates that only hardness exceeds the<br />
recommended ANZECC water quality guidelines for irrigation use. No analytes exceed the ANZECC<br />
water quality guidelines for stock watering.<br />
MET Serve report that two results exceeded the ANZECC <strong>Irrigation</strong> trigger value for Chloride. The<br />
reported trigger value is based on the effect of chloride with respect to increased cadmium uptake<br />
by crops. Based on a blended average as would be expected in any water collected for irrigation,<br />
chloride levels are well below the nominated trigger value and are not of practical concern.<br />
Notwithstanding, this should be reassessed on a weighted average basis in the development of any<br />
future irrigation scheme.<br />
8.1 Hardness<br />
The variation in average hardness between bore sites is illustrated in Figure 3.<br />
Figure 3: Harness by bore site<br />
1400<br />
1200<br />
1000<br />
800<br />
600<br />
400<br />
200<br />
0<br />
MAC3P T3-1 T3-3 T4-3s T4-4s T5-1 T5-3<br />
(GW36)(GW35)(GW74)(GW76)(GW67)(GW37)<br />
WDL<br />
T6-1<br />
(GW66)<br />
T6-2<br />
(GW34)<br />
WDL<br />
Water hardness is primarily the amount of calcium and magnesium, and to a lesser extent, iron in<br />
the water, measured by adding up the concentrations of calcium, magnesium and converting this<br />
value to an equivalent concentration of calcium carbonate (CaCO3) in milligrams per litre (mg/L) of<br />
water.<br />
The principal concerns in relation to hardness are its effect on fouling or corrosion potential of<br />
irrigation systems rather than effects on plants or soils per se.<br />
As noted by MET Serv, every groundwater bore monitored exceeded the ANZECC guidelines for<br />
hardness with respect to fouling of agricultural water systems. This occurs as a result of scale<br />
formation due to precipitation of calcium carbonate.<br />
Conversely, every monitoring result exceeds the maximum ANZECC trigger value with respect to<br />
corrosion potential.<br />
C O M M E R C I A L – I N – C O N F I D E N C E<br />
DRN: QTE-007 Revision Date: 28 November 2011<br />
Document Title: MET101 Metserv Report V2 Final Page 26
In drip or pivot irrigation systems, scaling can be managed by periodic acid injection though the<br />
irrigation lines. TCT has managed irrigation systems with higher concentrations of calcium and<br />
magnesium salts than occur in the palaeochannel water with no negative effects.<br />
8.2 Langelier Saturation Index<br />
The Langellier Saturation Index (LSI) is a calculated value that provides a more detailed indication on<br />
whether water will precipitate, dissolve, or be in equilibrium with calcium carbonate than a simple<br />
hardness value. In addition to the simple concentration of Calcium and Magnesium the LSI also<br />
takes into account the modifying effects of pH conductivity, bicarbonate concentration and water<br />
temperature.<br />
In order to calculate the LSI, it was assumed that all anions balancing the reported calcium and<br />
magnesium may be attributed to bicarbonate alkalinity. The scaling/corrosion potential of water<br />
indicated by its LSI value is presented in Table 15.<br />
Table 15: LSI (Carrier) Indication of corrosion/fouling potential<br />
LSI (Carrier)<br />
Indication<br />
-2,0 < -0,5 Serious corrosion<br />
-0.5 < 0 Slightly corrosion but non-scale forming<br />
LSI = 0,0<br />
Balanced but pitting corrosion possible<br />
0.0 < 0.5 Slightly scale forming and corrosive<br />
0.5
Electrical Conductivity (EC)(µS/cm)<br />
maximum recorded value (4050 µS/cm) was also recorded from this bore. The average for all other<br />
bores is between 1000 and 1500 µS/cm (Figure 4).<br />
Figure 4: Salinity (Electrical conductivity) by bore site<br />
2500<br />
2000<br />
1500<br />
1000<br />
500<br />
0<br />
MAC3P T3-1 T3-3 T4-3s T4-4s T5-1 T5-3<br />
(GW36)(GW35)(GW74)(GW76)(GW67)(GW37)<br />
WDL<br />
T6-1<br />
(GW66)<br />
T6-2<br />
(GW34)<br />
WDL<br />
All potential irrigation options require some level of water storage. The salinity of water in storage<br />
will both increase as water is lost by evaporation, and decrease as the storage captures rainfall.<br />
Preliminary modelling indicates that on the assumption of a 6 to 8 m deep storage, average water<br />
salinity applied to irrigation will have an average salinity of 1.7 to 1.8 dS/m.<br />
Salinity of irrigation water does not have a specific trigger value per se, but requires assessment in<br />
terms the potential for salt accumulation in the rootzone as a result of irrigation exceeding the<br />
salinity tolerance of the respective crop. This requires a more detailed knowledge of soil physical<br />
and chemical profile than is available. In addition, the potential for negative impacts from irrigation<br />
salinity, are influenced by management and landscape scale characteristics. Any irrigation<br />
development would require detailed soil profile characterisation, assessment of hydrogeology and<br />
groundwater flow paths, and design and implantation of an irrigation system specific to the soil,<br />
landscape conditions, climate and crop type.<br />
Notwithstanding, the average irrigation water salinity provides an indication of the likely salinity<br />
impact from irrigation. Generally, most crops are tolerant to a soil solution EC of less than 2000<br />
µS/cm (2 dS/m). Given an average palaeochannel water salinity of 1451 µS/cm (1.45 dS/m), and<br />
supply water salinity of 1.7 to 1.8 dS/m (after net pond evaporation), TCT does not expect that with<br />
good irrigation system design and management on suitable soils (i.e., soils with an adequate depth<br />
and permeability), that rootzone salinity is likely to become an issue.<br />
C O M M E R C I A L – I N – C O N F I D E N C E<br />
DRN: QTE-007 Revision Date: 28 November 2011<br />
Document Title: MET101 Metserv Report V2 Final Page 28
8.4 Sodicity<br />
As with salinity the effects of sodicity in irrigation waters are situation-specific, and there is no<br />
specific trigger value per se. Rather, the potential effects of sodicity are the result of a complex<br />
interaction between the ionic balance of the water, its salinity, crop type, climate, rainfall, soil type<br />
and management.<br />
Sodicity, measured as the Sodium Adsorption Ratio (SAR) is an excess of sodium in the soil relative<br />
to calcium and magnesium can lead to soil structural decline. This results from a weakening of the<br />
chemical bonds between soil particles, leading to clay particles, becoming detached on wetting and<br />
clogging soil pores. As a result, the pore structure of the soil is lost, restricting the entry of both<br />
water and oxygen. Reduced soil permeability limits leaching, so that salt accumulates in the soil. A<br />
degraded soil structure also restricts root development and, consequently, has a negative impact on<br />
plant health by increasing the risk of drought stress and likelihood of nutritional deficiencies. The<br />
dispersive nature of sodic soils makes them more susceptible to erosion, particularly when wet. On<br />
drying, sodic soils typically set hard, restricting seed germination.<br />
The interaction of sodicity, sodicity and generic soil types is illustrated in Figure 5. Sodium<br />
Adsorption Ratio (SAR) values calculated from the average for each bore site are shown as blue<br />
diamonds. Values to the right of the two threshold curves are associated with stable soils. Values<br />
to the left of the curves are associated with soil structural decline. On this basis, all sodicity values<br />
are low, and irrigation with palaeochannel water is unlikely to lead to soil deterioration.<br />
Figure 5: Sodium Adsorption Ratio (SAR) by bore site<br />
Notwithstanding the low in situ SAR values, elevated levels of bicarbonate in irrigation waters can<br />
give rise to precipitation of calcium carbonate in soil. This will effectively increase the sodium<br />
adsorption ratio (SAR) and may lead to soil structural problems. The potential for this situation to<br />
C O M M E R C I A L – I N – C O N F I D E N C E<br />
DRN: QTE-007 Revision Date: 28 November 2011<br />
Document Title: MET101 Metserv Report V2 Final Page 29
arise was investigated by assuming that all calcium in the palaeochannel water is precipitated.<br />
Residual SAR values ranged between 0.3 and 1.2 (red dots in Figure 5). At these values, soil<br />
structure is expected to remain stable regardless of bicarbonate concentration. This supports the<br />
suitability of the palaeochannel water for irrigation.<br />
8.5 Ionic composition<br />
The negative impacts of salinity are generally considered in terms of the effect of sodium chloride.<br />
The major cation and anionic components of the palaeochannel water is summarised in Table 16.<br />
Table 16: Molar amounts of principal cations and anions<br />
Cations<br />
Anions<br />
Ion Ca++ Mg++ Na+ CO3-- SO4-- Clmg/l<br />
109.2 109.6 28.3 751.1 1 130.3 117.5<br />
m molec/l 5.5 9.0 2.0 8.1 2.7 2.5<br />
Sum cations/ anions 16.5 13.3<br />
1. As CaCO 3<br />
From the available data, the stoichiometry between cations and anions is significantly unbalanced,<br />
with 16.5 m molec/l of cations (calcium, magnesium and sodium). But only 5.2 molec/l of anions<br />
sulphate and chloride) being reported. It should be expected that the molar concentration of<br />
cations approximates that of anions.<br />
In order to account for this discrepancy, it has been assumed that all of the reported hardness is<br />
balanced by carbonate alkalinity. Under this assumption molar concentration of anions (carbonate,<br />
sulphate and chloride) is 13.3 m molec/l. This brings the stoichiometry between cations and anions<br />
into much closer balance, and within a reasonable range of analytical accuracy.<br />
On this basis the approximate molar ratio of salts (values adjusted to achieve ionic balance) in order<br />
of precipitation from solution is:<br />
CaCO 3<br />
MgCO 3<br />
MgSO 4<br />
NaCl<br />
~4.1 m molec/l<br />
~4.0 m molec/l<br />
~2.7 m molec/l<br />
~1.6 m molec/l<br />
Sodium chloride represents a relatively small component of the overall dissolved salts. The<br />
dominant component is comprised of calcium and magnesium salts. In solution, calcium (and to a<br />
lesser extent magnesium) has a beneficial effect on soil properties by improving soil structure and<br />
permeability. From the analysis in this Section and Section 8.4 above, even if the majority of the<br />
C O M M E R C I A L – I N – C O N F I D E N C E<br />
DRN: QTE-007 Revision Date: 28 November 2011<br />
Document Title: MET101 Metserv Report V2 Final Page 30
unidentified anion is carbonate, and all calcium carbonate precipitates out in the soil, SAR values<br />
remain low, and no detrimental soil impacts are expected.<br />
The concentration of all cations and anions (including the inferred concentration of carbonate) is<br />
illustrated in Figure 6.<br />
Figure 6: Concentration of dominant palaeochannel water ionic components<br />
8.6 Water quality summary and treatment requirements<br />
Based on the above evaluation of water quality characteristics, there are no plant or soil<br />
impediments to use of the palaeochannel water for irrigation provided the water is applied to<br />
C O M M E R C I A L – I N – C O N F I D E N C E<br />
DRN: QTE-007 Revision Date: 28 November 2011<br />
Document Title: MET101 Metserv Report V2 Final Page 31
suitable soils and managed appropriately to ensure a leaching fraction sufficient to avoid rootzone<br />
accumulation is achieved. Accordingly, there is no requirement to treat this water.<br />
The water does have a high hardness which may cause fouling of irrigation equipment by scaling.<br />
This can be managed by use of poly lined irrigation infrastructure, and periodic acid flushing of<br />
irrigation lines.<br />
9. Estimates of cost/ ha or cost/volume of water for each option<br />
9.1 Cost summary<br />
Summarised cost estimates for the first 15 years for three most viable options are presented in<br />
Table 17. All cost estimates are based on the areas required to manage min inflows in a 90 th<br />
percentile rainfall year. Note, cost per hectare estimates are irrelevant, as options that require a<br />
smaller area have a higher unit cost per hectare, even if having a lower total cost.<br />
Total cost for all three options over a 15 year period is similar, ranging for $10.8 to $13.2 million.<br />
Cost per megalitre managed is also similar, ranging from $122/Ml for forest irrigation, to $150 for<br />
contour bank plus pivot irrigation. These costs take no account of returns from grazing or trees.<br />
Net costs less returns will be substantially less.<br />
Note, all costs are estimates subject to numerous assumptions and may vary widely. Costs are<br />
intended to indicate the order of magnitude of alternative options only.<br />
Table 17: Cost summary for three viable irrigated water management options<br />
Option<br />
Total cost<br />
(15 years)<br />
Volume<br />
managed<br />
(Ml)<br />
Cost/Ml<br />
Hectares<br />
required<br />
(ha)<br />
Cost/ha<br />
(15 years)<br />
Pivot irrigated pasture $12,704,240 88,148 $144 308 $41,248<br />
Contour bank irrigated<br />
pasture plus balance of<br />
pivot irrigated pasture<br />
$13,253,440 88,148 $150 590 $22,463<br />
Forest irrigation (Drip) $10,774,347 88,148 $122 295 $36,523<br />
9.2 Piviot irrigated pastures (grass plus legumes)<br />
Key assumptions as follows:<br />
C O M M E R C I A L – I N – C O N F I D E N C E<br />
DRN: QTE-007 Revision Date: 28 November 2011<br />
Document Title: MET101 Metserv Report V2 Final Page 32
Pivot CAPEX - $5000/ha<br />
Cost of balancing storage - $2500/Ml<br />
<strong>Irrigation</strong> OPEX - $230/ha assuming electrical power (higher cost for diesel)<br />
Land preparation - $100/ha (no clearing cost)<br />
Seed - $100 -$150 per ha – planting 5 to 7 kg seed per ha<br />
Establishment fertiliser – assuming a highly concentrated mixed N, P, and K fertiliser is<br />
required at 300 kg per ha, $200 to $250 /ha<br />
Herbicides - $50/ha<br />
Electric fencing - $50/ha<br />
Pasture management costs (intensive fertilizer regime - $670/ha/yr<br />
Livestock management cost $60/ha<br />
Irrigated area – 308 ha<br />
Pond storage area – 2614 Ml (44 ha)<br />
9.3 Contour bank irrigated pastures with supplementary pivot irrigation<br />
9.3.1 Contour bank irrigation<br />
<br />
<br />
<br />
<br />
<br />
<br />
<br />
<br />
<br />
<br />
<br />
<br />
Landforming for contour banks - $2000/ha<br />
Cost of balancing storage - $2500/Ml<br />
<strong>Irrigation</strong> OPEX - $100/ha<br />
Land preparation - $100/ha (no clearing cost)<br />
Seed - $100 -$150 per ha – planting 5 to 7 kg seed per ha<br />
Establishment fertiliser – assuming a highly concentrated mixed N, P, and K fertiliser is<br />
required at 300 kg per ha, $200 to $250 /ha<br />
Herbicides - $50/ha<br />
Electric fencing - $50/ha<br />
Pasture management costs (fertilizer regime - $228/ha/yr<br />
Livestock management cost $60/ha<br />
Irrigated area – 508 ha<br />
Pond storage area – 1638 Ml (30 ha)<br />
9.3.2 Pivot irrigation<br />
<br />
<br />
<br />
<br />
<br />
<br />
<br />
<br />
Pivot CAPEX - $5000/ha<br />
Cost of balancing storage – Nil (accounted for with contour bank irrigation)<br />
<strong>Irrigation</strong> OPEX - $230/ha assuming electrical power (higher cost for diesel)<br />
<strong>Irrigation</strong> OPEX - $230/ha assuming electrical power (higher cost for diesel)<br />
Land preparation - $100/ha (no clearing cost)<br />
Seed - $100 -$150 per ha – planting 5 to 7 kg seed per ha<br />
Establishment fertiliser – assuming a highly concentrated mixed N, P, and K fertiliser is<br />
required at 300 kg per ha, $200 to $250 /ha<br />
Herbicides - $50/ha<br />
C O M M E R C I A L – I N – C O N F I D E N C E<br />
DRN: QTE-007 Revision Date: 28 November 2011<br />
Document Title: MET101 Metserv Report V2 Final Page 33
Electric fencing - $50/ha<br />
Pasture management costs (intensive fertilizer regime - $670/ha/yr<br />
Livestock management cost $60/ha<br />
Irrigated area – 90 ha<br />
9.4 Forest irrigation species<br />
<br />
<br />
<br />
<br />
<br />
<br />
<br />
Drip system CAPEX - $6600/ha<br />
Cost of balancing storage – $2500/Ml<br />
Forest establishment cost 0- $4100/ha<br />
Forest management cost year 2 - $1500/ha<br />
Ongoing management costs - $123/ha<br />
Irrigated area – 295 ha<br />
Pond storage area – 2275 Ml (38 ha)<br />
C O M M E R C I A L – I N – C O N F I D E N C E<br />
DRN: QTE-007 Revision Date: 28 November 2011<br />
Document Title: MET101 Metserv Report V2 Final Page 34
Table 18: Detailed cost schedule – pivot irrigation of pastures, area and storage for 90 th rainfall<br />
Project year Cost type Unit cost Units Quantity 1 2 3 4 5 6 7 8 9 10 11 12 13 14 15<br />
Year 2012 2013 2014 2015 2016 2017 2018 2019 2020 2021 2022 2023 2024 2025 2026<br />
1. Pasture <strong>Irrigation</strong> (Pivots)<br />
Storage volume CAPEX 2500 $/Ml 2614 6,535,000<br />
Install agricultural irrigation CAPEX 5000 $/ha 308 1,540,000<br />
<strong>Irrigation</strong> management costs OPEX 230 $/ha/yr 308 70,840 70,840 70,840 70,840 70,840 70,840 70,840 70,840 70,840 70,840 70,840 70,840 70,840 70,840 70,840<br />
Establish improved pastures CAPEX $550 $/ha 308 169,400<br />
Electric fencing CAPEX $50 $/ha 308 15,400<br />
Pasture management costs OPEX $672 $/ha/yr 308 206,976 206,976 206,976 206,976 206,976 206,976 206,976 206,976 206,976 206,976 206,976 206,976 206,976 206,976 206,976<br />
Livestock management costs OPEX $60 $/ha/yr 308 18,480 18,480 18,480 18,480 18,480 18,480 18,480 18,480 18,480 18,480 18,480 18,480 18,480 18,480 18,480<br />
Sub-total costs 8,556,096 296,296 296,296 296,296 296,296 296,296 296,296 296,296 296,296 296,296 296,296 296,296 296,296 296,296 296,296<br />
C O M M E R C I A L – I N – C O N F I D E N C E<br />
DRN: QTE-007 Revision Date: 28 November 2011<br />
Document Title: MET101 Metserv Report V2 Final Page 35
Table 19: Detailed cost schedule – Contour plus pivot irrigated pastures, area and storage for 90 th rainfall<br />
Project year Cost type Unit cost Units Quantity 1 2 3 4 5 6 7 8 9 10 11 12 13 14 15<br />
Year 2012 2013 2014 2015 2016 2017 2018 2019 2020 2021 2022 2023 2024 2025 2026<br />
2. Countour bank pastures<br />
Storage volume CAPEX 2500 $/Ml 1638 4,095,000<br />
Landforming CAPEX 2000 $/ha 500 1,000,000<br />
<strong>Irrigation</strong> management costs OPEX 100 $/ha/yr 500 50,000 50,000 50,000 50,000 50,000 50,000 50,000 50,000 50,000 50,000 50,000 50,000 50,000 50,000 50,000<br />
Establish pastures CAPEX $550 $/ha 500 275,000<br />
Electric fencing CAPEX 50 $/ha 500 25,000<br />
Pasture management costs OPEX $228 $/ha/yr 500 114,000 114,000 114,000 114,000 114,000 114,000 114,000 114,000 114,000 114,000 114,000 114,000 114,000 114,000 114,000<br />
Livestock management costs OPEX $60 $/ha/yr 500 30,000 30,000 30,000 30,000 30,000 30,000 30,000 30,000 30,000 30,000 30,000 30,000 30,000 30,000 30,000<br />
Sub-total costs 5,589,000 194,000 194,000 194,000 194,000 194,000 194,000 194,000 194,000 194,000 194,000 194,000 194,000 194,000 194,000<br />
2. Pasture <strong>Irrigation</strong> (Pivots)<br />
Storage volume CAPEX 2500 $/Ml 0 0<br />
Install agricultural irrigation CAPEX 5000 $/ha 90 450,000<br />
<strong>Irrigation</strong> management costs OPEX 230 $/ha/yr 90 70,840 70,840 70,840 70,840 70,840 70,840 70,840 70,840 70,840 70,840 70,840 70,840 70,840 70,840 70,840<br />
Establish improved pastures CAPEX $550 $/ha 90 49,500<br />
Electric fencing CAPEX $50 $/ha 90 4,500<br />
Pasture management costs OPEX $672 $/ha/yr 90 206,976 206,976 206,976 206,976 206,976 206,976 206,976 206,976 206,976 206,976 206,976 206,976 206,976 206,976 206,976<br />
Livestock management costs OPEX $60 $/ha/yr 90 18,480 18,480 18,480 18,480 18,480 18,480 18,480 18,480 18,480 18,480 18,480 18,480 18,480 18,480 18,480<br />
Sub-total costs 800,296 296,296 296,296 296,296 296,296 296,296 296,296 296,296 296,296 296,296 296,296 296,296 296,296 296,296 296,296<br />
Total Contours Plus pasture 6,389,296 490,296 490,296 490,296 490,296 490,296 490,296 490,296 490,296 490,296 490,296 490,296 490,296 490,296 490,296<br />
C O M M E R C I A L – I N – C O N F I D E N C E<br />
DRN: QTE-007 Revision Date: 28 November 2011<br />
Document Title: MET101 Metserv Report V2 Final Page 36
Table 20: Detailed cost schedule – Forest irrigation, area and storage for 90 th rainfall<br />
Project year Cost type Unit cost Units Quantity 1 2 3 4 5 6 7 8 9 10 11 12 13 14 15<br />
Year 2012 2013 2014 2015 2016 2017 2018 2019 2020 2021 2022 2023 2024 2025 2026<br />
3. Forest <strong>Irrigation</strong><br />
Storage volume CAPEX 2500 $/Ml 2275 5,687,500<br />
Install forest irrigation CAPEX $6,600 $/ha 295 1,947,000<br />
<strong>Irrigation</strong> operational costs OPEX $230 $/ha 295 67,850 67,850 67,850 67,850 67,850 67,850 67,850 67,850 67,850 67,850 67,850 67,850 67,850 67,850 67,850<br />
Forest plantation establishment CAPEX $4,100 $/ha 295 1,209,500<br />
Forest management costs Yr 2 CAPEX $1,500 $/ha 295 442,500<br />
Ongoing management costs OPEX $123 $/ha/yr 295 36,161 36,161 36,161 36,161 36,161 36,161 36,161 36,161 36,161 36,161 36,161 36,161 36,161<br />
Sub-total costs 8,911,850 510,350 104,011 104,011 104,011 104,011 104,011 104,011 104,011 104,011 104,011 104,011 104,011 104,011 104,011<br />
C O M M E R C I A L – I N – C O N F I D E N C E<br />
DRN: QTE-007 Revision Date: 28 November 2011<br />
Document Title: MET101 Metserv Report V2 Final Page 37
10. A preferred conceptual option<br />
TCT recommends a hierarchy of three irrigation management options:<br />
1. Pivot irrigation of pasture grasses on red and yellow earths and red dermosol soils, with<br />
balancing storage for low water use months (nil discharge).<br />
2. Contour bank irrigation of water logging tolerant pasture grasses on black soils with<br />
supplementary pivot irrigation of red and yellow soils to utilise excess storage volume (nil<br />
discharge).<br />
3. Drip irrigation of forest species (Khaya senegalensis) on red and yellow earths and red<br />
dermosols soils, with balancing storage for low water use months (nil discharge).<br />
Characteristics of these three options are summarised below:<br />
Option<br />
No<br />
Crop Option<br />
Total cost<br />
(15 years)<br />
Cost/ Ml<br />
Hectares<br />
required<br />
(ha)<br />
Required<br />
storage<br />
volume (Ml)<br />
1 Pivot irrigated<br />
pasture<br />
2 Contour bank<br />
irrigated pasture<br />
plus balance of pivot<br />
irrigated pasture<br />
3 Forest irrigation<br />
(Drip)<br />
$12,704,240 $144 308 2614<br />
$13,253,440 $150 590 1638<br />
$10,774,347 $122 295 2275<br />
10.1 Option 1 – Pivot irrigated pastures<br />
This option is recommended as the preferred option due to the following reasons:<br />
<br />
<br />
<br />
<br />
<br />
It involves a conventional approach to irrigation management;<br />
It is targeted to the red and yellow better drained soils expected to have a higher reliability<br />
of access than the black soil areas;<br />
It compliments and enhances the productivity of the existing grazing enterprise, offering<br />
the potential to increase herd size and reduce the impacts of seasonal variability;<br />
Cost per hectare is mid-range, but will be lower than forestry in the short term when<br />
returns from grazing are taken into account; and<br />
This option is most complimentary to the existing enterprise, and offers the lowest risk.<br />
C O M M E R C I A L – I N – C O N F I D E N C E<br />
DRN: QTE-007 Revision Date: 28 November 2011<br />
Document Title: MET101 Metserv Report V2 Final Page 38
Potential issues with this option include:<br />
<br />
<br />
<br />
Wheel tracking may be a major constraint on the operability of pivots and could<br />
result in the need for more operational supervision and land maintenance;<br />
Pigs may accentuate the wheel tracking problem as they tend to follow wheel lines<br />
and create wallows as the water recedes; and<br />
I guess if the system is never run in conditions that favour wheel rutting or bogging,<br />
the proposal might get around this component as I can see there are no alternate<br />
methods of irrigating pastures on a large scale in this region.<br />
The potential for wheel tracking may be reduced by:<br />
<br />
<br />
<br />
<br />
<br />
Constructing elevated wheel tracks;<br />
Managing pigs;<br />
Not running in in conditions that favour wheel rutting or bogging (i.e., operate in<br />
drained soil conditions only);<br />
Use tracked pivots rather than wheeled pivots (this will add another $500/ha); and<br />
Ensure pivot irrigation areas are not subject to periodic flooding.<br />
10.2 Option 2 – Contour bank irrigated pastures<br />
This option has merit by providing a reliable offtake for irrigation water throughout the year,<br />
however it has a number of limitations:<br />
<br />
<br />
<br />
<br />
<br />
<br />
It involves an unconventional approach to irrigation management;<br />
Access to black vertosol soil areas may be restricted for many months of the year, making<br />
cattle management difficult;<br />
Temporarily flooded areas may attract wild pigs and crocodiles;<br />
Potential cattle damage to contour banks is undefined;<br />
The capacity to ensure no flow-on to contour bank irrigated areas is undefined; and<br />
The extent of suitable land with very low gradients is undefined.<br />
Notwithstanding, the positives of this option include:<br />
<br />
<br />
<br />
<br />
Robust capacity to manage water provided excess is diverted to storage;<br />
Potential attraction to wildlife, especially birds;<br />
Potentially high productivity from high water availability; and<br />
Combines irrigation of both black and reds soils, providing a diversity of irrigation areas.<br />
10.3 Option 3 – Forest irrigation<br />
Trees could provide high water use capacity, but are recommended only as a lower priority for the<br />
following reasons:<br />
<br />
<br />
Establishment of trees would create a stranded resource;<br />
Availability of skills and experienced contractors in the region is limited;<br />
C O M M E R C I A L – I N – C O N F I D E N C E<br />
DRN: QTE-007 Revision Date: 28 November 2011<br />
Document Title: MET101 Metserv Report V2 Final Page 39
Pasture improvement offers greater benefits to improving the reliability and productivity of<br />
the existing grazing enterprise; and<br />
Drip irrigation requires extensive maintenance.<br />
The positives of this option include:<br />
<br />
<br />
<br />
<br />
Potential high, water use from trees;<br />
There is growing interest in Khaya plantations in the top;<br />
Forest irrigation is a proven and reliable option with a high capacity to use water; and<br />
The marginal cost may be reduced by increasing forest area and reducing storage volume,<br />
improving the buffer in irrigation volumes and system reliability.<br />
11. References<br />
ANZECC (Australian and New Zealand Environment and Conservation Council) (2000). Australian<br />
and New Zealand guidelines for fresh and marine water quality. ANZECC, Canberra.<br />
DNR (Department of Natural Resources, Queensland) (1997). Salinity Management Handbook.<br />
Scientific Publishing, Resource Sciences Centre #222.<br />
Myers, B, J., Bond, W. J., Benyon, R. G., Falkiner, R. A., Polglase, P. J., Smith, C. J., Snow, V. O. and<br />
Theiveyanathan, S. (1999) Sustainable Effluent-Irrigated Plantations” An Australian Guideline.<br />
CSIRO Forestry and Forest Products, Canberra, 293pp.<br />
“Tropical Forages” or “soFT”. Produced by CSIRO, DPI&F, CIAT, ILRI and centre for Biological<br />
Information Technology, UQ, produced in 2007, code ISBN O 643 09231 5. Contact Stuart<br />
Brown, CSIRO, 306 Carmody Road, St Lucia Aust 4067<br />
C O M M E R C I A L – I N – C O N F I D E N C E<br />
DRN: QTE-007 Revision Date: 28 November 2011<br />
Document Title: MET101 Metserv Report V2 Final Page 40
Water use options<br />
<strong>McArthur</strong> <strong>River</strong> Mine<br />
Supplementary Report<br />
Prepared for MET Serv<br />
January 2012<br />
FORESTRY | CROPPING | REHABILITATION | RENEWABLES | CARBON | WATER MANAGEMENT | MINING SERVICES
Tree Crop Technologies Pty Ltd<br />
Location Address Phone<br />
Brisbane, Qld Level 14, 97 Creek Street, Brisbane Qld 4000 +61 (0)7 3221 1102<br />
Toowoomba, Qld C/- University of Southern Qld, West Street, Toowoomba Qld 4350 +61 (0)7 4631 5320<br />
Sydney, NSW Suite 2.1, 64 Talavera Rd, North Ryde NSW 2113 +61 (0)2 9887 3980<br />
Perth, WA 12/25 Walters Drive, Osborne Park WA 6017 +61 (0)8 9244 2355<br />
info@treecroptech.com.au www.csgwatermanagement.com.au www.treecroptech.com.au<br />
Disclaimer<br />
This confidential report is issued by Tree Crop Technologies Pty Ltd (TCT) for its client’s use only and is not to<br />
be resupplied to any other person without the prior written consent of TCT. Use by, or reliance upon this<br />
document by any other person is not authorised by TCT and without limitation to any disclaimers provided,<br />
TCT is not liable for any loss arising from such unauthorised use or reliance. The report contains TCT’s opinion<br />
and nothing in the report is, or should be relied upon as, a promise or warranty by TCT that outcomes will be<br />
as stated. Future events and circumstances can be significantly different to those assumed in this report. TCT<br />
provides this report on the condition that, subject to any statutory limitation on its ability to do so, TCT<br />
disclaims liability under any cause of action including negligence for any loss arising from reliance upon this<br />
report.<br />
Confidentiality Statement<br />
© Tree Crop Technologies Pty Ltd.<br />
The contents of this report may represent proprietary, confidential information pertaining to Tree Crop<br />
Technologies Pty Ltd (TCT) intellectual property, products and professional service methods and is to be used<br />
solely for its intended purpose. By accepting this document, the recipient hereby agrees that the information in<br />
this document shall not be disclosed to any third party and shall not be duplicated, used, or disclosed for any<br />
purpose other than for its intended purpose.<br />
Dr Glenn Dale<br />
Managing Director and Chief Technical Officer<br />
11 January 2012<br />
C O M M E R C I A L – I N – C O N F I D E N C E<br />
DRN: QTE-007 Revision Date: 10 January 2012<br />
Document Title: MET101 Metserv Report V3.1 Supplementary<br />
Page ii
Revision history<br />
Revision Author/Reviewer Date Remarks 1<br />
0.1 Glenn Dale 09/1/2012 Working draft<br />
1.0 Glenn Dale 11/1/2012 Final Copy<br />
1. Working draft; Draft for approval; Approved for release; Final copy;<br />
Distribution list<br />
Date Revision Name Title<br />
11/1/2012 1.0 Brett Harwood Principal Consultant - Environment<br />
11/1/2012 1.0 Drew Herbert Project Manager – MRM Phase 3 Dev. Study<br />
C O M M E R C I A L – I N – C O N F I D E N C E<br />
DRN: QTE-007 Revision Date: 10 January 2012<br />
Document Title: MET101 Metserv Report V3.1 Supplementary<br />
Page iii
Table of contents<br />
TABLE OF CONTENTS ....................................................................................................................................... IV<br />
LIST OF TABLES ................................................................................................................................................ IV<br />
LIST OF FIGURES ............................................................................................................................................... V<br />
GLOSSARY ....................................................................................................................................................... VI<br />
EXECUTIVE SUMMARY ................................................................................................................................... VII<br />
1. INTRODUCTION ........................................................................................................................................ 9<br />
1.1 EIS .......................................................................................................................................................... 9<br />
1.2 WATER QUANTITY AND MINE WATER USE OPTIONS ............................................................................................ 9<br />
1.3 TERMS OF REFERENCE .................................................................................................................................. 9<br />
2. PREFERRED IRRIGATION REUSE OPTION .................................................................................................. 9<br />
3. IRRIGATION WATER SUPPLY .................................................................................................................. 10<br />
4. ESTIMATION OF WATER DEMAND ......................................................................................................... 13<br />
4.1 CLIMATIC, CROP FACTOR AND WATER YIELD ASSUMPTIONS ................................................................................ 14<br />
4.2 IRRIGATED PASTURES ................................................................................................................................. 15<br />
5. WATER QUALITY AND CONCEPTUAL WATER TREATMENT OPTIONS ...................................................... 16<br />
6. ESTIMATES OF COST/ HA OR COST/VOLUME OF WATER FOR EACH OPTION .......................................... 17<br />
6.1 ASSUMPTIONS ......................................................................................................................................... 17<br />
6.2 COST SUMMARY ....................................................................................................................................... 17<br />
7. FURTHER FEASIBILITY DEVELOPMENT STEPS AND COST ......................................................................... 20<br />
8. REFERENCES ........................................................................................................................................... 22<br />
List of Tables<br />
TABLE 1: VARIATION IN IRRIGATION SUPPLY WITHIN AND BETWEEN SCENARIOS (2015-2036) ................................................. 12<br />
TABLE 2: PROJECTED IRRIGATION WATER SUPPLY, 2024, 90 TH PERCENTILE SCENARIO ............................................................. 13<br />
TABLE 3: CLIMATIC, PLANT WATER USE AND WATER INFLOW ASSUMPTIONS .......................................................................... 14<br />
TABLE 4: PER HECTARE WATER BALANCE PARAMETERS – PASTURE IRRIGATION – 90 TH PERCENTILE RAINFALL YEAR ........................ 15<br />
TABLE 5: PASTURE IRRIGATION DESIGN PARAMETERS – 90 TH PERCENTILE RAINFALL YEARS ........................................................ 16<br />
TABLE 6: COST SUMMARY FOR PIVOT IRRIGATED PASTURE ................................................................................................. 18<br />
TABLE 7: DETAILED COST SCHEDULE – PIVOT IRRIGATION OF PASTURES, AREA AND STORAGE FOR 90 TH RAINFALL .......................... 19<br />
C O M M E R C I A L – I N – C O N F I D E N C E<br />
DRN: QTE-007 Revision Date: 10 January 2012<br />
Document Title: MET101 Metserv Report V3.1 Supplementary<br />
Page iv
List of Figures<br />
FIGURE 1: PROJECTED PIT INFLOW RATES (WRM WATER & ENVIRONMENT PTY LTD) ............................................................ 10<br />
FIGURE 2: TOTAL ANNUAL IRRIGATION SUPPLY, 90 TH PERCENTILE SCENARIO .......................................................................... 11<br />
FIGURE 3: VARIATION IN MONTHLY IRRIGATION WATER SUPPLY FOR SELECT YEARS ................................................................. 12<br />
C O M M E R C I A L – I N – C O N F I D E N C E<br />
DRN: QTE-007 Revision Date: 10 January 2012<br />
Document Title: MET101 Metserv Report V3.1 Supplementary<br />
Page v
Glossary<br />
ANZECC<br />
Ca<br />
dS/m<br />
ECe<br />
ET<br />
ha<br />
K<br />
Kp<br />
l<br />
LSI<br />
meq<br />
mg<br />
Mg<br />
Ml<br />
mm<br />
m molec<br />
Na<br />
SAR<br />
µS/cm<br />
Australian and New Zealand Environment and Conservation Council<br />
Calcium<br />
Deci-siemens per metre<br />
Electrical conductivity of a saturated solution extract<br />
Evapotranspiration<br />
Hectare<br />
Potassium<br />
Pan coefficient<br />
Litre<br />
Langellier Saturation Index<br />
Milliequivalents<br />
Milligram<br />
Magnesium<br />
Megalitre<br />
millimetres<br />
Millimoles charge units<br />
Sodium<br />
Sodium adsorption ratio<br />
Micro-siemens per centimetre<br />
C O M M E R C I A L – I N – C O N F I D E N C E<br />
DRN: QTE-007 Revision Date: 10 January 2012<br />
Document Title: MET101 Metserv Report V3.1 Supplementary<br />
Page vi
Executive Summary<br />
Background<br />
TCT has previously carried out a concept level investigation to establish the potential suitability for<br />
beneficial use of <strong>McArthur</strong> <strong>River</strong> mine inflow waters by irrigation of a range of tree and crop types.<br />
This investigation identified pivot irrigation of pastures as the preferred option.<br />
WRF have subsequently revised mine water inflow estimates and water management options,<br />
resulting in a significantly altered estimate of the pattern and volume of water proposed for<br />
diversion to irrigation. This report re-evaluates the physical and cost parameters associated with<br />
these revised water production estimates.<br />
As previously noted, investigations at this stage are based on limited available data. More detailed<br />
site investigation will be required, particularly for soil and landscape characteristics, in order to<br />
establish the suitability of specific on-ground sites and to inform irrigation system design.<br />
Water supply<br />
<br />
<br />
<br />
<br />
Projected water supply varies significantly in terms of both pattern and volume within and<br />
between years for each projected scenario.<br />
As diversion of water to irrigation is structured as the option of last resort, it has been assumed<br />
that irrigation capacity must be designed to cope with the maximum water yields.<br />
On the basis of the above, the irrigation water supply for the year 2024 (90 th percentile, wet<br />
year) has been used as the basis for irrigation system design.<br />
Design water supply to irrigation is 2,272 Ml/yr. Average daily water supply is 6.2 Ml/day,<br />
varying between 0 and 18 Ml/day.<br />
Water demand<br />
<br />
<br />
<br />
<br />
<br />
Potential annual plant water use demand for pastures is 2,396 mm/yr, but practical limitations<br />
of wet season operation and access limit this to 1,614 mm/yr.<br />
Daily plant water use demand for pastures and trees ranges from 5.1 to 8.8 mm/day<br />
(6.6 mm/day average).<br />
Potential irrigation loading after allowing for practical limitations, irrigation system efficiency,<br />
rainfall interception losses and minimum required leaching fraction is 1,796 mm/ha/yr<br />
(17.96 Ml).<br />
Based on the maximum projected annual water supply (2,272 Ml/yr), minimum required pasture<br />
irrigation area is 125 ha.<br />
Minimum required pond storage volume is 652 Ml. Pond area assuming an average depth of<br />
6 m is 10.9 ha.<br />
C O M M E R C I A L – I N – C O N F I D E N C E<br />
DRN: QTE-007 Revision Date: 10 January 2012<br />
Document Title: MET101 Metserv Report V3.1 Supplementary<br />
Page vii
Water quality and treatment<br />
<br />
<br />
Water quality for irrigation was reviewed in the prior TCT report. In that report, it was noted<br />
that available water analyses were inadequate to account for all major ionic components in<br />
solution.<br />
It is highly recommended that a complete water analysis be carried out. This would include all<br />
major anions, cations, pH and conductivity but would also include the total alkalinity (presently<br />
lacking). The pH can then be used to calculate the forms of alkalinity (carbonate, bicarbonate,<br />
hydroxide, etc).<br />
Cost estimates<br />
Cost and returns are estimated as follows<br />
Expense/Return Cost/return ($)<br />
Delivery pump station (18 Ml/day capacity) and mainline (5 km) CAPEX $4,934,950<br />
Distribution system OPEX<br />
$22,703/yr<br />
Storage pond (652 Ml, 10.9 ha) $2,608,000<br />
<strong>Irrigation</strong> system CAPEX $843,750<br />
<strong>Irrigation</strong> system OPEX<br />
$98,500/yr<br />
Site clearing and pasture establishment (125 ha) $137,500<br />
Annual pasture and livestock management costs<br />
$91,500/yr<br />
Annual livestock returns<br />
$145,250/yr<br />
Further investigations<br />
Potentially suitable soil types (particularly soils described as deep earthy sands, medium to deep<br />
yellow massive earths, and medium to deep red massive or structured earths) occur on the tenement<br />
area and surrounding grazing property. A detailed on-site feasibility study will be required to<br />
positively establish the suitability of these soils and the site for irrigation development. It is<br />
recommended that this work be carried out in staged approach as follows:<br />
1 Site soil survey and impact assessment modelling<br />
2 Desktop water resource review and impact analysis<br />
3 Site hydrogeological assessment (if required)<br />
4 Full feasibility study report and beneficial use plan preparation<br />
C O M M E R C I A L – I N – C O N F I D E N C E<br />
DRN: QTE-007 Revision Date: 10 January 2012<br />
Document Title: MET101 Metserv Report V3.1 Supplementary<br />
Page viii
1. Introduction<br />
1.1 EIS<br />
<strong>McArthur</strong> <strong>River</strong> Mine is a zinc, lead and silver open-cut mine located approximately 60 kilometres<br />
(km) south of Borroloola in the Northern Territory. <strong>McArthur</strong> <strong>River</strong> Mine is owned by Xstrata.<br />
MET Serve is assisting <strong>McArthur</strong> <strong>River</strong> Mine in the preparation of an EIS in support of a proposed<br />
mine expansion.<br />
1.2 Water quantity and mine water use options<br />
The mine expansion is expected to generate water at rates the order of around 16 Ml per day. TCT’s<br />
initial report presented conceptual irrigation scenarios and associated costs based on this level of<br />
water production. Based on this report, MRM have advised that irrigated perennial pasture on well<br />
drained soils is the preferred option for off-site irrigation use.<br />
Further consideration by MRM of overall water management options has determined that the<br />
preferred strategy is to maximise on-site management of water and river discharge, with off-site<br />
irrigation taking any residual surplus volume. In summary, diversion of water to irrigation is to be<br />
the option of last resort. This changes the irrigation water supply volume to irrigation significantly<br />
from the estimates presented in TCT’s original report.<br />
1.3 Terms of reference<br />
MRM and Met Serve have requested TCT to provide:<br />
<br />
<br />
<br />
Revised water demand and irrigation area estimates for the preferred option of perennial<br />
pasture irrigation on well drained soils based on a significantly revised water yield scenario;<br />
Revised estimates of cost/ha or cost/volume of water for the perennial pasture option; and<br />
Outline of requirements and costs to progress site based project feasibility investigation.<br />
2. Preferred irrigation reuse option<br />
Per TCT’s initial report, the preferred irrigation management option is pivot irrigation of perennial<br />
pasture species on well drained red and yellow earths and re dermosols.<br />
It is most desirable to combine grasses with legumes so that the latter can provide at least some of<br />
the nitrogen requirements for the companion grasses. All species given below are suited to mixed<br />
grass legume situations. Potential species include:<br />
C O M M E R C I A L – I N – C O N F I D E N C E<br />
DRN: QTE-007 Revision Date: 10 January 2012<br />
Document Title: MET101 Metserv Report V3.1 Supplementary Page 9
Inflow Rate (ML/day)<br />
Grass species<br />
1) Rhodes grass (Chloris gayana cv Callide & Fine cut);<br />
2) Kazungula setaria (Setaria sphacelata (anceps) cv kazungula);<br />
3) Bisset creeping blue grass (Bothriochloa insculpta cv Bisset); and<br />
4) Tully humidicola – (Brachiara humidicola cv Tully).<br />
Legumes<br />
1) Glenn and Lee joint vetch;<br />
2) Centrosema marcrocarpum (brasilianum); and<br />
3) Vigna luteola.<br />
Note: This option is substantially restricted to irrigation during the dry season.<br />
3. <strong>Irrigation</strong> water supply<br />
The originally provided water inflow data projected a gradual build-up in water inflows, with regular<br />
seasonal fluctuations reaching a relatively constant annual average of 16.1 Ml/day (annual range<br />
from 112 to 22 Ml/day) from project year 11 (2022) onwards (Figure 1).<br />
Figure 1: Projected pit inflow rates (WRM Water & Environment Pty Ltd)<br />
25<br />
Draft<br />
MRMP7 - Pit Inflow Rate all parameters as for MRMP5<br />
except Dolomite (K = 0.1 to 0.5 m/day) from Kaft…<br />
Modified…<br />
20<br />
15<br />
10<br />
5<br />
0<br />
0 1 2 3 4 5 6 7 8 9 10 11 12 13 14 15 16 17 18 19 20 21 22 23 24 25 26<br />
Years<br />
C O M M E R C I A L – I N – C O N F I D E N C E<br />
DRN: QTE-007 Revision Date: 10 January 2012<br />
Document Title: MET101 Metserv Report V3.1 Supplementary Page 10
Annual irrigation supply (Ml/year)<br />
2011<br />
2013<br />
2015<br />
2017<br />
2019<br />
2021<br />
2023<br />
2025<br />
2027<br />
2029<br />
2031<br />
2033<br />
2035<br />
2037<br />
The revised irrigation water supply volumes provided by WRM are significantly more variable.<br />
Three scenarios have been provided for the period from 2011 to 2037:<br />
<br />
<br />
<br />
10 th percentile (dry simulation);<br />
50 th percentile (median simulation); and<br />
90 th percentile (wet simulation).<br />
Within each scenario, the annual pattern and volume of irrigation supply varies considerably. For<br />
the 90 th percentile scenario, the variation in total annual irrigation supply varies from a minimum of<br />
260 Ml/year in 2019, to a maximum of 2,270 Ml/year in 2024 (illustrated in Figure 2).<br />
Figure 2: Total annual irrigation supply, 90 th percentile scenario<br />
2500<br />
2000<br />
1500<br />
1000<br />
500<br />
0<br />
The variation between years within scenarios (for the period from 2015 to 2036), and between<br />
scenarios is further illustrated in<br />
C O M M E R C I A L – I N – C O N F I D E N C E<br />
DRN: QTE-007 Revision Date: 10 January 2012<br />
Document Title: MET101 Metserv Report V3.1 Supplementary Page 11
Table 1. This variation is up to 9 fold for the 90 th percentile scenario.<br />
C O M M E R C I A L – I N – C O N F I D E N C E<br />
DRN: QTE-007 Revision Date: 10 January 2012<br />
Document Title: MET101 Metserv Report V3.1 Supplementary Page 12
Monthly water supply (ml/month)<br />
Table 1: Variation in irrigation supply within and between scenarios (2015-2036)<br />
Scenario<br />
Minimum<br />
Average<br />
Maximum<br />
Ml/yr (Ml/day)<br />
Ml/yr (Ml/day)<br />
Ml/yr (Ml/day)<br />
10 th percentile (dry year) 184 (0.5) 995 (2.7) 2,064 (5.7)<br />
50 th percentile (Median) 384 (1.4) 1,113 (3.1) 2,100 (5.8)<br />
90 th percentile (wet year) 260 (0.7) 1,129 (3.2) 2,272 (6.2)<br />
Variation between the pattern of water supply within a year is also significant. The pattern of<br />
monthly water supply for a selection of years, and for the average across all years, is illustrated in<br />
Figure 3.<br />
Figure 3: Variation in monthly irrigation water supply for select years<br />
400<br />
350<br />
300<br />
250<br />
200<br />
150<br />
100<br />
50<br />
2014<br />
2019<br />
2024<br />
2029<br />
2034<br />
Average<br />
0<br />
Jan Feb Mar Apr May Jun<br />
Jul Aug Sep Oct Nov Dec<br />
The wide variation in the projected irrigation water supply between years within a scenario, and<br />
between scenarios presents a challenge for design of an efficient irrigation system. As the irrigation<br />
system is intended to take excess flows, it is assumed that it effectively provides the backstop<br />
required to ensure licence conditions are met. On this basis, the irrigation system should be<br />
designed to handle the maximum volume of water delivered in a wet year. For this purpose, the<br />
irrigation supply projection for 2024 (2,272 Ml/year, average of 6.2 Ml/day) has been chosen for<br />
further simulation. Water supply data for this year are presented in Table 2.<br />
C O M M E R C I A L – I N – C O N F I D E N C E<br />
DRN: QTE-007 Revision Date: 10 January 2012<br />
Document Title: MET101 Metserv Report V3.1 Supplementary Page 13
Table 2: Projected irrigation water supply, 2024, 90 th percentile scenario<br />
Month<br />
Monthly water supply<br />
(Ml/month)<br />
Average daily water supply<br />
(Ml/day)<br />
Jan 142 4.6<br />
Feb 106 3.8<br />
Mar 154 5.0<br />
Apr 0 0.0<br />
May 66 2.1<br />
Jun 274 9.1<br />
Jul 272 8.8<br />
Aug 268 8.6<br />
Sep 268 8.9<br />
Oct 288 9.3<br />
Nov 282 9.4<br />
Dec 152 4.9<br />
Annual 2272 (Total) 6.2 (average)<br />
4. Estimation of water demand<br />
Assumptions regarding monthly variation in rainfall, evaporation, plant water use demand and<br />
water yield are summarised in<br />
Table 3. These assumptions are as per the prior report.<br />
C O M M E R C I A L – I N – C O N F I D E N C E<br />
DRN: QTE-007 Revision Date: 10 January 2012<br />
Document Title: MET101 Metserv Report V3.1 Supplementary Page 14
4.1 Climatic, crop factor and water yield assumptions<br />
Table 3: Climatic, plant water use and water inflow assumptions<br />
Month Jan Feb Mar Apr May Jun Jul Aug Sep Oct Nov Dec Annual<br />
Average (50 th percentile)<br />
rainfall (mm)<br />
208.4 186.7 143.7 33.7 7.3 1.7 2.4 0.4 4.9 21.2 49.1 122.1 784.2<br />
90 th percentile rainfall (mm) 415 368 291.4 79.2 16.4 4 1.2 0.2 11.9 56.5 133.5 207.1 1,202.4<br />
Mean daily evaporation (mm) 7.4 6.7 6.7 6.8 6.4 5.8 5.9 7.2 8.9 9.7 9.9 8.9 7.5(av)<br />
Mean monthly evap (mm) 229.4 187.6 207.7 204 198.4 174 182.9 223.2 267 300.7 297 275.9 2747.8<br />
Pasture pan coefficient 0.83 0.87 0.89 0.88 0.87 0.88 0.88 0.86 0.87 0.86 0.89 0.88 0.87(av)<br />
ET pasture (mm/day) 6.1 5.8 6.0 6.0 5.6 5.1 5.2 6.2 7.8 8.3 8.8 7.8 6.6(av)<br />
ET pasture (mm/month) 190 164 185 180 173 153 161 191 233 257 265 243 2,396<br />
ET past. practical (mm/month) 0 0 0 180 173 153 161 191 233 257 265 0 1,614<br />
Water inflow (Ml/day) 4.6 3.8 5.0 0.0 2.1 9.1 8.8 8.6 8.9 9.3 9.4 4.9 6.2(av)<br />
Water inflow (Ml/month) 142 106 154 0 66 274 272 268 268 288 282 152 2,272<br />
C O M M E R C I A L – I N – C O N F I D E N C E<br />
DRN: QTE-007 Revision Date: 10 January 2012<br />
Document Title: MET101 Metserv Report V3.1 Supplementary Page 15
4.2 Irrigated pastures<br />
As per previous projections, key assumptions are as follows:<br />
Irrigated pastures are suitable for the medium to well-drained, red and yellow earths and<br />
red dermosols.<br />
Centre pivot or lateral move irrigation is suitable for these soil types subject to more<br />
detailed evaluation of specific site conditions (slope, landform, adequate area).<br />
No irrigation has been assumed in the summer (wet season) months of December to March<br />
inclusive due to access problems, and practical considerations relating to operation of pivots<br />
under excessively wet conditions.<br />
Pasture crop factor is 0.9 that of trees for the same region.<br />
<strong>Irrigation</strong> loading projections are based on a 90 th percentile rainfall year (<br />
Table 3).<br />
Target leaching fraction is 12% based on preliminary calculations of leaching requirement<br />
necessary to maintain the rootzone salinity at less than 2 dS/m under an irrigation rate of<br />
2,300 mm/yr.<br />
Sprinkler irrigation efficiency is 85%.<br />
Based on these assumptions, key water balance parameters are detailed in Table 4. <strong>Irrigation</strong> of<br />
between 152 and 293 mm/ha/month during the period April to November gives an annual irrigation<br />
loading of 1,796 mm/ha/yr or 17.96 Ml/ha/year.<br />
Table 4: Per hectare water balance parameters – Pasture irrigation – 90 th percentile rainfall year<br />
Pan evaporation Pasture water <strong>Irrigation</strong> loading<br />
Month Rainfall (mm)<br />
(mm/ha) use (mm/ha) (mm/ha)<br />
Jan 415 229.4 190 0<br />
Feb 368 187.6 164 0<br />
Mar 291.4 207.7 185 0<br />
Apr 79.2 204 180 152<br />
May 16.4 198.4 173 209<br />
Jun 4 174 153 198<br />
Jul 1.2 182.9 161 211<br />
Aug 0.2 223.2 191 251<br />
Sep 11.9 267 233 293<br />
Oct 56.5 300.7 257 278<br />
Nov 133.5 297 265 204<br />
Dec 207.1 275.9 243 0<br />
Annual 1,584.4 2,748 2,396 1,796<br />
C O M M E R C I A L – I N – C O N F I D E N C E<br />
DRN: QTE-007 Revision Date: 10 January 2012<br />
Document Title: MET101 Metserv Report V3.1 Supplementary Page 16
Based on these per hectare water balance characteristics, the overall design parameters for an<br />
irrigation system designed to achieve 100% utilisation of water in a 90 th percentile rainfall year and<br />
maximum assumed mine water inflow rates, are summarised in Table 5.<br />
Under this scenario, and based on an annual irrigation water supply of 2,272 Ml/yr (average<br />
6.2 Ml/day), an irrigation area of 125 ha with dam storage of 652 Ml (10.9 ha at 6m average depth),<br />
is required.<br />
Table 5: Pasture irrigation design parameters – 90 th percentile rainfall years<br />
Water balance component<br />
90 th percentile rainfall year<br />
Total groundwater produced per year<br />
2,272 Ml/yr<br />
Minimum pasture area required<br />
125 ha<br />
Annual effluent loading rate<br />
1,796 mm/ha/yr<br />
Minimum pond storage required<br />
652 Ml<br />
Pond area (assuming average depth of 6m)<br />
10.9 ha<br />
Annual net pond loss/gain<br />
97 Ml<br />
Total excess rainfall<br />
342 mm<br />
Number of months of excess rainfall<br />
4 months<br />
<strong>Irrigation</strong> method & rotation type<br />
Sprinkler (Pivot)<br />
Leaching Fraction 12%<br />
Proportion of maximum <strong>Irrigation</strong> load applied 1.00<br />
5. Water quality and conceptual water treatment options<br />
Water quality for irrigation was reviewed in the prior TCT report. In that report, it was noted that<br />
available water analyses were inadequate to account for all major ionic components in solution.<br />
The sum of the cations is 16.5 meq and the anions 6.0 meq. The quantity of cations and anions<br />
should be close to balanced. Presently anions totalling 10.6 meq are missing from the analysis. It<br />
was postulated that missing ions comprised carbonates (approximately 650 mg/l of bicarbonate<br />
alkalinity), but this has not been verified.<br />
It is highly recommended that a complete water analysis be carried out. This would include all<br />
major anions, cations, pH and conductivity but would also include the total alkalinity (presently<br />
lacking). The pH can then be used to calculate the forms of alkalinity (carbonate, bicarbonate,<br />
hydroxide, etc).<br />
Most labs offer a standard water analysis suite. The standard stock or domestic water profiles<br />
provided by SGS laboratories should prove adequate for this purpose.<br />
C O M M E R C I A L – I N – C O N F I D E N C E<br />
DRN: QTE-007 Revision Date: 10 January 2012<br />
Document Title: MET101 Metserv Report V3.1 Supplementary Page 17
6. Estimates of cost/ ha or cost/volume of water for each option<br />
6.1 Assumptions<br />
Key cost assumptions for pivot irrigated pastures (grass plus legumes) are as follows:<br />
<br />
<br />
<br />
<br />
<br />
<br />
<br />
<br />
<br />
<br />
Main delivery pipeline - $606,990/km<br />
Delivery pump station cost (with capacity to pump 18 Ml/day) - $1.9 million<br />
Pivot CAPEX - $6,750/ha<br />
Cost of balancing storage - $4,000/Ml<br />
<strong>Irrigation</strong> OPEX - $788/ha (Assuming diesel power. Less for grid power)<br />
Land clearing cost - $500/ha<br />
Pasture establishment cost - $550/ha including:<br />
o Land preparation - $100/ha (no clearing cost)<br />
o Seed - $100 -$150 per ha – planting 5 to 7 kg seed per ha<br />
o Establishment fertiliser – assuming a highly concentrated mixed N, P, and K fertiliser<br />
is required at 300 kg per ha, $200 to $250 /ha<br />
o Herbicides - $50/ha<br />
Electric fencing - $50/ha<br />
Pasture management costs (intensive fertilizer regime) - $672/ha/yr<br />
Livestock management cost $60/ha/yr<br />
Additional key assumptions as follows:<br />
<br />
<br />
<br />
<br />
<br />
<br />
Irrigated area – 125 ha<br />
Pond storage area – 652 Ml (10.9 ha)<br />
Main delivery pipeline – 5 km<br />
Maximum daily delivery volume to storage pond – 18 Ml<br />
Average daily irrigation volume – 6.2 Ml<br />
Annual irrigation volume – 2,270 Ml<br />
6.2 Cost summary<br />
Summarised cost estimates for the first 15 years are presented in Table 6. All cost estimates are<br />
based on the area required to manage maximum projected annual irrigation supply under the 90 th<br />
percentile (wet year) scenario (i.e., for 2024).<br />
Total cost for all three options over a 15 year period is similar, ranging for $10.8 to $13.2 million.<br />
Cost per megalitre managed is also similar, ranging from $122/Ml for forest irrigation, to $150 for<br />
contour bank plus pivot irrigation. These costs take no account of returns from grazing or trees.<br />
Net costs less returns will be substantially less.<br />
C O M M E R C I A L – I N – C O N F I D E N C E<br />
DRN: QTE-007 Revision Date: 10 January 2012<br />
Document Title: MET101 Metserv Report V3.1 Supplementary Page 18
Table 6: Cost summary for pivot irrigated pasture<br />
Expense/Return Cost/return ($)<br />
Delivery pump station (18 Ml/day capacity) and mainline (5 km) CAPEX $4,934,950<br />
Distribution system OPEX<br />
$22,703/yr<br />
Storage pond (652 Ml, 10.9 ha) $2,608,000<br />
<strong>Irrigation</strong> system CAPEX $843,750<br />
<strong>Irrigation</strong> system OPEX<br />
$98,500/yr<br />
Site clearing and pasture establishment (125 ha) $137,500<br />
Annual pasture and livestock management costs<br />
Annual livestock returns<br />
$91,500/yr<br />
$145,250/yr<br />
C O M M E R C I A L – I N – C O N F I D E N C E<br />
DRN: QTE-007 Revision Date: 10 January 2012<br />
Document Title: MET101 Metserv Report V3.1 Supplementary Page 19
Table 7: Detailed cost schedule – pivot irrigation of pastures, area and storage for 90 th rainfall<br />
Project year 1 2 3 4 5 6 7 8 9 10 11 12 13 14 15<br />
Year 2012 2013 2014 2015 2016 2017 2018 2019 2020 2021 2022 2023 2024 2025 2026<br />
Delivery infrastructure<br />
Main delivery pump station 1,900,000<br />
Trunk line construction 3,034,950<br />
Storage pond construction 2,608,000<br />
Distribution system OPEX 22,703 22,703 22,703 22,703 22,703 22,703 22,703 22,703 22,703 22,703 22,703 22,703 22,703 22,703 22,703<br />
Pasture <strong>Irrigation</strong><br />
Site preparation and clean up 62,500<br />
Install agricultural irrigation 843,750<br />
<strong>Irrigation</strong> management costs 98,500 98,500 98,500 98,500 98,500 98,500 98,500 98,500 98,500 98,500 98,500 98,500 98,500 98,500 98,500<br />
Establish improved pastures 68,750<br />
Fencing 6,250<br />
Land rental 0 0 0 0 0 0 0 0 0 0 0 0 0 0 0<br />
Pasture management costs 84,000 84,000 84,000 84,000 84,000 84,000 84,000 84,000 84,000 84,000 84,000 84,000 84,000 84,000 84,000<br />
Livestock management costs 7,500 7,500 7,500 7,500 7,500 7,500 7,500 7,500 7,500 7,500 7,500 7,500 7,500 7,500 7,500<br />
Livestock returns 145,250 145,250 145,250 145,250 145,250 145,250 145,250 145,250 145,250 145,250 145,250 145,250 145,250 145,250 145,250<br />
Project Costs and Returns<br />
CAPEX 8,524,200 0 0 0 0 0 0 0 0 0 0 0 0 0 0<br />
OPEX 212,703 212,703 212,703 212,703 212,703 212,703 212,703 212,703 212,703 212,703 212,703 212,703 212,703 212,703 212,703<br />
RETURN 145,250 145,250 145,250 145,250 145,250 145,250 145,250 145,250 145,250 145,250 145,250 145,250 145,250 145,250 145,250<br />
Net cashflow -8,591,653 -67,453 -67,453 -67,453 -67,453 -67,453 -67,453 -67,453 -67,453 -67,453 -67,453 -67,453 -67,453 -67,453 -67,453<br />
DRN: QTE-007 Revision Date: 10 January 2012<br />
Document Title: MET101 Metserv Report V3.1 Supplementary Page 20<br />
C O M M E R C I A L – I N – C O N F I D E N C E
7. Further feasibility development steps and cost<br />
TCT has undertaken a high level review of Northern Territory legislation relating to the licencing of<br />
mine by-product water for irrigated use. While this review is ongoing, it is likely that diversion of<br />
mine by-product water for beneficial use via pasture irrigation will require some form of<br />
appropriate licensing, possibly under the Water Act. It is anticipated that the key consideration in<br />
any licence will be avoidance of environmental harm. It would be further anticipated that any<br />
licence for beneficial use of by-product water will require ongoing monitoring to ensure that<br />
relevant licence conditions continue to be met.<br />
Based on Queensland legislation, key issues that must be addressed in any application for beneficial<br />
use of by-product water include an assessment that:<br />
a) Application of the water to the land will not result in degradation of the quality of the soil<br />
to which it is applied, or deterioration to crop productivity (i.e., the productive capacity of<br />
the soil is preserved); and<br />
b) Application of the water to the land will not result in off-site environmental impact to land<br />
and water resources.<br />
Key topics to be addressed in a comprehensive feasibility study will include the following:<br />
General site and land resource review including:<br />
<br />
<br />
<br />
<br />
<br />
<br />
<br />
<br />
<br />
Geology<br />
Climate<br />
Rainfall and evaporation<br />
Temperature<br />
Landform and topography<br />
Vegetation<br />
Infrastructure<br />
Potential irrigation areas<br />
Current land use<br />
Detailed soil and site survey incorporating:<br />
<br />
<br />
<br />
<br />
<br />
<br />
<br />
<br />
<br />
Desktop assessment of potential investigation areas<br />
Planning of soil sampling locations<br />
Soil electromagnetic (EM) Mapping<br />
In-field pit characterisation to Australian Standards<br />
Sample collection and lab analysis to Australian Standards<br />
Soil type and soil property mapping to Australian Standards<br />
Modelling of soil behavioural characteristics under irrigation<br />
Soil management requirements<br />
Identification and mapping of potential irrigation areas<br />
C O M M E R C I A L – I N – C O N F I D E N C E<br />
DRN: QTE-007 Revision Date: 10 January 2012<br />
Document Title: MET101 Metserv Report V3.1 Supplementary Page 21
Update of by-product water characteristics (if applicable) including:<br />
<br />
<br />
Water supply volume<br />
By-product water analysis and review against Australian irrigation standards<br />
Review of proposed pasture species<br />
<br />
Review species suitability and management requirement in light of soil mapping results and<br />
irrigation water quality review<br />
Detailed analysis and modelling of irrigation impacts on soils and plant productivity including:<br />
<br />
<br />
<br />
<br />
Water balance<br />
Rootzone salinity and leaching<br />
Soil sodicity impacts<br />
Impact of treated water on soil structure<br />
Analysis of impacts of irrigation on water resources including:<br />
<br />
<br />
<br />
<br />
<br />
<br />
<br />
Review of surface water resources<br />
Review of groundwater resources<br />
Conceptual Understanding of hydrogeology<br />
Sources<br />
Pathways<br />
Receptors<br />
Assessment and evaluation of irrigation impacts on water resources<br />
Beneficial use plan<br />
<br />
<br />
<br />
<br />
<br />
<br />
Outline of proposed irrigation development plan<br />
Crop establishment and management practices<br />
<strong>Irrigation</strong> system design<br />
Monitoring and reporting plan<br />
Risk management plan<br />
Stakeholder engagement plan<br />
While the above represents a comprehensive outline of topics and issues to be addressed in a<br />
complete feasibility study, it is recommended that this be approached in a staged manner to first<br />
establish the availability of land suitable for irrigation development within an economic distance of<br />
the mine site. In this regard, it is recommended that the staged priority for undertaking the<br />
components of a feasibility study should be:<br />
1 Site soil survey and impact assessment modelling<br />
2 Desktop water resource review and impact analysis<br />
3 Site hydrogeological assessment (if required)<br />
4 Full feasibility study report and beneficial use plan preparation<br />
C O M M E R C I A L – I N – C O N F I D E N C E<br />
DRN: QTE-007 Revision Date: 10 January 2012<br />
Document Title: MET101 Metserv Report V3.1 Supplementary Page 22
8. References<br />
ANZECC (Australian and New Zealand Environment and Conservation Council) (2000). Australian<br />
and New Zealand guidelines for fresh and marine water quality. ANZECC, Canberra.<br />
DNR (Department of Natural Resources, Queensland) (1997). Salinity Management Handbook.<br />
Scientific Publishing, Resource Sciences Centre #222.<br />
Myers, B, J., Bond, W. J., Benyon, R. G., Falkiner, R. A., Polglase, P. J., Smith, C. J., Snow, V. O. and<br />
Theiveyanathan, S. (1999) Sustainable Effluent-Irrigated Plantations” An Australian Guideline.<br />
CSIRO Forestry and Forest Products, Canberra, 293pp.<br />
“Tropical Forages” or “soFT”. Produced by CSIRO, DPI&F, CIAT, ILRI and centre for Biological<br />
Information Technology, UQ, produced in 2007, code ISBN O 643 09231 5. Contact Stuart<br />
Brown, CSIRO, 306 Carmody Road, St Lucia Aust 4067<br />
C O M M E R C I A L – I N – C O N F I D E N C E<br />
DRN: QTE-007 Revision Date: 10 January 2012<br />
Document Title: MET101 Metserv Report V3.1 Supplementary Page 23