Hutchins et al. 2007 - BIoAcid
Hutchins et al. 2007 - BIoAcid
Hutchins et al. 2007 - BIoAcid

Create successful ePaper yourself
Turn your PDF publications into a flip-book with our unique Google optimized e-Paper software.
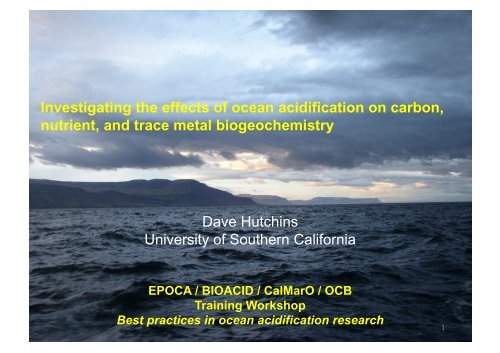
Investigating the effects of ocean acidification on carbon,<br />
nutrient, and trace m<strong>et</strong><strong>al</strong> biogeochemistry<br />
Dave <strong>Hutchins</strong><br />
University of Southern C<strong>al</strong>ifornia<br />
EPOCA / BIOACID / C<strong>al</strong>MarO / OCB<br />
Training Workshop<br />
Best practices in ocean acidification research<br />
1
Introduc)on <br />
Why should ocean acidifica)on affect marine <br />
biogeochemic<strong>al</strong> cycles? <br />
2
How will nutrient biogeochemistry <br />
change in an acidified ocean? <br />
C 106 : N 16 : Si 16 : P 1<br />
3
Phytoplankton Element<strong>al</strong> Ratios<br />
• Redfield: 106C:16N:16Si:1P<br />
• Ho <strong>et</strong> <strong>al</strong>. 2003:<br />
(C 124 N 16 P 1 S 1.3 K 1.7 Mg 0.56 Ca 0.5 ) (1000) Fe 7.5<br />
• Price 2005:<br />
C 97 :N 14 :Si: 4.7 :P 1 :Fe 0.029 (Fe-repl<strong>et</strong>e)<br />
C 70 :N 10 :Si: 5.9 :P 1 :Fe 0.00074 (Fe-limited)<br />
4
Carbon <br />
• CO 2 enrichment can poten3<strong>al</strong>ly promote the photosynthesis <br />
and growth of autotrophs such as phytoplankton and <br />
chemoautotrophic bacteria. <br />
• Responses to changing pCO 2 depend partly on the efficiency <br />
of carbon-‐concentra3ng mechanisms (CCMs), like various <br />
carbonic anhydrases. Autotrophic groups with less efficient <br />
CCMs may benefit the most from increasing pCO 2 . <br />
• For c<strong>al</strong>cifying autotrophs (coccolithophorids), it is perfectly <br />
possible for higher pCO 2 to increase photosynthe3c carbon <br />
fixa3on, while at the same 3me c<strong>al</strong>cifica3on is reduced. <br />
• For both CO 2 fixa3on and c<strong>al</strong>cifica3on, interac3ons with other <br />
glob<strong>al</strong> change variables like temperature or light can be as <br />
important (or more so) as the effects of elevated CO 2 <strong>al</strong>one. <br />
5
Effects of CO 2 and temperature increases on <br />
photosynthesis versus irradiance (PE) curves of <br />
two harmful bloom flagellates <br />
H<strong>et</strong>erosigma akashiwo<br />
Fu <strong>et</strong> <strong>al</strong>. 2008.<br />
Harmful Algae 7:<br />
doi:10.1016/j.h<strong>al</strong>.<strong>2007</strong>.05.006.<br />
Prorocentrum minimum<br />
6
Bering Sea temperature/pCO 2 matrix:<br />
Photosynthesis vs. Irradiance Curve<br />
α <br />
PB max<br />
Hare <strong>et</strong> <strong>al</strong>. <strong>2007</strong><br />
MEPS 352: 9-16<br />
7
North<br />
Atlantic<br />
Bloom<br />
CO 2 /<br />
temperature<br />
experiment:<br />
coccolithophore<br />
abundance,<br />
POC and PIC<br />
production<br />
Black: Ambient control<br />
Red: High pCO 2<br />
Green: High temp<br />
Yellow: High pCO 2<br />
and high temp<br />
Feng <strong>et</strong> <strong>al</strong>. 2009. Effects of increased pCO 2 and<br />
temperature on the North Atlantic spring bloom.<br />
I. The phytoplankton community and<br />
biogeochemic<strong>al</strong> response. MEPS 388: 13-25<br />
POC<br />
PIC<br />
PIC:POC<br />
8
Interactive<br />
effects of light,<br />
temperature<br />
and pCO 2 on<br />
c<strong>al</strong>cification<br />
by a Sargasso<br />
Sea E. hux.<br />
isolate<br />
Feng <strong>et</strong> <strong>al</strong>. 2008,<br />
European Journ<strong>al</strong> of<br />
Phycology 43: 87-98<br />
Open bars = high light (400 µEinsteins)<br />
Filled bars = low light (50 µEinsteins)<br />
The primary control on c<strong>al</strong>cification in this<br />
strain is light intensitypCO<br />
2 exerts a secondary effect, but only<br />
under saturating light conditions 9
Carbon “overconsump)on” at high pCO 2 ? <br />
C:N = 6.0 <br />
at 350 ppm <br />
C:N = 8.8 <br />
at 1050 ppm <br />
Riebesell <strong>et</strong> <strong>al</strong>. <strong>2007</strong>, Nature 450: 545-‐548 <br />
10
Carbon measurement m<strong>et</strong>hods <br />
1. Covered elsewhere in the course: <br />
– DIC drawdown <br />
– C<strong>al</strong>cifica3on and organic carbon fixa3on using 14 C <br />
2. CHN an<strong>al</strong>ysis: Simple gas chromatography m<strong>et</strong>hod to <br />
measure par3culate organic (and inorganic) carbon <br />
and nitrogen (Sharp 1974. Limnol. Oceanogr. 19: <br />
984-‐989.), or use a mass spectrom<strong>et</strong>er. <br />
3. P/E curves: Requires a photosynth<strong>et</strong>ron which <br />
produces a wide range of light levels; samples are <br />
incubated briefly with 14 C (van Hilst and Smith 2002 <br />
MEPS 226: 1-‐12; Feng <strong>et</strong> <strong>al</strong>. 2009 MEPS 388: 13–25) <br />
11
The marine nitrogen cycle<br />
+5<br />
+4<br />
NO 3<br />
-<br />
+3<br />
NO 2<br />
-<br />
Oxidation state<br />
+2<br />
+1<br />
0<br />
N 2<br />
N 2 O<br />
NO<br />
anammox<br />
-1<br />
-2<br />
-3<br />
NH 3 /<br />
NH 4<br />
+<br />
assimilation<br />
degradation<br />
Organic<br />
Nitrogen<br />
12
Nitrogen fixation<br />
+5<br />
+4<br />
NO 3<br />
-<br />
+3<br />
NO 2<br />
-<br />
Oxidation state<br />
+2<br />
+1<br />
0<br />
N 2<br />
N 2 O<br />
NO<br />
anammox<br />
-1<br />
-2<br />
-3<br />
NH 3 /<br />
NH 4<br />
+<br />
assimilation<br />
degradation<br />
Organic<br />
Nitrogen<br />
13
Nitrogen fixa)on <br />
1. Biologic<strong>al</strong> nitrogen fixation is the primary natur<strong>al</strong> source of fixed<br />
nitrogen in the ocean.<br />
2. Major groups include cyanobacteria (Trichodesmium, Crocosphaera) <strong>al</strong>ong<br />
with diatom/diazotroph and zooplankton/diazotroph symbioses, N 2 -fixing<br />
h<strong>et</strong>erotrophic eubacteria and archaea.<br />
3. Most prominent in sub-tropic<strong>al</strong> and tropic<strong>al</strong> regimes, but now being found<br />
in other marine environments as well.<br />
4. Thought to be often limited by the<br />
availability of P or Fe.<br />
<strong>Hutchins</strong> and Fu 2008. Linking the oceanic<br />
biogeochemistry of iron and phosphorus<br />
with the marine nitrogen cycle.<br />
pp. 1627-1653, Nitrogen in the Marine Environment, 2 nd edition. Elsevier Press<br />
14
Glob<strong>al</strong> estimate of new production based on N 2 fixation. DIC drawdown in<br />
NO 3 -depl<strong>et</strong>ed warm waters is equiv<strong>al</strong>ent to 0.8 ±0.3 Pg C yr -1<br />
15
Will N 2 fixa)on increase in the future high CO 2 ocean? <br />
Trichodesmium:<br />
<strong>Hutchins</strong> <strong>et</strong> <strong>al</strong>. <strong>2007</strong><br />
Barcelos e Ramos <strong>et</strong> <strong>al</strong>. <strong>2007</strong><br />
Levitan <strong>et</strong> <strong>al</strong>. <strong>2007</strong><br />
Kranz <strong>et</strong> <strong>al</strong>. 2009<br />
Crocosphaera:<br />
Fu <strong>et</strong> <strong>al</strong>. 2008<br />
16<br />
16
Elevated N 2 fixation rates at high pCO 2 in cultured cyanobacteria<br />
1) Trichodesmium erythraeum strain GBR at 29 o C, 380-750 ppm CO 2 (<strong>Hutchins</strong> <strong>et</strong> <strong>al</strong>. <strong>2007</strong>)<br />
2) T. erythraeum strain GBR at 25 o C, 380-750 ppm CO 2 (<strong>Hutchins</strong> <strong>et</strong> <strong>al</strong>. <strong>2007</strong>)<br />
3) T. erythraeum strain IMS 101 at both 25 o C and 29 o C, 380-750 ppm CO 2 (<strong>Hutchins</strong> <strong>et</strong> <strong>al</strong>.<br />
<strong>2007</strong>)<br />
4) T. erythraeum strain IMS 101 at 25 o C, 380-750 ppm CO 2 (Barcelos e Ramos <strong>et</strong> <strong>al</strong>. <strong>2007</strong>)<br />
5) T. erythraeum strain IMS 101 at 25 o C, 400-900 ppm CO 2 (Levitan <strong>et</strong> <strong>al</strong>. <strong>2007</strong>)<br />
6) T. erythraeum strain IMS 101 at 25 o C, 370-1000 ppm CO 2 (Kranz <strong>et</strong> <strong>al</strong>. 2009)<br />
7) Crocosphaera watsonii strain WH8501 at 28 o C, 380-750 ppm CO 2 (Fu <strong>et</strong> <strong>al</strong>. 2008)<br />
<strong>Hutchins</strong> <strong>et</strong> <strong>al</strong>. 2009, Oceanography<br />
17<br />
17
Short-term CO 2 enrichments using natur<strong>al</strong> Trichodesmium<br />
colonies from the Gulf of Mexico<br />
<br />
<br />
<strong>Hutchins</strong> <strong>et</strong> <strong>al</strong>. 2009, Oceanography<br />
18<br />
18
Future trends in glob<strong>al</strong> N 2 fixation<br />
by Trichodesmium?<br />
Maximum (blue) and minimum (red) projected annu<strong>al</strong> glob<strong>al</strong> N 2 fixation increases<br />
versus pCO 2 (green)<br />
<strong>Hutchins</strong> <strong>et</strong> <strong>al</strong>. 2009, Oceanography<br />
19<br />
19
pCO 2 and P<br />
co-limitation<br />
of Trichodesmium<br />
N 2 fixation<br />
P-repl<strong>et</strong>e<br />
Adding either P or CO 2<br />
will increase N 2 fixation<br />
and growth rates of<br />
P-limited cultures<br />
at present day pCO 2<br />
P-limited<br />
Control High<br />
temp<br />
High<br />
CO 2<br />
Greenhouse<br />
<strong>Hutchins</strong> <strong>et</strong> <strong>al</strong>. <strong>2007</strong>, Limnology & Oceanography 52<br />
20<br />
20
Crocosphaera: N 2 fixation rates as a<br />
function of pCO 2 and Fe<br />
N 2 fixation rates<br />
Fu <strong>et</strong> <strong>al</strong>. 2008. Interactions<br />
b<strong>et</strong>ween changing pCO 2 ,<br />
N 2 fixation, and Fe limitation<br />
in the marine unicellular<br />
cyanobacterium Crocosphaera.<br />
L&O 53: 2472- 2484<br />
21
The two nutrients Fe and P<br />
interact very differently with<br />
changing pCO 2 in N 2 -fixing<br />
cyanobacteria<br />
• Severe Fe limitation essenti<strong>al</strong>ly<br />
cancels out the stimulatory effect of<br />
increased pCO 2<br />
• Severe P limitation however does<br />
not- effectively, the cells are colimited<br />
by both P and CO 2<br />
22<br />
22
Not <strong>al</strong>l N 2 -‐fixing cyanobacteria <br />
will necessarily benefit <br />
from high pCO 2 : <br />
The harmful bloom species <br />
Nodularia spumigena <br />
from the brackish B<strong>al</strong>)c Sea <br />
Czerny <strong>et</strong> <strong>al</strong>. 2009, <br />
Biogeosciences Discussions 6: 4279-‐4304 <br />
23<br />
23
Nitrogen fixa)on measurements <br />
1. Measurements of ac<strong>et</strong>ylene reduc)on to <strong>et</strong>hylene using gas <br />
chromatography <br />
(Capone 1993. D<strong>et</strong>ermina3on of nitrogenase ac3vity in aqua3c <br />
samples using the ac<strong>et</strong>ylene reduc3on procedure. Handbook <br />
of m<strong>et</strong>hods in aqua3c microbi<strong>al</strong> ecology, pp. 621-‐631, Lewis <br />
Publishers). <br />
2. 15 N 2 incorpora)on measured by mass spectrom<strong>et</strong>ry <br />
(Mulholland and Bernhardt, 2005. The effect of growth rate, <br />
phosphorus concentra3on, and temperature on N 2 fixa3on, <br />
carbon fixa3on, and nitrogen release in con3nuous cultures of <br />
Trichodesmium IMS101. Limnol. Oceanogr. 50: 839–849). <br />
24
Denitrification<br />
+5<br />
+4<br />
NO 3<br />
-<br />
+3<br />
NO 2<br />
-<br />
Oxidation state<br />
+2<br />
+1<br />
0<br />
N 2<br />
N 2 O<br />
NO<br />
anammox<br />
-1<br />
-2<br />
-3<br />
NH 3 /<br />
NH 4<br />
+<br />
assimilation<br />
degradation<br />
Organic<br />
Nitrogen<br />
25
Denitrifica)on <br />
1. H<strong>et</strong>erotrophic, largely facultative anaerobic micro-organisms<br />
(eubacteria, archaea, and fungi) use oxidized NO 3<br />
-<br />
as a<br />
respiratory termin<strong>al</strong> electron acceptor, reducing it through a series<br />
of intermediates to N 2 .<br />
2. Denitrification occurs in the large water column suboxic<br />
regions (tropic<strong>al</strong> North and South Pacific, Arabian Sea),<br />
and in suboxic sediments worldwide.<br />
3. Along with annamox, denitrification represents the principle<br />
loss term for fixed nitrogen in the ocean.<br />
26
Carbon “overconsump)on” at high pCO 2 ? <br />
C:N = 6.0 <br />
at 350 ppm <br />
C:N = 8.8 <br />
at 1050 ppm <br />
Riebesell <strong>et</strong> <strong>al</strong>. <strong>2007</strong>, Nature 450: 545-‐548 <br />
27
Oschlies <strong>et</strong> <strong>al</strong>. 2008, Glob<strong>al</strong> Biogeochemic<strong>al</strong> Cycles 22 <br />
“Simulated 21st century's increase in oceanic suboxia by CO 2 -‐enhanced <br />
bio3c carbon export” <br />
28
Simulated effects of warming and stratification<br />
on glob<strong>al</strong> suboxic water volume<br />
Future increases in the<br />
glob<strong>al</strong> volume of hypoxic water<br />
Matear and Hirst 2003,<br />
Glob<strong>al</strong> Biogeochemic<strong>al</strong> Cycles 17<br />
Differences in zon<strong>al</strong> mean of<br />
ocean dissolved O 2 b<strong>et</strong>ween<br />
2080–2100 and 1980–2000<br />
Bopp <strong>et</strong> <strong>al</strong>. 2002,<br />
Glob<strong>al</strong> Biogeochemic<strong>al</strong> Cycles 16<br />
29
Denitrifica3on measurements <br />
1. Stoichiom<strong>et</strong>ric c<strong>al</strong>cula3ons-‐ NO<br />
-‐<br />
3 deficit (nega3ve <br />
N*, Deutsch <strong>et</strong> <strong>al</strong>. 2001, Gruber and Sarmiento 1997, <br />
2002) <br />
2. Enzyma3c ac3vity of electron transport systems <br />
measured colorim<strong>et</strong>ric<strong>al</strong>ly using the ar3fici<strong>al</strong> <br />
electron acceptor t<strong>et</strong>razolium (Devol, 1975, Codispo3 <br />
and Packard, 1980, Naqvi and Shailaja, 1993) <br />
3. 15 NO 3<br />
-‐ <br />
incuba3on experiments measuring the <br />
produc3on of 29 N 2 by mass spectrom<strong>et</strong>ry (Devol <strong>et</strong> <strong>al</strong>. <br />
2006) <br />
Devol, A.H. 2008. Denitrifica3on including anammox. pp. 263-‐302, In: <br />
Nitrogen in the Marine Environment, 2 nd edi3on. Capone, D.G., Bronk, <br />
D.A., Mulholland, M.R. and Carpenter, E.J. [Eds.], Elsevier Press, <br />
Amsterdam. <br />
30
Nitrification<br />
+5<br />
+4<br />
NO 3<br />
-<br />
+3<br />
NO 2<br />
-<br />
Oxidation state<br />
+2<br />
+1<br />
0<br />
N 2<br />
N 2 O<br />
NO<br />
anammox<br />
-1<br />
-2<br />
-3<br />
NH 3 /<br />
NH 4<br />
+<br />
assimilation<br />
degradation<br />
Organic<br />
Nitrogen<br />
31
Nitrifica)on <br />
• Oxida)on of ammonia/ammonium first to nitrite, then to <br />
nitrate <br />
• Aerobic, chemoautotrophic eubacteria and archaea obtain <br />
electrons from these reduced nitrogen compounds to fix CO 2 <br />
• A large frac)on occurs just below the eupho)c zone (Yool <strong>et</strong> <br />
<strong>al</strong>. <strong>2007</strong>), where it is vulnerable to near-‐term ocean <br />
acidifica)on <br />
• NH 3 -‐oxidizing genus Nitrosomonas and the NO 2-‐ -‐oxidizing <br />
genus Nitrobacter fix carbon using the C<strong>al</strong>vin cycle <br />
• Seawater ammonia/ammonium (NH 3 /NH 4+ ) buffer system <br />
pKa ~9.19; over the next century the frac)on of NH 3 will <br />
decrease by nearly 50%, from ~6% to ~3%. <br />
• NH 3 appears to be the chemic<strong>al</strong> species actu<strong>al</strong>ly oxidized by <br />
Nitrosomonas (Suzuki <strong>et</strong> <strong>al</strong>. 1974, Ward 1987) <br />
32
Nitrification rates decrease with acidification<br />
Huesemann <strong>et</strong> <strong>al</strong>. 2002, Marine Pollution Bull<strong>et</strong>in 44: 142-148<br />
33
Modeled effects of a 20% reduc)on <br />
Change in the ra)o of nitrate: tot<strong>al</strong> DIN (%) <br />
in North Sea nitrifica)on rates at 1000 ppm CO 2 <br />
34 <br />
Blackford and Gilbert <strong>2007</strong> <br />
Journ<strong>al</strong> of Marine Systems 64: 229-‐241
pH effects on nitrification<br />
BATS<br />
(North Atlantic<br />
Centr<strong>al</strong> Gyre)<br />
HOT<br />
(North Pacific<br />
Centr<strong>al</strong> Gyre)<br />
SPOT<br />
(Coast<strong>al</strong><br />
C<strong>al</strong>ifornia)<br />
Beman <strong>et</strong> <strong>al</strong>.<br />
submitted<br />
36
Nitrifica)on measurements <br />
1. Simple mass b<strong>al</strong>ance nutrient measurements of changes in<br />
NO 2<br />
-<br />
and NH 4<br />
+<br />
concentrations in seawater, som<strong>et</strong>imes coupled<br />
with specific inhibitors of NH 4<br />
+<br />
oxidation (ac<strong>et</strong>ylene, <strong>al</strong>lylthiourea,<br />
m<strong>et</strong>hyl fluoride, N-serve) or NO 2<br />
-<br />
oxidation (chlorate).<br />
2. Inhibitors can <strong>al</strong>so be coupled with 14 CO 2 uptake measurements<br />
Problems: inhibitor artifacts, long incubations<br />
3. 15 N substrate tracer measurements using mass spectrom<strong>et</strong>ry<br />
Problem: True tracer levels som<strong>et</strong>imes hard to achieve, though.<br />
4. Isotopic enrichment factors: Ammonium oxidizers produce<br />
isotopic<strong>al</strong>ly enriched NH 4<br />
+<br />
and isotopic<strong>al</strong>ly depl<strong>et</strong>ed NO 2<br />
-<br />
Ward, B.B. 2008. Nitrification in marine systems.<br />
pp. 199-262. In: Nitrogen in the Marine Environment,<br />
2 nd edition, Elsevier Press.<br />
37
The silicon cycle <br />
1. Si is a required element for the shells of<br />
diatoms and silicoflagellates (phytoplankton),<br />
as well as radiolarians (protozoa).<br />
2. Principle dissolved form in seawater is silicic<br />
acid (H 4 SiO 4 ); forms a buffer system in<br />
seawater (pK a1 =9.84, pK a2 =13.2)<br />
3. Very simple cycle: no gas phase or organic<br />
forms.<br />
4. How is the use of Si<br />
affected by ocean<br />
acidification?<br />
38
Most studies have found<br />
little or no direct impact of changing pCO 2<br />
on diatom Si utilization<br />
Cellular Si quotas of a cultured diatom <br />
are unchanged b<strong>et</strong>ween 370 and 750 ppm CO 2 <br />
Milligan <strong>et</strong> <strong>al</strong>. 2004, <br />
Limnology and Oceanography 42: 322-‐329 <br />
Silicate drawdown is identic<strong>al</strong><br />
at 350, 700 and 1050 ppm CO 2<br />
in a Bergen mesocosm experiment<br />
Bellerby <strong>et</strong> <strong>al</strong>. 2008,<br />
Biogeosciences Discussions 4<br />
39
pCO 2 and temperature indirectly change Si cycling<br />
due to phytoplankton community shifts<br />
0.08<br />
0.06<br />
North Atlantic Bloom<br />
incubation experiment<br />
0.04<br />
0.02<br />
0<br />
Changing Si:N utilization ratios due to<br />
a CO 2 -driven community shift b<strong>et</strong>ween<br />
diatoms and Phaeocystis<br />
Adapted from Tortell <strong>et</strong> <strong>al</strong>. 2002, MEPS 236<br />
Changing particulate Si: C ratios<br />
due to a temperature-driven<br />
community shift b<strong>et</strong>ween<br />
diatoms and coccolithophores<br />
Feng <strong>et</strong> <strong>al</strong>. 2009. MEPS 388: 13–25.<br />
40
Ocean acidifica)on enhances <br />
the silica dissolu)on rates of empty diatom frustules <br />
Milligan <strong>et</strong> <strong>al</strong>. 2004, Limnology and Oceanography 42: 322-‐329 <br />
41
Rising temperature and pCO 2 drive shils from diatom to <br />
nanophytoplankton dominance in the Bering Sea <br />
(Hare <strong>et</strong> <strong>al</strong>. <strong>2007</strong>, Marine Ecology Progress Series 352: 9-‐16. ) <br />
42
Silicon measurements<br />
Biogenic silica measurements: Simple spectrophotom<strong>et</strong>ric m<strong>et</strong>hod,<br />
after <strong>al</strong>k<strong>al</strong>ine digestion of BSi on filter samples to form silicic acid.<br />
(Brzezinski and Nelson 1986, Marine Chemistry 19: 139-151;<br />
Feng <strong>et</strong> <strong>al</strong>. 2009. MEPS 388: 13-25)<br />
32<br />
Si radioisotope tracer uptake:<br />
(Brzezinski. 1997. L&O 42 : 856;<br />
De la Rocha <strong>et</strong> <strong>al</strong>. 2000.<br />
MEPS195: 71- 79).<br />
PDMPO: A fluorophore to trace new Si deposition<br />
in diatoms (Leblanc and <strong>Hutchins</strong> 2005,<br />
L&O M<strong>et</strong>hods 3: 462- 476. )<br />
43
The phosphorus cycle <br />
1. P is required by <strong>al</strong>l cells for nucleotides<br />
and nucleic acids, and for some phosphorylated<br />
proteins; required by most cells for phospholipid<br />
cell membranes<br />
2. Principle form in seawater is as orthophosphate<br />
or dissolved organic phosphorus; dominant form<br />
of inorganic phosphorus at pH 8 is HPO 4<br />
2-<br />
(~87%),<br />
but the fraction of H 2 PO 4<br />
-<br />
will increase with future<br />
acidification.<br />
3. Simple cycle: No gas phase.<br />
4. Will P requirements change with<br />
ocean acidification?<br />
44
Phytoplankton P requirements: <br />
Usu<strong>al</strong>ly, liole or no response to pCO 2 increases <br />
Feng <strong>et</strong> <strong>al</strong>. 2008 <br />
European Journ<strong>al</strong> of Phycology 43: 87-‐98 <br />
Fu <strong>et</strong> <strong>al</strong>. <strong>2007</strong> <br />
Journ<strong>al</strong> of Phycology 43: 485-‐496 <br />
45
Phosphorus measurements<br />
Particulate organic phosphorus measurements: Simple<br />
spectrophotom<strong>et</strong>ric m<strong>et</strong>hod, after digestion of POP on filter samples to<br />
form phosphate. (Fu <strong>et</strong> <strong>al</strong> 2005, L&O 50: 1459-1472; Fu <strong>et</strong> <strong>al</strong> <strong>2007</strong>,<br />
Journ<strong>al</strong> of Phycology 43: 485- 496.)<br />
33<br />
P radioisotope tracer uptake: Commerci<strong>al</strong>ly available 33 P-labeled<br />
phosphate, ATP, <strong>et</strong>c. (Fu <strong>et</strong> <strong>al</strong>. 2006, European Journ<strong>al</strong> of Phycology<br />
41: 15-28)<br />
Cell surface scavenging of P: A cell<br />
surface wash can be used to remove<br />
adsorbed phosphate from cells,<br />
giving a b<strong>et</strong>ter estimate of true cellular<br />
P quotas (Sanudo-Wilhelmy <strong>et</strong> <strong>al</strong>. 2004,<br />
Nature 432: 897- 901; Fu <strong>et</strong> <strong>al</strong>. 2005,<br />
Limnology and Oceanography 50:<br />
1459- 1472.)<br />
46
Phytoplankton element<strong>al</strong> stochiom<strong>et</strong>ry<br />
in the high CO 2 ocean<br />
C:N and N:P<br />
1. Evidence from culture studies of cyanobacteria<br />
and eukaryotic <strong>al</strong>gae<br />
2. Evidence from natur<strong>al</strong> phytoplankton community<br />
manipulation experiments<br />
47
1 &2, Synechococcus and Prochlorococcus at 380 and 750 ppm CO 2 (Fu <strong>et</strong> <strong>al</strong>. <strong>2007</strong>) <br />
3 &4, Fe-‐repl<strong>et</strong>e and Fe-‐limited Crocosphaera at 380 grown aand 750 ppm CO 2 (Fu <strong>et</strong> <strong>al</strong>. 2008) <br />
5&6 P-‐repl<strong>et</strong>e and P-‐limited Trichodesmium at 380 and 750 ppm CO 2 (<strong>Hutchins</strong> <strong>et</strong> <strong>al</strong>. <strong>2007</strong>) <br />
7 Trichodesmium at 400 and 900 ppm CO 2 (Levitan <strong>et</strong> <strong>al</strong>. <strong>2007</strong>) <br />
8 Trichodesmium at 380 and 750 ppm CO 2 (Barcelos e Ramos <strong>et</strong> <strong>al</strong>. <strong>2007</strong>) <br />
9 Trichodesmium at 370 and 1000 ppm CO 2 (Kranz <strong>et</strong> <strong>al</strong>. 2009) <br />
<strong>Hutchins</strong> <strong>et</strong> <strong>al</strong>. 2009, Oceanography<br />
48
10 &11 Diatoms Asterionella at 430 and 820 ppm CO 2 and Skel<strong>et</strong>onema at 400 and 720 pCO 2 (Burkhardt <strong>et</strong> <strong>al</strong>. 1999) <br />
12 &13 Antarc3c diatom Cha<strong>et</strong>oceros and prymnesiophyte Phaeocys8s at 430 and 820 ppm CO 2 (Fu <strong>et</strong> <strong>al</strong>. unpubl results) <br />
14&15 Coccolithophorid Emiliania huxleyi under low and high light at 375 and 750 ppm pCO 2 (Feng <strong>et</strong> <strong>al</strong>. 2008) <br />
16 Coccolithophorid Emiliania huxleyi at 490 and 750 ppm pCO 2 (Iglesias-‐Rodriguez <strong>et</strong> <strong>al</strong>. 2008) <br />
17&18 Non-‐c<strong>al</strong>cifying Emiliania huxleyi gunder low and high light at 360 and 2000 ppm CO 2 (Leonardos and Geider 2005) <br />
19 &20 Toxic raphidophyte H<strong>et</strong>erosigma and the dinoflagellate Prorocentrum at 375 and 750 ppm pCO 2 (Fu <strong>et</strong> <strong>al</strong>. 2008) <br />
21 &22 P-‐repl<strong>et</strong>e and P-‐limited dinoflagellate Karlodinium at 430 and 745 ppm CO 2 (Fu <strong>et</strong> <strong>al</strong>. in review) <br />
<strong>Hutchins</strong> <strong>et</strong> <strong>al</strong>. 2009, Oceanography<br />
49
23. North Atlan3c spring bloom, 390 and 690 ppm CO 2 (Feng <strong>et</strong> <strong>al</strong>. 2009) <br />
24. Ross Sea, Antarc3ca, 380 and 750 ppm CO 2 (Feng <strong>et</strong> <strong>al</strong>. in review) <br />
25. Equatori<strong>al</strong> Pacific, 150 and 750 ppm CO 2 (Tortell <strong>et</strong> <strong>al</strong>. 2002) <br />
26. Norwegian oord, 350 and 700 ppm CO 2 (Riebesell <strong>et</strong> <strong>al</strong>. <strong>2007</strong>) <br />
27. Norwegian oord, 410 and 710 ppm pCO 2 (Engel <strong>et</strong> <strong>al</strong>. 2005) <br />
28. Korean coast<strong>al</strong> waters, 400 and 750 ppm CO 2 (Kim <strong>et</strong> <strong>al</strong>. 2006) <br />
29 &30. Bering Sea shelf at 10 o C and 15 o C, 370 and 750 ppm pCO 2 (Hare <strong>et</strong> <strong>al</strong>. <strong>2007</strong>) <br />
31 &32. Bering Sea offshore at 10 o C and 15 o C, 370 and 750 ppm pCO 2 (Hare <strong>et</strong> <strong>al</strong>. <strong>2007</strong>) <br />
33 &34. U.S. East Coast estuary, 380 and 750 ppm pCO 2 (Fu <strong>et</strong> <strong>al</strong>. unpubl.results) <br />
<strong>Hutchins</strong> <strong>et</strong> <strong>al</strong>. 2009, Oceanography<br />
50
Gener<strong>al</strong>iza)ons <br />
-‐ C:N and N:P ra)os of individu<strong>al</strong> phytoplankton <br />
species open increase at high pCO 2 , but the trends <br />
in whole community stoichiom<strong>et</strong>ry are much more <br />
variable <br />
-‐ Be cau)ous when extrapola)ng from any <br />
par)cular experiment or regime to the whole <br />
future ocean… <br />
-‐ More work is needed to draw firm conclusions <br />
about the effects of OA on major element<strong>al</strong> <br />
stoichiom<strong>et</strong>ry. <br />
51
Trace m<strong>et</strong><strong>al</strong>s <br />
1. Iron (Fe) is the trace m<strong>et</strong><strong>al</strong> with by far the best documented<br />
biogeochemic<strong>al</strong> impacts. Phytoplankton production is limited or<br />
co-limited by this micronutrient over a large fraction of the ocean<br />
surface.<br />
2. Iron is heavily involved in photosynthesis, respiration, nitrate<br />
uptake, and nitrogen fixation , making Fe/CO 2 interactions very<br />
likely.<br />
3. Other bioactive trace elements whose cycles may potenti<strong>al</strong>ly be<br />
affected by ocean acidification include Mo (required for nitrogen<br />
fixation), as well as Zn, Cd, and Co (<strong>al</strong>l co-factors for various forms<br />
of carbonic anhydrase).<br />
4. Effects of acidification on trace m<strong>et</strong><strong>al</strong> cycling may include changes<br />
in biologic<strong>al</strong> requirements; shifts in their inorganic chemic<strong>al</strong><br />
speciation (e.g., many are affected by carbonato complexation); and<br />
possible pH effects on the m<strong>et</strong><strong>al</strong>-binding function<strong>al</strong> groups of<br />
organic ligands.<br />
52
Will biologic<strong>al</strong> demand for m<strong>et</strong><strong>al</strong>s used as<br />
cofactors for carbonic anhydrase (like Zn,<br />
Cd, and Co) be lower in the future high<br />
CO 2 ocean?<br />
53
pCO 2 , carbonic anhydrase ac3vity, and <br />
cellular Zn:C <br />
(Sunda and Huntsman 2005) <br />
At higher pCO 2 (lower pH), phytoplankton have much lower<br />
levels of CA activity, and require much less cellular Zn<br />
54
Changes in natur<strong>al</strong> community Cd:P <br />
with varying pCO 2 <br />
(Cullen and Sherrell 2005) <br />
55
Trace m<strong>et</strong><strong>al</strong> quotas (mmol m<strong>et</strong><strong>al</strong>: mol P) of a <br />
natur<strong>al</strong> Phaeocys?s bloom in the Ross Sea, <br />
incubated at 380 ppm and 750 ppm CO 2 . <br />
CO 2<br />
levels <br />
380<br />
ppm <br />
750<br />
ppm <br />
Cd:P Co:P Zn:P Fe:P Mn:P <br />
0.20 0.012 8.7 10.7 0.28 <br />
0.095 0.002 0.34 5.1 0.12 <br />
<strong>Hutchins</strong> <strong>et</strong> <strong>al</strong>. in preparation<br />
56
Crocosphaera: N 2 fixa?on rates as a func?on of <br />
pCO 2 and Fe <br />
N 2 fixation rates<br />
Cellular Fe quota<br />
Fu <strong>et</strong> <strong>al</strong>. 2008 L&O 53: 2472-‐ 2484 <br />
57
Sanudo-Wilhelmy, Fu and<br />
<strong>Hutchins</strong> unpublished 58
Trichodesmium <br />
Fe:P ra3os increase <br />
~40% b<strong>et</strong>ween <br />
370 and <br />
750 ppm CO 2 <br />
But decrease by about the<br />
same amount with a 5 o C<br />
temperature increase…<br />
Sanudo-Wilhelmy, Fu and<br />
<strong>Hutchins</strong> unpublished<br />
59
Trace m<strong>et</strong><strong>al</strong> biogeochemic<strong>al</strong> m<strong>et</strong>hods <br />
Approaches: <br />
-‐Laboratory culture studies <br />
-‐Field incuba3ons and measurements <br />
-‐Both require combining OA m<strong>et</strong>hods with scrupulous trace m<strong>et</strong><strong>al</strong> clean <br />
techniques (see Bruland <strong>et</strong> <strong>al</strong>. 1991, L&O 36: 1555-‐1577). <br />
An<strong>al</strong>y3c<strong>al</strong> m<strong>et</strong>hods: <br />
-‐Radiotracer techniques-‐ 55 Fe, 59 Fe, 65 Zn, 109 Cd, <strong>et</strong>c. (<strong>Hutchins</strong> <strong>et</strong> <strong>al</strong>. 1999 AME <br />
19: 129-‐138) <br />
-‐Titanium and ox<strong>al</strong>ate wash m<strong>et</strong>hods to remove cell surface-‐scavenged m<strong>et</strong><strong>al</strong>s <br />
(Hudson and Morel 1989 L&O 34: 1113–1120; Tovar-‐Sanchez <strong>et</strong> <strong>al</strong>. 2003 <br />
Marine Chemistry 82: 91-‐99) <br />
-‐Graphite Furnace Atomic Absorp3on Spectrom<strong>et</strong>ry (GFAAS, Bruland <strong>et</strong> <strong>al</strong>. <br />
1985 Mar. Chem 17: 285-‐300). <br />
-‐Induc3vely Coupled Plasma Mass Spectrom<strong>et</strong>ry (ICP-‐MS) Bulk measurements <br />
and now m<strong>et</strong><strong>al</strong> specia3on (coupled with HPLC) and trace m<strong>et</strong><strong>al</strong> stable <br />
isotopes (Mul3-‐Collector ICP-‐MS). (Wells and Bruland 1998 Mar. Chem. 63: <br />
145-‐153; Bergquist and Boyle 2006, Earth and Plan Sci L<strong>et</strong> 248: 54-‐68; <br />
Dauphas and Rouxel 2006. Mass Spec Rev 25: 515-‐550; ). <br />
-‐Synchrotron X-‐Ray Fluorescence (SXRF), Measurements and loc<strong>al</strong>iza3on of <br />
trace m<strong>et</strong><strong>al</strong>s in individu<strong>al</strong> cells and par3cles (Twining <strong>et</strong> <strong>al</strong>. 2004, L&O 49: <br />
2115; Lamborg <strong>et</strong> <strong>al</strong>. 2008. DSR II 55: 1564). <br />
60
Radioisotope versus SXRF comparison <br />
Twining <strong>et</strong> <strong>al</strong>. 2004, DSR I 51<br />
61
Conclusions<br />
1. Changes in ocean pCO 2 and acidification will fundament<strong>al</strong>ly change<br />
the present-day ocean biogeochemistry of carbon and nitrogen.<br />
Changes in the phosphorus and silicon cycles may be indirect and<br />
less dramatic. Trace m<strong>et</strong><strong>al</strong> biogeochemic<strong>al</strong> responses are just now<br />
beginning to be investigated.<br />
2. Interactions of other glob<strong>al</strong> change variables like temperature,<br />
stratification, and major and micronutrients with pCO 2 are at least as<br />
important to consider as OA effects in isolation. Reductionist, “CO 2 -<br />
centric” experiments can often give incompl<strong>et</strong>e or mis-leading<br />
results.<br />
3. A new generation of experiment<strong>al</strong>, observation<strong>al</strong>, and modeling work<br />
is needed to address issues of long-term biogeochemic<strong>al</strong> changes,<br />
including the effects of biologic<strong>al</strong> acclimation and adaptation.<br />
4. The responses of numerous key ocean biogeochemic<strong>al</strong> processes<br />
to ocean acidification have been tested only in very preliminary studies,<br />
or not at <strong>al</strong>l. There is a lot of room for new investigators in this<br />
62<br />
field…
Acknowledgements <br />
F. Fu, M. Beman, P. Boyd, J. DiTullio, Y. Feng, S. Handy, C. Hare, K. Leblanc, <br />
M. Mulholland, N. Garcia, J. Rose, S. Sanudo-‐Wilhelmy <br />
NSF OCE Biologic<strong>al</strong> Oceanography <br />
NSF OCE Chemic<strong>al</strong> Oceanography <br />
NSF Office of Polar Programs <br />
63
The marine nitrogen cycle<br />
+5<br />
+4<br />
NO 3<br />
-<br />
+3<br />
NO 2<br />
-<br />
Oxidation state<br />
+2<br />
+1<br />
0<br />
N 2<br />
N 2 O<br />
NO<br />
anammox<br />
-1<br />
-2<br />
-3<br />
NH 3 /<br />
NH 4<br />
+<br />
assimilation<br />
degradation<br />
Organic<br />
Nitrogen<br />
64