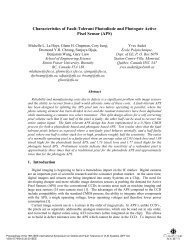
Adding Grayscale Layer to Chrome Photomasks - Professor Glenn ...
Adding Grayscale Layer to Chrome Photomasks - Professor Glenn ...
Adding Grayscale Layer to Chrome Photomasks - Professor Glenn ...

Create successful ePaper yourself
Turn your PDF publications into a flip-book with our unique Google optimized e-Paper software.
Figure 11. Test square structures with sizes of 1, 2, 3, 5, 10 and 50 µm 2 . The entire area of the test square<br />
structures was laser scanned by the argon laser at 0.1W (maximum) power. Laser scanning makes the<br />
Bi/In layer transparent, thus revealing the original binary structures on the chrome layer.<br />
5.4 <strong>Grayscale</strong> Test Patterns<br />
Directly above the line test structures at the bot<strong>to</strong>m of the cleared chrome area are the grayscale test structures of<br />
different shapes. The bitmap image used for these test structures is shown in Figure 12. An important setting that<br />
affects how the bitmap is written on <strong>to</strong> the pho<strong>to</strong>mask is the pixel size. The pixel size describes the pho<strong>to</strong>mask<br />
dimensions for each pixel in the bitmap. In this example, Figure 12 is a bitmap image with 300 by 3500 pixels. Using a<br />
1 um/pixel pixel size, the resulting pattern written on the mask is 300 µm by 3500 µm. Using a 2 µm/pixel pixel size,<br />
the resulting pattern is 600 µm by 7000 µm. In our experiment, we used a <strong>to</strong>tal of three different pixel sizes: 1, 2, and<br />
4 µm/pixel. Figure 13 - Figure 18 show the resulting grayscale structures on the bimetallic-chrome pho<strong>to</strong>mask with two<br />
different laser spot size (1 µm/pixel and 2 µm/pixel) and three different minimum <strong>to</strong> maximum argon laser power ranges<br />
(0.01W <strong>to</strong> 0.065W, 0.01W <strong>to</strong> 0.06W and 0.01W <strong>to</strong> 0.045W). Examining the grayscale bar at the <strong>to</strong>p of each figure, the<br />
effect the voltage can be seen changing the position of where the grayscale shifts from white <strong>to</strong> black.<br />
Figure 12. Bitmap image for the grayscale test structures.<br />
Figure 13. <strong>Grayscale</strong> pattern using a minimum <strong>to</strong><br />
maximum argon laser power range from 0.01W <strong>to</strong> 0.065W<br />
and a 1 µm laser spot size. The size of the entire pattern is<br />
300 µm wide by 3500 µm tall.<br />
Figure 14. <strong>Grayscale</strong> pattern using a minimum <strong>to</strong><br />
maximum argon laser power range from 0.01W <strong>to</strong><br />
0.065W and a 2 µm laser spot size. The size of the entire<br />
pattern is 300 µm wide by 3500 µm tall.<br />
Figure 15. <strong>Grayscale</strong> pattern using a minimum <strong>to</strong><br />
maximum argon laser power range from 0.01W <strong>to</strong> 0.06W<br />
and a 1 µm laser spot size. The size of the entire pattern<br />
is 300 µm wide by 3500 µm tall.<br />
Figure 16. <strong>Grayscale</strong> pattern using a minimum <strong>to</strong><br />
maximum argon laser power range from 0.01W <strong>to</strong> 0.06W<br />
and a 2 µm laser spot size. The size of the entire pattern is<br />
300 µm wide by 3500 µm tall.<br />
Figure 17. <strong>Grayscale</strong> pattern using a minimum <strong>to</strong><br />
maximum argon laser power range from 0.01W <strong>to</strong><br />
0.045W and a 1 µm laser spot size. The size of the entire<br />
pattern is 300 µm wide by 3500 µm tall.<br />
Figure 18. <strong>Grayscale</strong> pattern using a minimum <strong>to</strong><br />
maximum argon laser power range from 0.01W <strong>to</strong> 0.045W<br />
and a 2 µm laser spot size. The size of the entire pattern is<br />
300 µm wide by 3500 µm tall.<br />
5.5 <strong>Grayscale</strong> Test Squares<br />
Table 2 summarizes the argon laser power used <strong>to</strong> scan the ten squares at the <strong>to</strong>p of the chrome mask and their<br />
measured optical densities.