scatterplots and line of best fit worksheet 7.pdf
scatterplots and line of best fit worksheet 7.pdf
scatterplots and line of best fit worksheet 7.pdf

You also want an ePaper? Increase the reach of your titles
YUMPU automatically turns print PDFs into web optimized ePapers that Google loves.
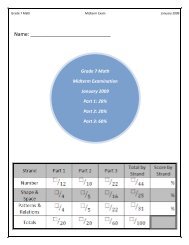
NAME DATE PERIOD<br />
2-5 Skills Practice<br />
Scatter Plots <strong>and</strong> Lines <strong>of</strong> Regression<br />
For Exercises 1–3, complete parts a–c.<br />
a. Make a scatter plot <strong>and</strong> a <strong>line</strong> <strong>of</strong> <strong>fit</strong>, <strong>and</strong> describe the correlation.<br />
b. Use two ordered pairs to write a prediction equation.<br />
c. Use your prediction equation to predict the missing value.<br />
1. x y<br />
1 1<br />
y<br />
15<br />
12<br />
3 5<br />
9<br />
4 7<br />
6 11<br />
7 12<br />
6<br />
3<br />
0<br />
1 2 3 4 5 6 7 8 9 10<br />
x<br />
8 15<br />
10 ?<br />
2. x y<br />
5 9<br />
y<br />
40<br />
32<br />
10 17<br />
24<br />
Copyright © Glencoe/McGraw-Hill, a division <strong>of</strong> The McGraw-Hill Companies, Inc.<br />
3.<br />
20 22<br />
25 30<br />
35 38<br />
40 44<br />
50 ?<br />
x y<br />
1 16<br />
2 16<br />
3 ?<br />
4 22<br />
5 30<br />
7 34<br />
16<br />
8<br />
0<br />
y<br />
36<br />
30<br />
24<br />
18<br />
12<br />
6<br />
0<br />
5 10 15 20 25 30 35 40 45 50<br />
1 2 3 4 5 6 7 8<br />
x<br />
x<br />
8 36<br />
Chapter 2 21 Glencoe Algebra 2
NAME DATE PERIOD<br />
2-5 Practice<br />
Scatter Plots <strong>and</strong> Lines <strong>of</strong> Regression<br />
For Exercises 1 <strong>and</strong> 2, complete parts a–c.<br />
a. Make a scatter plot <strong>and</strong> a <strong>line</strong> <strong>of</strong> <strong>fit</strong>, <strong>and</strong> describe the correlation.<br />
b. Use two ordered pairs to write a prediction equation.<br />
c. Use your prediction equation to predict the missing value.<br />
1. FUEL ECONOMY The table gives the<br />
weights in tons <strong>and</strong> estimates the fuel<br />
economy in miles per gallon for<br />
several cars.<br />
Weight (tons) 1.3 1.4 1.5 1.8 2 2.1 2.4<br />
Miles per Gallon 29 24 23 21 ? 17 15<br />
Fuel Economy (mi/gal)<br />
Fuel Economy Versus Weight<br />
30<br />
25<br />
20<br />
15<br />
10<br />
5<br />
0 0.5 1.0 1.5 2.0 2.5<br />
Weight (tons)<br />
2. ALTITUDE As Anchara drives into the mountains, her car thermometer registers the<br />
temperatures ( F) shown in the table at the given altitudes (feet).<br />
Temperature<br />
Altitude (ft) 7500 8200 8600 9200 9700 10,400 12,000<br />
Versus Altitude<br />
65<br />
Temperature (°F) 61 58 56 53 50 46 ?<br />
0 7,000 8,000 9,000 10,000<br />
Altitude (ft)<br />
3. HEALTH Alton has a treadmill that uses the time on the treadmill to estimate the<br />
number <strong>of</strong> Calories he burns during a workout. The table gives workout times <strong>and</strong><br />
Calories burned for several workouts. Find an equation for <strong>and</strong> graph a <strong>line</strong> <strong>of</strong><br />
regression. Then use the function to predict the number <strong>of</strong> Calories burned in<br />
a 60-minute workout.<br />
Time (min) 18 24 30 40 42 48 52 60<br />
Calories Burned 260 280 320 380 400 440 475 ?<br />
Temperature (°F)<br />
60<br />
55<br />
50<br />
45<br />
Copyright © Glencoe/McGraw-Hill, a division <strong>of</strong> The McGraw-Hill Companies, Inc.<br />
Chapter 2 22 Glencoe Algebra 2