Summary - National Assembly for Wales
Summary - National Assembly for Wales
Summary - National Assembly for Wales

Create successful ePaper yourself
Turn your PDF publications into a flip-book with our unique Google optimized e-Paper software.
16<br />
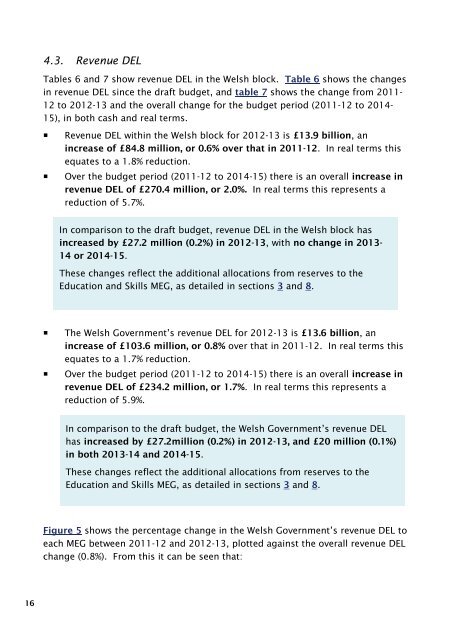
4.3. Revenue DEL<br />
Tables 6 and 7 show revenue DEL in the Welsh block. Table 6 shows the changes<br />
in revenue DEL since the draft budget, and table 7 shows the change from 2011-<br />
12 to 2012-13 and the overall change <strong>for</strong> the budget period (2011-12 to 2014-<br />
15), in both cash and real terms.<br />
� Revenue DEL within the Welsh block <strong>for</strong> 2012-13 is £13.9 billion, an<br />
increase of £84.8 million, or 0.6% over that in 2011-12. In real terms this<br />
equates to a 1.8% reduction.<br />
� Over the budget period (2011-12 to 2014-15) there is an overall increase in<br />
revenue DEL of £270.4 million, or 2.0%. In real terms this represents a<br />
reduction of 5.7%.<br />
In comparison to the draft budget, revenue DEL in the Welsh block has<br />
increased by £27.2 million (0.2%) in 2012-13, with no change in 2013-<br />
14 or 2014-15.<br />
These changes reflect the additional allocations from reserves to the<br />
Education and Skills MEG, as detailed in sections 3 and 8.<br />
� The Welsh Government’s revenue DEL <strong>for</strong> 2012-13 is £13.6 billion, an<br />
increase of £103.6 million, or 0.8% over that in 2011-12. In real terms this<br />
equates to a 1.7% reduction.<br />
� Over the budget period (2011-12 to 2014-15) there is an overall increase in<br />
revenue DEL of £234.2 million, or 1.7%. In real terms this represents a<br />
reduction of 5.9%.<br />
In comparison to the draft budget, the Welsh Government’s revenue DEL<br />
has increased by £27.2million (0.2%) in 2012-13, and £20 million (0.1%)<br />
in both 2013-14 and 2014-15.<br />
These changes reflect the additional allocations from reserves to the<br />
Education and Skills MEG, as detailed in sections 3 and 8.<br />
Figure 5 shows the percentage change in the Welsh Government’s revenue DEL to<br />
each MEG between 2011-12 and 2012-13, plotted against the overall revenue DEL<br />
change (0.8%). From this it can be seen that: