Summary - National Assembly for Wales
Summary - National Assembly for Wales
Summary - National Assembly for Wales

Create successful ePaper yourself
Turn your PDF publications into a flip-book with our unique Google optimized e-Paper software.
28<br />
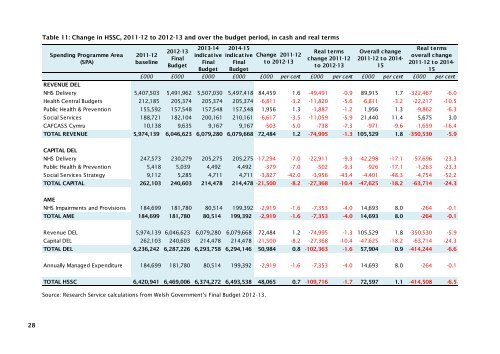
Table 11: Change in HSSC, 2011-12 to 2012-13 and over the budget period, in cash and real terms<br />
Spending Programme Area<br />
(SPA)<br />
REVENUE DEL<br />
2011-12<br />
baseline<br />
2012-13<br />
Final<br />
Budget<br />
2013-14 2014-15<br />
indicat ive indicat ive Change 2011-12<br />
Final Final t o 2012-13<br />
Budget Budget<br />
Real t erms<br />
change 2011-12<br />
t o 2012-13<br />
Overall change<br />
2011-12 t o 2014-<br />
15<br />
Real t erms<br />
overall change<br />
2011-12 t o 2014-<br />
15<br />
£000 £000 £000 £000 £000 per cent £000 per cent £000 per cent £000 per cent<br />
NHS Delivery 5,407,503 5,491,962 5,507,030 5,497,418 84,459 1.6 -49,491 -0.9 89,915 1.7 -322,467 -6.0<br />
Health Central Budgets 212,185 205,374 205,374 205,374 -6,811 -3.2 -11,820 -5.6 -6,811 -3.2 -22,217 -10.5<br />
Public Health & Prevention 155,592 157,548 157,548 157,548 1,956 1.3 -1,887 -1.2 1,956 1.3 -9,862 -6.3<br />
Social Services 188,721 182,104 200,161 210,161 -6,617 -3.5 -11,059 -5.9 21,440 11.4 5,675 3.0<br />
CAFCASS Cymru 10,138 9,635 9,167 9,167 -503 -5.0 -738 -7.3 -971 -9.6 -1,659 -16.4<br />
TOTAL REVENUE 5,974,139 6,046,623 6,079,280 6,079,668 72,484 1.2 -74,995 -1.3 105,529 1.8 -350,530 -5.9<br />
CAPITAL DEL<br />
NHS Delivery 247,573 230,279 205,275 205,275 -17,294 -7.0 -22,911 -9.3 -42,298 -17.1 -57,696 -23.3<br />
Public Health & Prevention 5,418 5,039 4,492 4,492 -379 -7.0 -502 -9.3 -926 -17.1 -1,263 -23.3<br />
Social Services Strategy 9,112 5,285 4,711 4,711 -3,827 -42.0 -3,956 -43.4 -4,401 -48.3 -4,754 -52.2<br />
TOTAL CAPITAL 262,103 240,603 214,478 214,478 -21,500 -8.2 -27,368 -10.4 -47,625 -18.2 -63,714 -24.3<br />
AME<br />
NHS Impairments and Provisions 184,699 181,780 80,514 199,392 -2,919 -1.6 -7,353 -4.0 14,693 8.0 -264 -0.1<br />
TOTAL AME 184,699 181,780 80,514 199,392 -2,919 -1.6 -7,353 -4.0 14,693 8.0 -264 -0.1<br />
Revenue DEL 5,974,139 6,046,623 6,079,280 6,079,668 72,484 1.2 -74,995 -1.3 105,529 1.8 -350,530 -5.9<br />
Capital DEL 262,103 240,603 214,478 214,478 -21,500 -8.2 -27,368 -10.4 -47,625 -18.2 -63,714 -24.3<br />
TOTAL DEL 6,236,242 6,287,226 6,293,758 6,294,146 50,984 0.8 -102,363 -1.6 57,904 0.9 -414,244 -6.6<br />
Annually Managed Expenditure 184,699 181,780 80,514 199,392 -2,919 -1.6 -7,353 -4.0 14,693 8.0 -264 -0.1<br />
TOTAL HSSC 6,420,941 6,469,006 6,374,272 6,493,538 48,065 0.7 -109,716 -1.7 72,597 1.1 -414,508 -6.5<br />
Source: Research Service calculations from Welsh Government’s Final Budget 2012-13.