Review of midair collisions involving general aviation ... - Fly Safe!
Review of midair collisions involving general aviation ... - Fly Safe!
Review of midair collisions involving general aviation ... - Fly Safe!

You also want an ePaper? Increase the reach of your titles
YUMPU automatically turns print PDFs into web optimized ePapers that Google loves.
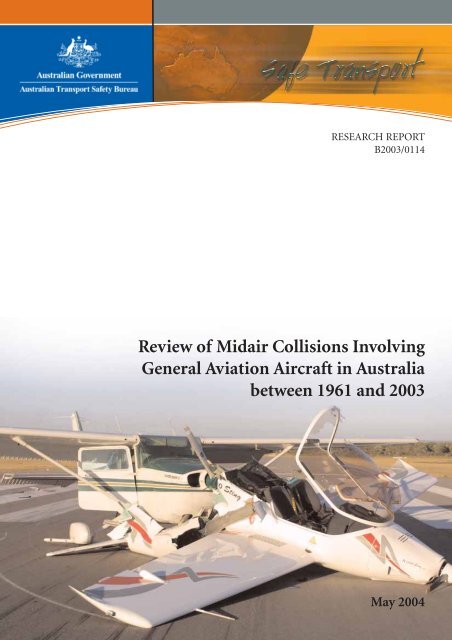
RESEARCH REPORT<br />
B2003/0114<br />
<strong>Review</strong> <strong>of</strong> Midair Collisions Involving<br />
General Aviation Aircraft in Australia<br />
between 1961 and 2003<br />
May 2004
Research Report<br />
B2004/0114<br />
May 2004<br />
<strong>Review</strong> <strong>of</strong> Midair Collisions Involving<br />
General Aviation Aircraft in Australia<br />
between 1961 and 2003<br />
Released under s25(1) <strong>of</strong> the TSI Act<br />
1
Executive Summary<br />
Following three <strong>midair</strong> <strong>collisions</strong> at major <strong>general</strong> <strong>aviation</strong> airports in Australia<br />
between February and July 2002, the Australian Transport <strong>Safe</strong>ty Bureau (ATSB)<br />
conducted a review <strong>of</strong> <strong>midair</strong> <strong>collisions</strong> in Australia between 1961 and 2003. The<br />
objectives <strong>of</strong> the review were to identify common characteristics and contributing<br />
factors, assess whether there had been a change in the <strong>midair</strong> collision rate in recent<br />
years, and to compare the characteristics and rate <strong>of</strong> <strong>midair</strong> <strong>collisions</strong> with those <strong>of</strong><br />
other countries.<br />
The conclusions <strong>of</strong> this review are as follows:<br />
• There were 37 <strong>midair</strong> <strong>collisions</strong> <strong>involving</strong> <strong>general</strong> <strong>aviation</strong> aircraft in Australia<br />
during the period 1961 to 2003. Since 1968, there was approximately one<br />
<strong>midair</strong> collision per year in Australia. Most (34) <strong>of</strong> the <strong>midair</strong> <strong>collisions</strong> were<br />
accidents, and a majority (19) <strong>of</strong> these accidents resulted in fatalities.<br />
• There were no <strong>midair</strong> <strong>collisions</strong> <strong>involving</strong> regular public transport (RPT)<br />
operations in Australia from 1961 to 2003.<br />
• Midair <strong>collisions</strong> account for about 3 per cent <strong>of</strong> fatal accidents <strong>involving</strong><br />
<strong>general</strong> <strong>aviation</strong> aircraft, and 0.4 <strong>of</strong> a percentage point <strong>of</strong> all accidents <strong>involving</strong><br />
<strong>general</strong> <strong>aviation</strong> aircraft.<br />
• Most (78 per cent) <strong>of</strong> the <strong>midair</strong> <strong>collisions</strong> that have occurred in Australia since<br />
1961 have occurred in or near the circuit area. This reflects the higher traffic<br />
density in this area. A high proportion <strong>of</strong> the <strong>collisions</strong> (35 per cent) occurred on<br />
final approach or the base-to-final turn.<br />
• A high proportion <strong>of</strong> the <strong>midair</strong> <strong>collisions</strong> (41 per cent) have occurred at the five<br />
major <strong>general</strong> <strong>aviation</strong> airports (Archerfield, Bankstown, Jandakot, Moorabbin,<br />
Parafield). However, the rate <strong>of</strong> <strong>collisions</strong> at these airports has decreased since<br />
the introduction <strong>of</strong> General Aviation Aerodrome Procedures in 1980.<br />
• A range <strong>of</strong> contributing factors were involved in the <strong>midair</strong> <strong>collisions</strong>, but there<br />
were no dominant factors. Most <strong>of</strong> the <strong>collisions</strong> involved one aircraft colliding<br />
with another from behind, or both aircraft converging from a similar direction.<br />
• In <strong>general</strong>, the characteristics and contributing factors <strong>of</strong> <strong>midair</strong> <strong>collisions</strong> in<br />
Australia appear to be similar to those observed in other countries such as the<br />
US, France and Canada.<br />
• Australia and the US had a similar rate <strong>of</strong> <strong>midair</strong> <strong>collisions</strong> <strong>involving</strong> <strong>general</strong><br />
<strong>aviation</strong> aircraft during the period 1981-2003. The US had a higher rate <strong>of</strong><br />
<strong>general</strong> <strong>aviation</strong> aircraft involved in <strong>collisions</strong> per flight hour away from the<br />
circuit area, which is consistent with the US having more <strong>general</strong> <strong>aviation</strong> flying<br />
activity and a higher traffic density.<br />
3
1. Introduction<br />
1.1 Objectives <strong>of</strong> this study<br />
The purpose <strong>of</strong> this review was to provide an overall indication <strong>of</strong> the risk <strong>of</strong> <strong>midair</strong><br />
<strong>collisions</strong> to <strong>general</strong> <strong>aviation</strong> aircraft in Australia based on actual <strong>midair</strong> collision<br />
data. More specifically, the objectives <strong>of</strong> the review were to:<br />
• review the <strong>midair</strong> <strong>collisions</strong> in Australia for the period 1961-2003;<br />
• identify the common characteristics and contributing factors <strong>of</strong> <strong>midair</strong> <strong>collisions</strong>;<br />
• assess whether there had been a change in the <strong>midair</strong> collision rate in Australia in<br />
recent years;<br />
• compare the characteristics and rate <strong>of</strong> <strong>midair</strong> <strong>collisions</strong> with those <strong>of</strong> other<br />
countries.<br />
1.2 Background information<br />
This study was initiated following the occurrence <strong>of</strong> three <strong>midair</strong> <strong>collisions</strong> in<br />
Australia during 2002:<br />
• A non-fatal collision between a Cessna 172 and an ultralight on final approach at<br />
Jandakot airport (22 February 2002).<br />
• A fatal collision between a Piper PA-28 and a Socata TB-9 on final approach at<br />
Bankstown airport (5 May 2002).<br />
• A fatal collision between two Cessna 172 aircraft on final approach at Moorabbin<br />
airport (29 July 2002).<br />
All three <strong>collisions</strong> occurred at major <strong>general</strong> <strong>aviation</strong> airports, although only one<br />
occurred during the hours when the air traffic control tower was open.<br />
2. Method<br />
Midair <strong>collisions</strong> <strong>involving</strong> registered civil aircraft in Australia between 1969 and<br />
2003 were identified using the ATSB <strong>aviation</strong> occurrence database. 1 Information on<br />
each collision was then obtained from the occurrence database and investigation<br />
reports. A review <strong>of</strong> the Survey <strong>of</strong> Accidents to Australian Civil Aircraft 2 for each year<br />
identified collision accidents between 1961 and 1968. Characteristics and contributing<br />
factors for each collision were identified by reviewing the relevant occurrence report<br />
and other database information.<br />
The review focused on operations <strong>involving</strong> <strong>general</strong> <strong>aviation</strong> aircraft (that is,<br />
registered powered aircraft such as aeroplanes and helicopters conducting private,<br />
aerial work or charter operations). There were no <strong>midair</strong> <strong>collisions</strong> <strong>involving</strong> regular<br />
public transport (RPT) operations in Australia from 1961 to 2003.<br />
1 The ATSB <strong>aviation</strong> occurrence database contains information on accidents and incidents only as far back as 1969.<br />
2 The Survey <strong>of</strong> Accidents to Australian Civil Aircraft was produced by during the years 1961-1991.<br />
5
Midair collision rates in Australia were calculated using flight hours. Data on flight<br />
hours for 1961 to 2002 were obtained from Bureau <strong>of</strong> Transport and Regional<br />
Economics publications. Hours flown for 2003 were estimated based on hours for<br />
2002. Only <strong>midair</strong> collision accidents 3 were included in the calculation <strong>of</strong> the collision<br />
rates to enable comparisons with the US.<br />
Comparisons <strong>of</strong> <strong>midair</strong> collision rates were made between Australia and the US.<br />
Details on the number <strong>of</strong> <strong>midair</strong> <strong>collisions</strong> accidents <strong>involving</strong> <strong>general</strong> <strong>aviation</strong><br />
aircraft 4 in the US were provided by the National Transportation <strong>Safe</strong>ty Board<br />
(NTSB). Basic details <strong>of</strong> these accidents were obtained by reviewing the NTSB<br />
accident database records for these accidents available through the NTSB website.<br />
Flight hours data in the US were obtained from the NTSB (news release SB-03-08, 18<br />
March 2003 and similar previous publications). To obtain similar figures for<br />
Australia, US <strong>general</strong> <strong>aviation</strong> and ‘on-demand air taxi’ flight hours were summed,<br />
and flight hours for gliders and lighter than air aircraft were then subtracted (these<br />
hours were obtained from the Federal Aviation Administration publication General<br />
Aviation and Air Taxi Activity Survey CY2001, and similar previous publications).<br />
Flight hours for 2003 were estimated using the figures for 2002.<br />
Other details on the characteristics and contributing factors <strong>of</strong> <strong>midair</strong> <strong>collisions</strong> in the<br />
US and other countries were obtained by reviewing previous publications.<br />
Because <strong>midair</strong> <strong>collisions</strong> are statistically rare events, statistical tests <strong>of</strong> the difference<br />
in <strong>midair</strong> collision rate between time periods or countries were based on the Poisson<br />
distribution. Consistent with common convention, statistical significance was defined<br />
as the probability <strong>of</strong> the results occurring due to chance being less than 5%.<br />
3. Characteristics <strong>of</strong> Australian <strong>midair</strong> <strong>collisions</strong><br />
3.1 Number <strong>of</strong> <strong>collisions</strong><br />
The review identified 37 <strong>midair</strong> <strong>collisions</strong> <strong>involving</strong> <strong>general</strong> <strong>aviation</strong> aircraft in<br />
Australia during the 1961-2003 period. 5 Appendix A provides basic details on the 37<br />
<strong>midair</strong> <strong>collisions</strong>.<br />
Most (34) <strong>of</strong> the <strong>collisions</strong> were accidents rather than incidents. Table 1 provides<br />
details <strong>of</strong> the types <strong>of</strong> aircraft involved. Most <strong>of</strong> the <strong>collisions</strong> were between two<br />
aeroplanes. 6 Of the 65 aeroplanes involved, 60 were small single-engine aeroplanes,<br />
and the other five were twin piston-engine aircraft. The other nine aircraft involved in<br />
the <strong>collisions</strong> included one helicopter, seven gliders and one ultralight.<br />
3 Accidents are events that result in more than minor damage or minor injury, whereas incidents can have minor or no damage or<br />
injury. A small percentage <strong>of</strong> <strong>midair</strong> <strong>collisions</strong> are not accidents.<br />
4 In the US, charter operations are known as ‘aerial taxi’ operations and are not considered to be <strong>general</strong> <strong>aviation</strong>. To keep<br />
consistency with the review <strong>of</strong> Australian accidents, aerial taxi operations were considered to be <strong>general</strong> <strong>aviation</strong> operations.<br />
5 Two <strong>collisions</strong> <strong>involving</strong> Australian registered aircraft, which occurred overseas, were also identified. One occurred in New<br />
Caledonia in 1971, and the other in New Zealand in 1999. Both involved aircraft deliberately flying close to each other, and<br />
neither resulted in fatalities.<br />
6 The term ‘aeroplane’ is used in this report to mean a registered fixed-wing aircraft.<br />
6
Only one collision accident was identified during the period 1961-1968 (Moorabbin,<br />
1968). The review was not able to identify whether or not there were any collision<br />
incidents between 1961 and 1968. Given that the vast majority <strong>of</strong> <strong>midair</strong> <strong>collisions</strong><br />
after 1968 were accidents, it was considered unlikely that there were any collision<br />
incidents during the period 1961-1968.<br />
In addition to the <strong>general</strong> <strong>aviation</strong> <strong>collisions</strong>, there were 26 <strong>collisions</strong> between<br />
registered sports <strong>aviation</strong> aircraft, most <strong>of</strong> them <strong>involving</strong> gliders (see Table 1).<br />
Table 1: Number <strong>of</strong> <strong>midair</strong> <strong>collisions</strong> in Australia between different types <strong>of</strong> aircraft<br />
between 1961 and 2003 (fatal accidents, non-fatal accidents, and incidents in brackets)<br />
Aircraft types 1961-70 1971-80 1981-90 1991-03 Total<br />
General <strong>aviation</strong><br />
Aeroplane-aeroplane 3 (0,3,0) 11 (3,7,1) 7 (4,2,1) 7 (4,2,1) 28 (11,14,3)<br />
Aeroplane-helicopter 1 (1,0,0) 0 0 0 1 (1,0,0)<br />
Aeroplane-ultralight 0 0 0 1 (0,1,0) 1 (0,1,0)<br />
Aeroplane-glider 0 1 (1,0,0) 2 (2,0,0) 4 (4,0,0) 7 (7,0,0)<br />
Total 4 (1,3,0) 12 (4,7,1) 9 (6,2,1) 12 (8,3,1) 37 (19,15,3)<br />
Sports <strong>aviation</strong><br />
Glider – glider 1 (1,0,0) 4 (1,2,1) 12 (2,7,3) 5 (3,1,1) 22 (7,10,5)<br />
Balloon – balloon 0 0 2 (1,0,1) 2 (0,0,2) 4 (1,0,3)<br />
3.2 Level <strong>of</strong> injury and damage<br />
Nineteen <strong>of</strong> the accidents resulted in fatalities. For six <strong>of</strong> the accidents, there were<br />
fatalities from both aircraft. Overall there were 46 fatalities, with 28 occurring in<br />
aeroplane-aeroplane <strong>collisions</strong>, five <strong>involving</strong> aeroplane-helicopter <strong>collisions</strong>, and 13<br />
<strong>involving</strong> aeroplane-glider <strong>collisions</strong> (including 10 from the aeroplanes). This equated<br />
to 1.2 fatalities per collision or 1.4 fatalities per collision accident. No one on the<br />
ground was fatally injured as a result <strong>of</strong> any <strong>of</strong> the <strong>collisions</strong>.<br />
Of the 74 aircraft involved, 33 were destroyed. These included 27 aeroplanes, one<br />
helicopter, one ultralight and four gliders. Twenty <strong>of</strong> the aeroplanes were destroyed in<br />
aeroplane-aeroplane <strong>collisions</strong>, six in aeroplane-glider <strong>collisions</strong>, and one in an<br />
aeroplane-helicopter collision.<br />
3.3 Location and type <strong>of</strong> operation<br />
Table 2 presents basic data on the <strong>general</strong> location <strong>of</strong> the 37 <strong>collisions</strong>. Most (24) <strong>of</strong><br />
the <strong>collisions</strong> occurred in the circuit area (that is, at least one <strong>of</strong> the aircraft was flying<br />
in the circuit pattern for landing or departure). These included 20 aeroplane-aeroplane<br />
<strong>collisions</strong>, one aeroplane-ultralight collision, and three aeroplane-glider <strong>collisions</strong>.<br />
7
Table 2: General location <strong>of</strong> <strong>collisions</strong> <strong>involving</strong> at least one registered powered aircraft<br />
in Australia between 1961 and 2003 (fatal accidents, non-fatal accidents, and incidents<br />
in brackets)<br />
Location/type 1961-70 1971-80 1981-90 1991-03 Total<br />
Circuit area 3 (0,3,0) 8 (3,4,1) 4 (3,1,0) 9 (6,2,1) 24 (12,10,2)<br />
Near circuit area 1 (1,0,0) 1 (1,0,0) 1 (1,0,0) 2 (2,0,0) 5 (5,0,0)<br />
Enroute/airwork 0 1 (0,1,0) 1 (1,0,0) 0 2 (1,1,0)<br />
Deliberately close 0 2 (0,2,0) 3 (1,1,1) 1 (0,1,0) 6 (1,4,1)<br />
Total 4 (1,3,0) 12 (4,7,1) 9 (6,2,1) 12 (8,3,1) 37 (19,15,3)<br />
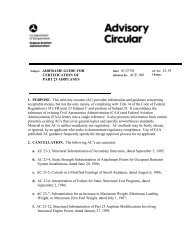
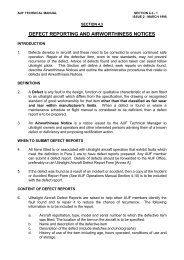
Eleven <strong>of</strong> the <strong>collisions</strong> occurred when both aircraft were on final approach, two<br />
occurred during the base-to-final turn, and one occurred on the turn to base. The<br />
collision at Moorabbin in 1968 occurred either on the base leg or the final approach.<br />
Six <strong>collisions</strong> occurred on the downwind leg (one with an aircraft departing) and two<br />
occurred on the crosswind leg (one with an aircraft departing). One collision involved<br />
two aircraft on initial climb. Figure 1 presents a diagrammatic representation <strong>of</strong> the<br />
location <strong>of</strong> <strong>collisions</strong> in the circuit area. The dots indicate in which leg <strong>of</strong> the circuit<br />
the <strong>collisions</strong> occurred rather than the specific location within each leg.<br />
Figure 1: Diagrammatic representation <strong>of</strong> positions <strong>of</strong> <strong>midair</strong> <strong>collisions</strong> in the circuit<br />
area<br />
The diagram does not discriminate between left and right circuit patterns.<br />
8
There were also five <strong>collisions</strong> that occurred near the circuit area (that is, within 5 NM<br />
<strong>of</strong> an airport and with at least one aircraft arriving at, or departing from, that airport).<br />
These included one aeroplane-aeroplane collision at 1,500 ft with both aircraft on<br />
departure, one aeroplane-helicopter collision at about 1,500-2,000 ft with both aircraft<br />
on arrival, and three aeroplane-glider <strong>collisions</strong> at less than 2,000 ft with the<br />
aeroplane climbing.<br />
Of the 20 aeroplane-aeroplane <strong>collisions</strong> that occurred in or near the circuit area, 25<br />
aeroplanes were on training flights, 12 were on private flights, two were on passenger<br />
charter flights, and one was on an aerial work flight. At least 21 <strong>of</strong> the aeroplanes<br />
were being used for circuit training or practice. The aeroplane-helicopter collision<br />
involved two aircraft on aerial work flights, and the aeroplane-ultralight collision<br />
involved two aircraft on private flights. The seven aeroplane-glider <strong>collisions</strong><br />
involved five aeroplanes being used as glider tugs, although only one was actually<br />
towing a glider at or just prior to the accident. The other two aeroplanes were engaged<br />
in private and aerial work operations.<br />
Fifteen <strong>of</strong> the <strong>collisions</strong> in or near the circuit area occurred at one <strong>of</strong> the five major<br />
<strong>general</strong> <strong>aviation</strong> airports; that is, Archerfield, Bankstown, Jandakot, Parafield or<br />
Moorabbin. Thirteen <strong>of</strong> these <strong>collisions</strong> occurred during tower operating hours 7 ,<br />
although in one <strong>of</strong> these <strong>collisions</strong> neither pilot had yet contacted the tower<br />
(Moorabbin, 1970). Of the other two <strong>collisions</strong>, one (Jandakot, 2002) occurred just<br />
after the tower controllers had handed over to an air ground operator. The other<br />
collision (Moorabbin, 2002) occurred at night when the control zone was classified as<br />
a mandatory broadcast zone (MBZ). No other <strong>collisions</strong> have occurred in MBZs in<br />
Australia, which commenced in 1991.<br />
Most (10) <strong>of</strong> the 15 <strong>collisions</strong> at the major <strong>general</strong> <strong>aviation</strong> airports occurred prior to<br />
the introduction <strong>of</strong> General Aviation Aerodrome Procedures (GAAP) during tower<br />
hours in 1980. 8 The major change to operations at these airports in 1980 was the<br />
introduction <strong>of</strong> simultaneous contra-rotating circuit operations onto parallel runways<br />
(contra-circuits) at those airports with parallel runways. The previous procedures<br />
(known as a secondary control zone) involved all aircraft flying circuits in the same<br />
direction on the same side <strong>of</strong> the runways. Due to the high aircraft movement rates,<br />
tower controllers were only required to provide a limited service at secondary/GAAP<br />
airports, with aircraft separation being primarily a pilot responsibility. A review <strong>of</strong> the<br />
10 <strong>collisions</strong> that occurred prior to 1980 found that many <strong>of</strong> them were unlikely to<br />
have occurred if contra-circuit operations to parallel runways had been in use.<br />
Only one <strong>of</strong> the 37 <strong>collisions</strong> occurred in controlled airspace where air traffic services<br />
were providing a full control service. This collision occurred in the Coolangatta<br />
primary control zone in May 1988.<br />
There were six <strong>collisions</strong> <strong>involving</strong> pilots deliberately flying close to another aircraft.<br />
All were aeroplane-aeroplane <strong>collisions</strong>, and four involved formation flying activities.<br />
7 Due to the high movement rates and the types <strong>of</strong> operations at these airports during tower hours, tower controllers were only<br />
required to provide a limited service. Aircraft separation was primarily a pilot responsibility.<br />
8 GAAP commenced at Parafield in 1978 and at the other five airports during 1980. The level <strong>of</strong> air traffic control service was<br />
similar both before and after the introduction <strong>of</strong> GAAP.<br />
9
Seven <strong>of</strong> the aircraft were operating in the private category, two in the aerial work<br />
category, and three in the charter category. 9<br />
Only two other <strong>collisions</strong> occurred away from the circuit area. One involved two<br />
aeroplanes on private sightseeing flights (at 1,500 ft), and the other involved two<br />
aerial agricultural aeroplanes about to commence swathe runs (at approximately 50<br />
ft).<br />
It is not surprising that most <strong>of</strong> the <strong>collisions</strong> occurred in the circuit area, as this is<br />
<strong>general</strong>ly where the traffic density is the highest. Of particular note is that at least 11<br />
<strong>of</strong> the <strong>collisions</strong> in the circuit area occurred on final approach, where there is<br />
relatively little variation in the position <strong>of</strong> aircraft.<br />
3.4 Other characteristics and contributing factors<br />
The 30 <strong>midair</strong> <strong>collisions</strong> since 1969 not <strong>involving</strong> ‘deliberately close’ activities were<br />
reviewed to identify common characteristics and contributing factors. The 1968<br />
collision at Moorabbin could not be included due to a lack <strong>of</strong> information. This<br />
review noted that there was a wide variety <strong>of</strong> contributing factors in the <strong>collisions</strong>, but<br />
there were no dominant factors. The circumstances <strong>of</strong> the majority <strong>of</strong> the <strong>collisions</strong><br />
were consistent with the inherent difficulties in sighting aircraft in time to avoid a<br />
collision. 10 More specifically, the review noted the following:<br />
• All <strong>of</strong> the <strong>collisions</strong> occurred during good weather conditions, with visibility<br />
being 10 km or more (when recorded). There were no reports that problems with<br />
visibility contributed to any <strong>of</strong> the <strong>collisions</strong>. Only one <strong>of</strong> the <strong>collisions</strong> occurred<br />
at night (Moorabbin, 2002). Sunglare was cited as a possible factor in four <strong>of</strong> the<br />
<strong>collisions</strong>.<br />
• Most (18) <strong>of</strong> the <strong>collisions</strong> involved one aircraft colliding with another from<br />
behind, or both aircraft converging from a similar direction (less than 30 degrees<br />
difference in heading), and only six <strong>of</strong> these <strong>collisions</strong> resulted in fatalities.<br />
Twelve <strong>of</strong> these <strong>collisions</strong> occurred at a height <strong>of</strong> 250 ft or less above the ground,<br />
with only three resulting in fatalities.<br />
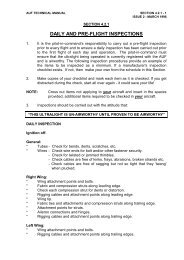
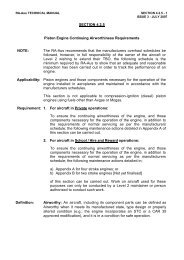
Of the 12 <strong>collisions</strong> with collision angles 30 degrees or greater, 11 resulted in<br />
fatalities. 11 All <strong>of</strong> these <strong>collisions</strong> occurred at heights greater than 250 ft. Figure 2<br />
provides a diagrammatic representation <strong>of</strong> the collision angles involved in the<br />
<strong>midair</strong> <strong>collisions</strong>.<br />
• At least eight <strong>of</strong> the aeroplane-aeroplane <strong>collisions</strong> involved pilots conducting<br />
different sized circuits, but none <strong>of</strong> the pilots flew paths that were considered to be<br />
contrary to procedures. Two <strong>of</strong> the aeroplane-glider <strong>collisions</strong> involved glider<br />
pilots conducting unusual circuit patterns, with one <strong>of</strong> them entering the circuit<br />
from the wrong direction. The Bankstown collision in May 2002 was the only<br />
collision <strong>involving</strong> contra-circuit operations to parallel runways.<br />
9 Two <strong>of</strong> these were Pitts S2A aircraft involved in a simulated World War One air combat scenario (near Bankstown, 2003).<br />
10 The difficulties in detecting aircraft are reviewed in the Bureau <strong>of</strong> Air <strong>Safe</strong>ty Investigation (BASI) 1991 research report<br />
Limitations <strong>of</strong> the See-and-Avoid Principle. BASI became part <strong>of</strong> the newly formed Australian Transport <strong>Safe</strong>ty Bureau (ATSB)<br />
on 1 July 1999.<br />
11 One <strong>of</strong> the ‘deliberately close’ <strong>collisions</strong> involved a difference in headings <strong>of</strong> 30 degrees, and this collision also resulted in a<br />
fatality.<br />
10
• A pilot not using his radio to communicate was cited as a possible contributing<br />
factor in one <strong>of</strong> the aeroplane-aeroplane <strong>collisions</strong> at a non-towered aerodrome,<br />
with the pilot not making a base broadcast due to congestion on the radio<br />
frequency at the time. In the majority <strong>of</strong> the other <strong>collisions</strong>, there was evidence to<br />
suggest that pilots had made the appropriate radio broadcasts. In at least six <strong>of</strong> the<br />
aeroplane-aeroplane <strong>collisions</strong>, one or both <strong>of</strong> the pilots did not hear a radio<br />
broadcast made by the other pilot. Both pilots were not using radios in three <strong>of</strong> the<br />
aeroplane-glider <strong>collisions</strong>, and the glider pilot did not make appropriate<br />
broadcasts in another two <strong>of</strong> the <strong>collisions</strong>. In another aeroplane-glider collision,<br />
the aeroplane pilot did not broadcast on the glider frequency. 12<br />
• In at least six <strong>of</strong> the <strong>collisions</strong>, pilots were provided with and were aware <strong>of</strong> traffic<br />
information, but it was at least moderately likely that the pilot identified the wrong<br />
aircraft.<br />
• Actions by air traffic control personnel were directly involved in the <strong>midair</strong><br />
collision in the Coolangatta control zone in May 1988. Controllers not providing<br />
adequate traffic information probably also contributed to at least three <strong>of</strong> the<br />
<strong>collisions</strong> at the major <strong>general</strong> <strong>aviation</strong> airports.<br />
• High pilot workload or distractions were cited as a possible factor in at least three<br />
<strong>of</strong> the <strong>collisions</strong>. It is also likely that, in many <strong>of</strong> the other <strong>collisions</strong>, workload in<br />
the circuit area reduced the time available for searching for unknown traffic.<br />
• Cockpit visibility restrictions would have reduced the ability <strong>of</strong> at least one <strong>of</strong> the<br />
pilots to see the other aircraft during some <strong>of</strong> the later stages for many <strong>of</strong> the<br />
<strong>collisions</strong>. For example, on final approach there are usually significant cockpit<br />
visibility restrictions on one or both pilots seeing the other aircraft.<br />
Figure 2: Diagrammatic representation <strong>of</strong> collision angles involved in <strong>collisions</strong> not<br />
<strong>involving</strong> deliberately close flying activities<br />
The diagram does not include <strong>collisions</strong> with gliders, or <strong>collisions</strong> where aircraft were flying<br />
deliberately close.<br />
12 The then Bureau <strong>of</strong> Air <strong>Safe</strong>ty Investigation (BASI) has made recommendations regarding the use <strong>of</strong> radios by gliding<br />
operations. BASI was incorporated into the new Australian Transport <strong>Safe</strong>ty Bureau from July 1999.<br />
11
3.5 Australian <strong>midair</strong> collision rates<br />
Table 3 presents accident statistics for <strong>midair</strong> collision accidents <strong>involving</strong> <strong>general</strong><br />
<strong>aviation</strong> aircraft in Australia over the period 1961 to 2003. Overall, the number <strong>of</strong><br />
events and hours in the 1961-1970 period was considered too low for meaningful<br />
analysis, so the data for this period were combined with the 1971-1980 period in<br />
Table 3. 13<br />
Table 3: Midair collision accident rates for Australia for <strong>general</strong> <strong>aviation</strong> operations<br />
1961-1980 1981-1990 1991-2003<br />
Hours per year (100,000s) 10.20 16.44 17.49<br />
Total hours flown in the period<br />
204.0 164.4 227.37<br />
(100,000s)<br />
Midair collision accidents 15 8 11<br />
Midair collision accidents per 100,000 0.074 0.049 0.048<br />
hours<br />
Number <strong>of</strong> <strong>general</strong> <strong>aviation</strong> aircraft<br />
29 14 17<br />
involved<br />
Hours per collision for <strong>general</strong> <strong>aviation</strong> 700,000 1,170,000 1,340,000<br />
aircraft<br />
Fatal <strong>midair</strong> collision accidents 5 6 8<br />
Fatal <strong>midair</strong> collision accidents per<br />
100,000 hours<br />
0.025 0.036 0.035<br />
The overall <strong>midair</strong> collision accident rate was higher in the period 1961-1980 (0.074<br />
per 100,000 flight hours) compared with the subsequent period 1981-2003 (0.048 per<br />
100,000 flight hours), but the difference was not statistically significant. 14<br />
To get a better assessment <strong>of</strong> the risk level for <strong>general</strong> <strong>aviation</strong> operations, the review<br />
also examined the number <strong>of</strong> hours flown per collision for <strong>general</strong> <strong>aviation</strong> aircraft<br />
(that is, the number <strong>of</strong> hours flown divided by the number <strong>of</strong> <strong>general</strong> <strong>aviation</strong> aircraft<br />
involved in collision accidents). The hours flown per collision was lower (meaning<br />
more risk) in the period 1961-1980 (700,000 hours) compared with the subsequent<br />
period 1981-2003 (1,260,000 hours), and this difference was statistically significant. 15<br />
This decrease in risk may be associated with a decrease in the rate <strong>of</strong> <strong>collisions</strong> at the<br />
major <strong>general</strong> <strong>aviation</strong> airports following the introduction <strong>of</strong> GAAP.<br />
Midair <strong>collisions</strong> accounted for 0.4 per cent <strong>of</strong> all accidents <strong>involving</strong> registered<br />
powered aircraft in Australia during 1969-2003 (0.4 per cent in the period 1981-<br />
2003). Midair <strong>collisions</strong> also accounted for 2.7 per cent <strong>of</strong> all fatal aircraft accidents<br />
<strong>involving</strong> such aircraft in Australia during 1969-2003 (2.9 per cent in the period 1981-<br />
2003).<br />
13 Hours flown steadily increased from about 370,000 hours in 1961 to about 1,000,000 hours in 1967, and then remained at that<br />
level until about 1972 before starting to increase again.<br />
14 Poisson analysis: rate ratio = 1.52, probability = 0.2, 95 % confidence interval 0.77 to 2.98.<br />
15 For the statistical tests, rates were based on number <strong>of</strong> <strong>general</strong> <strong>aviation</strong> aircraft involved per 100,000 flight hours. Poisson<br />
analysis: rate ratio = 1.80, probability = 0.02, 95 % confidence interval 1.08 to 2.98.<br />
12
The proportion <strong>of</strong> <strong>midair</strong> collision accidents that resulted in fatalities was lower in the<br />
period 1961-1980 (33 per cent) than in the period 1981-2003 (74 per cent). 16 Most <strong>of</strong><br />
the <strong>collisions</strong> at or below 250 ft above the ground occurred before 1981 (eight<br />
<strong>collisions</strong>, two with fatalities), and many <strong>of</strong> them (five <strong>collisions</strong>, one with fatalities)<br />
occurred at the major <strong>general</strong> <strong>aviation</strong> airports before the implementation <strong>of</strong> GAAP.<br />
In addition, there was an increase in aeroplane-glider <strong>collisions</strong> after 1980. All <strong>of</strong> the<br />
aeroplane-glider <strong>collisions</strong> were fatal, and five (four after 1980) <strong>of</strong> them involved a<br />
difference in headings <strong>of</strong> 30 degrees or more.<br />
Most <strong>of</strong> the <strong>midair</strong> collision accidents involved private, business or training<br />
operations. The accident rate for these operations was 0.11 and 0.08 per 100,000<br />
hours for the 1961-1980 and 1981-2003 periods respectively. The hours flown per<br />
collision for private, business and training operations was 560,000 for 1961 to 1980<br />
and 770,000 for 1981 to 2003.<br />
For the period 1981-2003, there were 19 collision accidents <strong>involving</strong> gliders. The<br />
rate <strong>of</strong> accidents was 1.11 per 100,000 hours flown. 17 The number <strong>of</strong> hours flown per<br />
collision for gliders was 54,000 hours, which was 25 times lower than the rate for<br />
<strong>general</strong> <strong>aviation</strong> operations (1,350,000 hours per collision for the same period).<br />
4. Characteristics <strong>of</strong> <strong>midair</strong> <strong>collisions</strong> in other countries<br />
4.1 Midair <strong>collisions</strong> in the United States (US)<br />
Table 4 presents <strong>midair</strong> collision accident statistics for <strong>general</strong> <strong>aviation</strong> in the US over<br />
the period 1981-2003. Only <strong>general</strong> <strong>aviation</strong> flight hours were considered as there<br />
were only eight RPT aircraft involved in the <strong>collisions</strong> (one high capacity), with only<br />
one being involved in a collision in the period 1991-2003. There were no <strong>collisions</strong><br />
<strong>involving</strong> two RPT aircraft. There were 11 <strong>collisions</strong> between a <strong>general</strong> <strong>aviation</strong><br />
aircraft and a sports <strong>aviation</strong> aircraft, and 15 <strong>collisions</strong> between a <strong>general</strong> <strong>aviation</strong><br />
aircraft and a military aircraft.<br />
Table 4: Midair collision accident rates for the US for <strong>general</strong> <strong>aviation</strong> operations<br />
1981-1990 1991-2003<br />
Hours per year (100,000s) 313.42 285.26<br />
Total hours flown in the period (100,000s) 3134.2 3708.4<br />
Midair collision accidents 210 174<br />
Midair collision accidents per 100,000 hours 0.067 0.047<br />
Number <strong>of</strong> <strong>general</strong> <strong>aviation</strong> aircraft involved 402 331<br />
Hours per collision for <strong>general</strong> <strong>aviation</strong> 780,000 1,120,000<br />
aircraft<br />
Fatal <strong>midair</strong> collision accidents 122 103<br />
Fatal <strong>midair</strong> collision accidents per 100,000<br />
hours<br />
0.040 0.028<br />
16 Fisher exact probability test, p = 0.01.<br />
17 Hours flown data for gliders was only available for 1981 to 1998. Data for the other years were estimated based on data for<br />
adjacent years.<br />
13
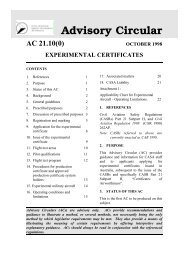
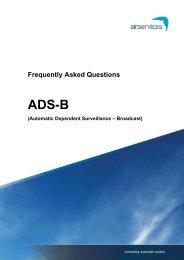
Figure 3 shows the rate <strong>of</strong> <strong>midair</strong> collision accidents per 100,000 flight hours in the<br />
US for the period 1981-2003. The rate appears to have decreased over that period. A<br />
comparison <strong>of</strong> the rate between the period 1981-1990 and 1991-2003 was statistically<br />
significant. 18 The reasons for the decrease in <strong>midair</strong> collision rate <strong>involving</strong> <strong>general</strong><br />
<strong>aviation</strong> aircraft are not known.<br />
Figure 3: Rate <strong>of</strong> <strong>midair</strong> collision accidents for the US per 100,000 flying hours for the<br />
period 1981-2003<br />
Rate per 100,000 hours<br />
0.100<br />
0.080<br />
0.060<br />
0.040<br />
0.020<br />
0.000<br />
1981<br />
1983<br />
1985<br />
1987<br />
1989<br />
1991<br />
1993<br />
1995<br />
1997<br />
1999<br />
2001<br />
2003<br />
Year<br />
In terms <strong>of</strong> <strong>general</strong> location <strong>of</strong> <strong>midair</strong> collision accidents in the US between 1981 and<br />
2003, 16 could not be classified due to a lack <strong>of</strong> information. Of the remaining 368<br />
accidents, 169 (46 per cent) occurred in the circuit area, and 56 (15 per cent) occurred<br />
near the circuit area. Of the remainder <strong>of</strong> the US <strong>collisions</strong>, 46 (13 per cent) involved<br />
‘deliberately close’ flying, and 97 (26 per cent) occurred away from the circuit area.<br />
These rates were essentially the same for the periods 1981-1990 and 1991-2003.<br />
Most <strong>of</strong> the accidents in the circuit area involved one or both aircraft on final<br />
approach. Fifty-nine (26 per cent) <strong>of</strong> the accidents in or near the circuit area occurred<br />
at airports with a tower. The accidents away from the circuit area involved a mix <strong>of</strong><br />
both aircraft in cruise flight, one or both aircraft climbing from or descending to an<br />
airport, or both aircraft involved in airwork activities.<br />
Of the 384 <strong>midair</strong> collision accidents in the US, 225 (59 per cent) involved fatalities.<br />
There was a total <strong>of</strong> 754 fatalities (or 2.0 fatalities per accident). If the accidents<br />
<strong>involving</strong> RPT aircraft are excluded, there were 220 fatal accidents and a total <strong>of</strong> 628<br />
fatalities (or 1.6 fatalities per accident).<br />
The US Federal Aviation Administration (FAA) recently conducted a similar review<br />
<strong>of</strong> <strong>midair</strong> <strong>collisions</strong> in the US for the period between 1983 and August 2000,<br />
<strong>involving</strong> a total <strong>of</strong> 329 <strong>collisions</strong>. 19 Findings <strong>of</strong> this review included the following:<br />
18 Difference in <strong>midair</strong> collision accidents per 100,000 flight hours, Poisson analysis: rate ratio = 1.43, probability < 0.001, 95 %<br />
confidence interval 1.17 to 1.75. Difference in rate <strong>of</strong> <strong>general</strong> <strong>aviation</strong> aircraft involved per 100,000 flight hours, Poisson<br />
analysis: rate ratio = 1.44, probability < 0.001, 95 % confidence interval 1.24 to 1.66.<br />
19 R. C. Mathews ‘Characteristics <strong>of</strong> U.S. Midairs’, FAAviation, May-June 2001.<br />
14
• All occurred in visual meteorological conditions. Only six occurred at night and<br />
four occurred at dusk. Bright sun was on the only commonly sighted factor related<br />
to weather.<br />
• About 88 per cent <strong>of</strong> pilots involved in <strong>midair</strong> <strong>collisions</strong> do not see the other<br />
aircraft in time to avoid a collision.<br />
• Most <strong>midair</strong> <strong>collisions</strong> involve low closing speeds, as one aircraft usually strikes<br />
the other from behind, above or from a quartering angle.<br />
• Most <strong>midair</strong> <strong>collisions</strong> occur near airports, especially airports without a control<br />
tower. Midair <strong>collisions</strong> at high altitudes are rare events.<br />
• A common factor in <strong>midair</strong> <strong>collisions</strong> was pilots using inappropriate entries into<br />
the circuit and failing to use radios at non-towered airports.<br />
• The 329 <strong>midair</strong> <strong>collisions</strong> indicate that see-and-avoid has inherent limitations as a<br />
tactic or strategy for avoiding <strong>midair</strong> <strong>collisions</strong>.<br />
Morris 20 also conducted a review <strong>of</strong> <strong>midair</strong> <strong>collisions</strong> in the US from 1991 to 2000.<br />
His review was based on 158 <strong>collisions</strong>. 21 Morris’s findings for the 158 <strong>collisions</strong><br />
included:<br />
• The sky condition was clear for 67 per cent <strong>of</strong> the <strong>collisions</strong> and broken/overcast<br />
for 33 per cent.<br />
• Seventy-six per cent were ‘airport involved’. Exactly what was meant by his term<br />
was not clear. Over the same period, the ATSB classified 60 per cent as occurring<br />
in or near the circuit area (that is, within 5 NM <strong>of</strong> the airport).<br />
• Fifty-nine per cent (92) were classified as occurring in the traffic pattern, with just<br />
under half <strong>of</strong> these occurring on final approach. 22<br />
• Of the 92 <strong>collisions</strong> classified as occurring in the traffic pattern, 27 per cent<br />
involved a failure to use the radio, 22 per cent involved a failure to use<br />
procedures, 18 per cent involved air traffic control errors and nine per cent<br />
involved sun glare.<br />
• In 88 per cent <strong>of</strong> the <strong>collisions</strong>, one or both aircraft were manoeuvring at the time<br />
<strong>of</strong> collision.<br />
• Most <strong>of</strong> the <strong>collisions</strong> in the traffic pattern involved the two aircraft colliding head<br />
to tail or at an acute angle. About half <strong>of</strong> the <strong>collisions</strong> away from the traffic<br />
pattern involved the two aircraft colliding head to tail or at an acute angle, with<br />
the other half occurring at an oblique angle or head to head.<br />
20 C. C. Morris, Current analysis <strong>of</strong> hazard factors in US civil <strong>aviation</strong> <strong>midair</strong> <strong>collisions</strong>, 1991-2000, paper presented at the<br />
Association for Public Policy Analysis and Management, November 2003.<br />
21 The ATSB review examined only 151 <strong>collisions</strong> for this period . The ATSB review excluded three <strong>collisions</strong> that were not<br />
accidents, two glider-glider <strong>collisions</strong> and two balloon-balloon <strong>collisions</strong>.<br />
22 The ATSB review classified 47 per cent (81) as occurring in the circuit. The reason for the different classifications was not<br />
clear, although Morris’s review probably had a broader definition <strong>of</strong> what constituted a traffic pattern. The ATSB review used<br />
the same criteria as it used for classifying the Australian occurrences.<br />
15
4.2 Midair <strong>collisions</strong> in other countries<br />
The Bureau d’Enquetes et d’Analyses pour la Securite de l’Aviation Civile conducted<br />
a review <strong>of</strong> <strong>midair</strong> <strong>collisions</strong> that occurred in French territory between 1989 and 1999<br />
and involved at least one civil aircraft. 23 The review excluded formation flights and<br />
glider-glider <strong>collisions</strong>. Results <strong>of</strong> the review provided included:<br />
• There were 17 <strong>collisions</strong>, which resulted in 42 fatalities and 27 aircraft destroyed.<br />
Air transport aircraft were involved in three <strong>collisions</strong>, and gliders were involved<br />
in four <strong>collisions</strong>.<br />
• All <strong>of</strong> the <strong>collisions</strong> occurred during daylight in visual meteorological conditions.<br />
In two cases, pilots reported poor visibility conditions, and in six cases one <strong>of</strong> the<br />
pilots had ‘the sun in his face’.<br />
• Seven <strong>of</strong> the <strong>collisions</strong> occurred near an aerodrome with aircraft in the circuit.<br />
Another eight <strong>collisions</strong> took place in areas where aircraft concentration was high,<br />
such as near an aerodrome, overhead a radio navigation device, or where there<br />
were a large number <strong>of</strong> gliders. Only two occurred during cruise.<br />
• Twelve <strong>collisions</strong> occurred in uncontrolled airspace and the remaining five in<br />
controlled airspace, although communication was not compulsory for three <strong>of</strong><br />
these situations. Non-use <strong>of</strong> radios or other communication problems was an issue<br />
with several <strong>of</strong> the <strong>collisions</strong>. Only one <strong>of</strong> the aircraft did not have a radio.<br />
In a recent accident investigation report, 24 the Transportation <strong>Safe</strong>ty Board <strong>of</strong> Canada<br />
noted that in the 10 years prior to August 1999, there were 17 <strong>midair</strong> <strong>collisions</strong> in<br />
Canada. Of these, ‘8 involved some form <strong>of</strong> formation flight, 3 occurred in practice<br />
training areas, and 6 occurred in the vicinity <strong>of</strong> uncontrolled airports’. None occurred<br />
in a control zone where an advanced level <strong>of</strong> air traffic control was being provided.<br />
5. Comparison <strong>of</strong> collision rates between Australia and the US<br />
There were no <strong>midair</strong> <strong>collisions</strong> <strong>involving</strong> RPT aircraft in Australia during the period<br />
1961-2003. Consequently, it was not possible to compare collision risk between<br />
Australia and the US for RPT aircraft using actual <strong>collisions</strong>.<br />
Figure 4 shows a comparison <strong>of</strong> the <strong>midair</strong> collision accident rate per hours flown for<br />
<strong>general</strong> <strong>aviation</strong> aircraft in Australia and the US. The figure indicates that the US may<br />
have had a higher rate <strong>of</strong> <strong>collisions</strong> during the period 1981-1990, but the two<br />
countries had a similar rate during the period 1991-2003. Overall, the difference<br />
between the two countries for the period 1981-2003 (0.048 in Australia and 0.056 in<br />
US) was not statistically significant. 25<br />
Figure 5 shows a comparison between Australia and the US in terms <strong>of</strong> the hours<br />
flown per collision for <strong>general</strong> <strong>aviation</strong> aircraft. Overall, for the period 1981-2003, the<br />
US had a lower number <strong>of</strong> hours flown per collision (930,000 hours) for <strong>general</strong><br />
<strong>aviation</strong> aircraft relative to Australia (1,260,000 hours), indicating that <strong>general</strong><br />
23 Bureau d’Enquetes et d’Analyses pour la Securite de l’Aviation Civile, <strong>Safe</strong>ty Study, Mid-air <strong>collisions</strong> 1989-1999.<br />
24 Transportation <strong>Safe</strong>ty Board <strong>of</strong> Canada, Accident Investigation Report A99P0108, Midair collision between Cessna 177RG<br />
Cardinal C-GWYY and Mooney M20C C-GASL, Penicton, British Columbia, 20 August 1999.<br />
25 Poisson analysis: rate ratio = 0.86, probability = 0.5, .95 % confidence interval 0.55 to 1.37.<br />
16
<strong>aviation</strong> in the US may have had a slightly higher risk for <strong>midair</strong> <strong>collisions</strong>. However,<br />
this difference was not statistically significant. 26<br />
Figure 4: Comparison <strong>of</strong> <strong>midair</strong> collision accident rate between Australia and the US for<br />
<strong>general</strong> <strong>aviation</strong><br />
GA Collision Accident Rate<br />
Collision accidents<br />
per 100,000 hrs<br />
0.08<br />
0.07<br />
0.06<br />
0.05<br />
0.04<br />
0.03<br />
0.02<br />
0.01<br />
0<br />
61-80 81-90 91-03<br />
Australia<br />
USA<br />
Figure 5: Comparison <strong>of</strong> flight hours per collision between Australia and the US for<br />
<strong>general</strong> <strong>aviation</strong> aircraft<br />
Hours per Collision in GA<br />
Hours per<br />
collision<br />
1,400,000<br />
1,200,000<br />
1,000,000<br />
800,000<br />
600,000<br />
400,000<br />
200,000<br />
0<br />
61-80 81-90 91-03<br />
Australia<br />
USA<br />
26 Poisson analysis: rate ratio = 0.74, probability = 0.1, 95 % confidence interval 0.52 to 1.06.<br />
17
Comparisons <strong>of</strong> <strong>midair</strong> collision rates between two countries or areas need to consider<br />
a range <strong>of</strong> factors, most importantly traffic density. The FAA has stated that <strong>collisions</strong><br />
between aircraft are best explained as a function <strong>of</strong> the square <strong>of</strong> the number <strong>of</strong><br />
aircraft movements. 27 In <strong>general</strong>, the traffic density is higher near airports than away<br />
from airports. Therefore, it would be more appropriate to consider whether there was<br />
a difference in the collision rates in or near the circuit area as well as away from the<br />
circuit area.<br />
Unfortunately, there were no figures available for the number <strong>of</strong> hours flown or<br />
number <strong>of</strong> movements in or near the circuit area versus away from the circuit area for<br />
either Australia or the US. Based on the assumption that the proportion <strong>of</strong> flying in or<br />
near the circuit area was the same in Australia and the US, it was found that:<br />
• Australia had a <strong>general</strong> <strong>aviation</strong> <strong>midair</strong> collision accident rate 1.1 times higher<br />
than that <strong>of</strong> the US in or near the circuit area during the period 1981-2003. This<br />
comparison excluded <strong>collisions</strong> <strong>involving</strong> aircraft deliberately flying close to each<br />
other. This difference was not statistically significant. 28<br />
• The US had a <strong>general</strong> <strong>aviation</strong> <strong>midair</strong> collision accident rate 5.8 times higher than<br />
that <strong>of</strong> Australia away from the circuit area during the period 1981-2003. This<br />
comparison excluded <strong>collisions</strong> <strong>involving</strong> aircraft deliberately flying close to each<br />
other. The test <strong>of</strong> the difference between the two countries was not significant. 29<br />
However, this test had a low level <strong>of</strong> power to detect differences in the rates as the<br />
Australian rate was based on only one event (Moreton Bay, 1988). The fact that<br />
only one event also occurred during the period 1961-1980 (Cecil Plains, 1980)<br />
suggests that the Australian rate may be reasonably reliable. There was a<br />
significant difference in the hours flown per collision <strong>involving</strong> <strong>general</strong> <strong>aviation</strong><br />
between the two countries, indicating that there was a higher collision risk in the<br />
US away from the circuit area relative to Australia. 30<br />
It would be reasonable to expect that the US had a higher rate <strong>of</strong> <strong>collisions</strong> per flight<br />
hour away from the circuit area as it is <strong>general</strong>ly accepted that it has a higher traffic<br />
density in this airspace relative to Australia. For example, the US had 17.5 times more<br />
<strong>general</strong> <strong>aviation</strong> flight hours than Australia during the period 1981-2003. However,<br />
quantifying the difference in traffic density is a complex issue and beyond the scope<br />
<strong>of</strong> this study. The extent <strong>of</strong> any difference in the average traffic density for <strong>general</strong><br />
<strong>aviation</strong> aircraft in or near the circuit area between the two countries was also beyond<br />
the scope <strong>of</strong> this review.<br />
27 FAA, Establishment and Discontinuance Criteria for Airport Traffic Control Towers, Report No. FAA-APO-90-7, August<br />
1990.<br />
28 Difference in <strong>midair</strong> collision accidents per 100,000 flight hours, Poisson analysis: rate ratio = 1.12, probability = 0.7, 95 %<br />
confidence interval 0.66 to 1.88. Difference in rate <strong>of</strong> <strong>general</strong> <strong>aviation</strong> aircraft involved per 100,000 flight hours, Poisson<br />
analysis: rate ratio = 0.89, probability = 0.6, 95 % confidence interval 0.58 to 1.35.<br />
29 Poisson analysis: rate ratio = 0.17, probability = 0.08, 95 % confidence interval 0.02 to 1.24.<br />
30 Poisson analysis: rate ratio = 0.19, probability < 0.05, 95 % confidence interval 0.05 to 0.76.<br />
18
Appendix A<br />
Location and basic details <strong>of</strong> <strong>midair</strong> <strong>collisions</strong> in Australia between 1961 and<br />
2003<br />
ATSB<br />
Occurrence<br />
Number<br />
Not<br />
assigned<br />
Date Location Description<br />
Note: type <strong>of</strong> operation, phase <strong>of</strong> flight and<br />
location <strong>of</strong> collision are shown in brackets.<br />
05/10/1968 Moorabbin Piper PA-28 (private, unknown, base or final)<br />
collided with Cessna 182 (training, unknown, base or<br />
final) from behind (height unknown). Non-fatal<br />
accident.<br />
196903388 06/07/1969 Parafield Piper PA-32 (private, departing, initial climb)<br />
collided with Victa Airtourer 100 (training, circuits,<br />
initial climb) from behind (250 ft). Non-fatal<br />
accident.<br />
197005075 08/07/1970 Jandakot Beech A23A (training, circuits, final) collided with<br />
Piper PA-24 (private, arriving, final) from behind<br />
(100 ft). Non-fatal accident.<br />
197002588 19/10/1970 Moorabbin Beech D50 (aerial work, arriving, near CTR<br />
boundary) collided with Bell 47 (aerial work,<br />
arriving, near CTR boundary) at 40 degree angle, 4<br />
NM from airport (1,500-2,000 ft). Fatal accident.<br />
197105134 13/02/1971 Jandakot Piper PA-28 (private, arriving, final) collided with<br />
Cessna 150 (training, circuits, final) from behind (10<br />
ft). Incident.<br />
197101235 14/06/1971 Bankstown Cessna 182 (charter, arriving, joining downwind)<br />
converged with Cessna 150 (private, circuits,<br />
downwind) (1,000 ft). Non-fatal accident.<br />
197302834 01/07/1973 Moorabbin Piper PA-28 (training, circuits, final) collided with<br />
Piper PA-28 (training, arriving, final) from behind<br />
(40 ft). Non-fatal accident.<br />
197401423 13/03/1974 Bankstown De Havilland DH104 (aerial work, departing,<br />
downwind) collided with Piper PA-31 (training,<br />
departing, downwind) at 45-60 degree angle above<br />
circuit area (1,500 ft). Fatal accident.<br />
197403114 23/03/1974 Ballarat Piper PA-28 (training, circuits, final) collided with<br />
Cessna 172 (training, circuits, downwind), at 40<br />
degree angle (200 ft) on final. Non-fatal accident.<br />
197501327 13/03/1975 Bankstown Piper PA-30 (charter, departing, turning crosswind)<br />
collided with Cessna 182 (training, circuits,<br />
crosswind) from behind (850 ft). Non-fatal accident.<br />
197201245 12/03/1972 Near<br />
Armidale<br />
CA28C collided with Cessna C172 (private, en-route,<br />
sightseeing) when flying deliberately close to warn <strong>of</strong><br />
turbulence without a radio (4,300 ft). Non-fatal<br />
accident.<br />
197604613 01/02/1976 Parafield Piper PA28 (training, circuits, final) collided with<br />
Cessna 172 (private, arriving, final) from behind<br />
(250 ft). Fatal accident.<br />
197801130 10/10/1978 Near<br />
Canberra<br />
Piper PA-28 (private, formation flight) collided with<br />
Piper PA-28 (private, formation flight). Deliberately<br />
close flying. Non-fatal accident.<br />
19
ATSB<br />
Occurrence<br />
Number<br />
Date Location Description<br />
Note: type <strong>of</strong> operation, phase <strong>of</strong> flight and<br />
location <strong>of</strong> collision are shown in brackets.<br />
197902791 08/06/1979 Warrnambool Cessna C150 (training, arriving, final) collided<br />
with Cessna A150 (training, circuits, final) when<br />
the A150 pulled up in front <strong>of</strong> the C150 (150 ft).<br />
Radio call missed because <strong>of</strong> radio traffic. Fatal<br />
accident<br />
198000027 04/05/1980 Cecil Plains Cessna A 188 (agricultural, en route) Collided with<br />
Cessna A188 (agricultural, en route) while<br />
transiting from a farm to an airfield (50ft). Nonfatal<br />
accident<br />
198002609 28/09/1980 Moorooduc Cessna C 172 (private, arriving, joining circuit<br />
downwind) collided with glider (joining circuit<br />
downwind) at 170 degrees. Fatal accident.<br />
198102970 02/17/1981 Near<br />
Cranbourne<br />
Cessna C152 (private, formation flight) collided<br />
with Cessna C152 (private, formation flight).<br />
Deliberately close flying. Incident.<br />
198601425 10/07/1986 Benalla Piper PA-25 (tug, arriving, joining circuit<br />
downwind) collided with glider (circuit, downwind)<br />
from above and behind (700 ft). Fatal accident<br />
198801381 16/01/1988 Near Portsea Pitts S2A (private, formation flight) collided with<br />
Pitts S2A (private, formation flight). Deliberately<br />
close flying. Fatal accident.<br />
198803454 24/04/1988 Archerfield<br />
airport<br />
Piper PA-28 (private, circuits, turning onto base)<br />
collided with Cessna 150 (training, circuits, turning<br />
onto base) from behind (1,000 ft). Fatal accident.<br />
198803460 20/05/1988 Coolangatta Cessna C 172 (training, circuits, downwind)<br />
collided with Piper PA-38 (training, circuits,<br />
conducting an orbit) at 90 degrees, (1,000 ft) in<br />
primary controlled airspace. Fatal accident.<br />
198803474 07/08/1988 Moreton Bay,<br />
enroute<br />
Piper PA-28 (scenic flight) collided with Piper PA-<br />
28 (scenic flight) in opposite direction turns at 20<br />
degrees (1,500 ft). Fatal accident<br />
198900238 29/05/1989 Jandakot Cessna 152 (training, circuits, base-to-final turn)<br />
collided with Cessna 152 (training, arriving for<br />
circuits, base-to-final turn) from behind (500 ft).<br />
Non-fatal accident.<br />
199003061 25/04/1990 Near<br />
Blacksmith<br />
Piper PA-31 (charter) collided with Cessna C210 in<br />
the same direction when attempting to scare the<br />
pilot. Non-fatal accident.<br />
199002021 02/11/1990 Tocumwal Beechcraft V35A (aerial work, departing, climbing)<br />
collided with glider (circling, thermalling) at 35<br />
degrees (1,700 ft). Fatal accident<br />
199100010 12/04/1991 Mudgee Piper PA-28 (training, solo navigational exercise,<br />
arriving) collided with Piper PA-28 (training, solo<br />
navigational exercise, departing the circuit) from<br />
behind (1,000ft). Fatal accident.<br />
199200011 08/02/1992 Tocumwal 8GCBC (Tug, circuit, final) collided with glider<br />
(close oblique base) converging at 5 degrees (300<br />
ft). Fatal accident.<br />
199201988 15/07/1992 Hoxton Park Piper PA-28 (training, solo circuits, short final)<br />
collided with Beechcraft C 23 (training, arriving,<br />
short final) in the same direction (10 ft). Incident.<br />
199202599 01/11/1992 Jondarayan Piper PA-25 (tug, just released aerotow) collided<br />
with glider (just released from aerotow),<br />
converging at 5 degrees (1,600 ft). Fatal accident.<br />
20
ATSB<br />
Occurrence<br />
Number<br />
Date Location Description<br />
Note: type <strong>of</strong> operation, phase <strong>of</strong> flight and<br />
location <strong>of</strong> collision are shown in brackets.<br />
199303898 24/11/1993 Benalla Piper PA-25 (tug, circuit, late downwind/early<br />
base) collided with glider (circuit, late<br />
downwind/early base) almost head on (750 ft).<br />
Fatal accident.<br />
199802022 06/06/0998 Hoxton Park Piper PA-28 (private, arriving, joining circuit<br />
crosswind) collided with Piper PA-38 (private,<br />
arriving, joining circuit crosswind) at 90 degrees<br />
(1,200 ft). Fatal accident.<br />
199900844 02/03/1999 Waikerie Piper PA-25 (tug, climbing with aerotow) collided<br />
with glider (en route) at 30 degrees (1,500 ft). Fatal<br />
accident.<br />
200004070 18/09/2000 Merredin Grob G-115 (training, circuits, short final) collided<br />
with Grob G-115 (training, circuits, short final) in<br />
the same direction (30 ft). Non-fatal accident.<br />
200200548 22/02/2002 Jandakot Cessna 172 (private, arriving, final) collided with<br />
ultralight (private, arriving, final) from behind (10<br />
ft). Tower closed. Non-fatal accident.<br />
200201846 05/05/2002 Bankstown Piper PA-28 (private, arriving, base-to-final turn)<br />
collided with Socata TB-9 (training, circuits, final)<br />
(450 ft). Fatal accident.<br />
200203449 29/07/2002 Moorabbin Cessna 172 (training, circuits, final) collided with<br />
Cessna 172 (training, circuits, final) from behind<br />
(30 ft). Tower closed. Fatal accident.<br />
200302183 10/05/2003 Warragamba Pitts S2A (charter, formation aerobatic flight)<br />
collided with Pitts S2A (charter, formation<br />
aerobatic flight). Deliberately close flying. Nonfatal<br />
accident.<br />
21
www.atsb.gov.au<br />
1800 621 372<br />
<strong>Review</strong> <strong>of</strong> Midair Collisions Involving General Aviation Aircraft in Australia<br />
between 1961 and 2003<br />
May 2004