A New Approach in Measuring Rainfall Interception by Urban Trees ...
A New Approach in Measuring Rainfall Interception by Urban Trees ...
A New Approach in Measuring Rainfall Interception by Urban Trees ...

You also want an ePaper? Increase the reach of your titles
YUMPU automatically turns print PDFs into web optimized ePapers that Google loves.
Asadian and Weiler<br />
still contributes to stemflow. In addition, the bark is<br />
ridged and ruffled where it absorbs greater amounts of<br />
water. The absorption of water <strong>by</strong> epiphytes and various<br />
moss species on branches and tree trunks also play a<br />
role <strong>in</strong> controll<strong>in</strong>g the stemflow. As a result we assumed<br />
the stemflow to be <strong>in</strong>significant, based on the results of<br />
previous research studies (Crockford and Richardson<br />
1990; Brooks et al. 2003; L<strong>in</strong>k et al. 2004; Llorens and<br />
Dom<strong>in</strong>go 2007).<br />
For this <strong>in</strong>vestigation we computed the total<br />
volume of throughfall captured underneath each tree for<br />
<strong>in</strong>dividual events <strong>by</strong> us<strong>in</strong>g the total number of tipp<strong>in</strong>gs<br />
and the obta<strong>in</strong>ed volume from calibration. To note, the<br />
difference between the surface areas of the PVC pipes<br />
and the ra<strong>in</strong> gauge (which is 4.2) was taken <strong>in</strong>to account.<br />
Canopy <strong>in</strong>terception was derived from the difference<br />
between the P G<br />
and p for <strong>in</strong>dividual events. The data for<br />
P G<br />
was obta<strong>in</strong>ed from the reference climate station on<br />
the rooftop of the District of North Vancouver; however,<br />
for comparison, Table 2 <strong>in</strong>cludes P G<br />
from a standard<br />
climate station <strong>in</strong> the District of North Vancouver, and<br />
a nonstandard ra<strong>in</strong> gauge on the rooftop of North<br />
Vancouver’s City Hall.<br />
Results<br />
The high spatial and temporal resolution of the throughfall<br />
data enabled us to determ<strong>in</strong>e canopy <strong>in</strong>terception losses<br />
for a wide range of trees (Xiao et al. 2000b; L<strong>in</strong>k et al.<br />
2004). The selected trees were differentiated <strong>by</strong> species,<br />
type, and health condition.<br />
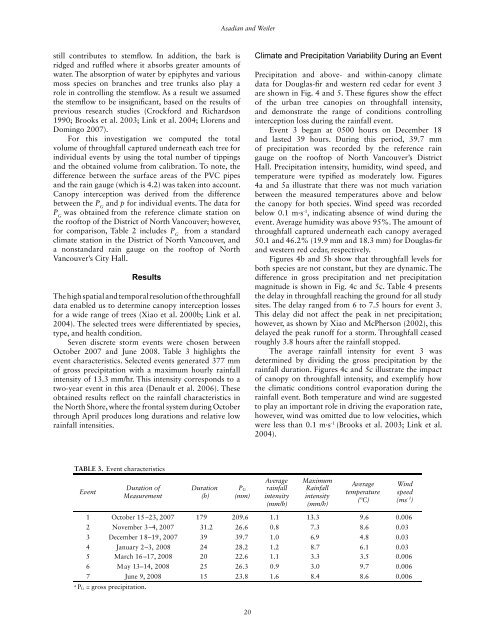
Seven discrete storm events were chosen between<br />
October 2007 and June 2008. Table 3 highlights the<br />
event characteristics. Selected events generated 377 mm<br />
of gross precipitation with a maximum hourly ra<strong>in</strong>fall<br />
<strong>in</strong>tensity of 13.3 mm/hr. This <strong>in</strong>tensity corresponds to a<br />
two-year event <strong>in</strong> this area (Denault et al. 2006). These<br />
obta<strong>in</strong>ed results reflect on the ra<strong>in</strong>fall characteristics <strong>in</strong><br />
the North Shore, where the frontal system dur<strong>in</strong>g October<br />
through April produces long durations and relative low<br />
ra<strong>in</strong>fall <strong>in</strong>tensities.<br />
Climate and Precipitation Variability Dur<strong>in</strong>g an Event<br />
Precipitation and above- and with<strong>in</strong>-canopy climate<br />
data for Douglas-fir and western red cedar for event 3<br />
are shown <strong>in</strong> Fig. 4 and 5. These figures show the effect<br />
of the urban tree canopies on throughfall <strong>in</strong>tensity,<br />
and demonstrate the range of conditions controll<strong>in</strong>g<br />
<strong>in</strong>terception loss dur<strong>in</strong>g the ra<strong>in</strong>fall event.<br />
Event 3 began at 0500 hours on December 18<br />
and lasted 39 hours. Dur<strong>in</strong>g this period, 39.7 mm<br />
of precipitation was recorded <strong>by</strong> the reference ra<strong>in</strong><br />
gauge on the rooftop of North Vancouver’s District<br />
Hall. Precipitation <strong>in</strong>tensity, humidity, w<strong>in</strong>d speed, and<br />
temperature were typified as moderately low. Figures<br />
4a and 5a illustrate that there was not much variation<br />
between the measured temperatures above and below<br />
the canopy for both species. W<strong>in</strong>d speed was recorded<br />
below 0.1 m·s -1 , <strong>in</strong>dicat<strong>in</strong>g absence of w<strong>in</strong>d dur<strong>in</strong>g the<br />
event. Average humidity was above 95%. The amount of<br />
throughfall captured underneath each canopy averaged<br />
50.1 and 46.2% (19.9 mm and 18.3 mm) for Douglas-fir<br />
and western red cedar, respectively.<br />
Figures 4b and 5b show that throughfall levels for<br />
both species are not constant, but they are dynamic. The<br />
difference <strong>in</strong> gross precipitation and net precipitation<br />
magnitude is shown <strong>in</strong> Fig. 4c and 5c. Table 4 presents<br />
the delay <strong>in</strong> throughfall reach<strong>in</strong>g the ground for all study<br />
sites. The delay ranged from 6 to 7.5 hours for event 3.<br />
This delay did not affect the peak <strong>in</strong> net precipitation;<br />
however, as shown <strong>by</strong> Xiao and McPherson (2002), this<br />
delayed the peak runoff for a storm. Throughfall ceased<br />
roughly 3.8 hours after the ra<strong>in</strong>fall stopped.<br />
The average ra<strong>in</strong>fall <strong>in</strong>tensity for event 3 was<br />
determ<strong>in</strong>ed <strong>by</strong> divid<strong>in</strong>g the gross precipitation <strong>by</strong> the<br />
ra<strong>in</strong>fall duration. Figures 4c and 5c illustrate the impact<br />
of canopy on throughfall <strong>in</strong>tensity, and exemplify how<br />
the climatic conditions control evaporation dur<strong>in</strong>g the<br />
ra<strong>in</strong>fall event. Both temperature and w<strong>in</strong>d are suggested<br />
to play an important role <strong>in</strong> driv<strong>in</strong>g the evaporation rate,<br />
however, w<strong>in</strong>d was omitted due to low velocities, which<br />
were less than 0.1 m·s -1 (Brooks et al. 2003; L<strong>in</strong>k et al.<br />
2004).<br />
20