


Create successful ePaper yourself
Turn your PDF publications into a flip-book with our unique Google optimized e-Paper software.
Digital inclusion and mobile sector taxation<br />
3.2 Total tax and fee payments from mobile-specific taxation<br />
Similarly to the review of consumer taxes, this review<br />
finds that an important component of the total<br />
payments is represented by mobile-specific taxes<br />
and fees that apply to the sector.<br />
Mobile-specific payments are due to two main<br />
components:<br />
• Payments for mobile-specific taxes, either on<br />
operators or on consumers, as seen in Section 2,<br />
such as airtime excises and special taxes on mobile<br />
services’ revenues. The latter are discussed in<br />
Section 3.3.<br />
• Recurring regulatory fees, including USF and<br />
spectrum annual fees. While these do not<br />
represent taxes, they are paid to the government<br />
similarly to taxes. These are discussed in Section<br />
3.4. Spectrum auction payments are not included<br />
in the estimates and are discussed separately<br />
below, but are also specific to the mobile sector<br />
and often contribute to a significant part of<br />
operators’ expenses.<br />
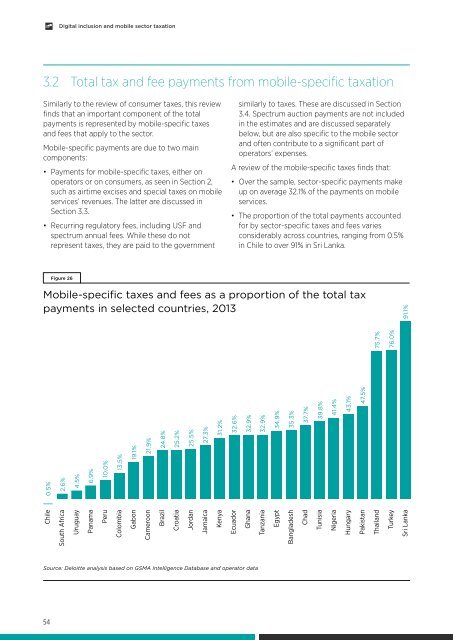
A review of the mobile-specific taxes finds that:<br />
• Over the sample, sector-specific payments make<br />
up on average 32.1% of the payments on mobile<br />
services.<br />
• The proportion of the total payments accounted<br />
for by sector-specific taxes and fees varies<br />
considerably across countries, ranging from 0.5%<br />
in Chile to over 91% in Sri Lanka.<br />
Figure 26<br />
Mobile-specific taxes and fees as a proportion of the total tax<br />
payments in selected countries, 2013<br />
Chile<br />
South Africa<br />
91.1%<br />
Uruguay<br />
Panama<br />
Peru<br />
Colombia<br />
Gabon<br />
Cameroon<br />
Brazil<br />
Croatia<br />
Jordan<br />
Jamaica<br />
Kenya<br />
Ecuador<br />
Ghana<br />
Tanzania<br />
Egypt<br />
Bangladesh<br />
Chad<br />
Tunisia<br />
Nigeria<br />
Hungary<br />
Pakistan<br />
Thailand<br />
Turkey<br />
Sri Lanka<br />
0.5%<br />
2.6%<br />
4.5%<br />
6.9%<br />
10.0%<br />
13.5%<br />
19.1%<br />
21.9%<br />
24.8%<br />
25.2%<br />
25.5%<br />
27.3%<br />
31.2%<br />
32.6%<br />
32.9%<br />
32.9%<br />
34.9%<br />
35.3%<br />
37.7%<br />
39.8%<br />
41.4%<br />
43.1%<br />
47.5%<br />
75.7%<br />
76.0%<br />
Source: Deloitte analysis based on GSMA Intelligence Database and operator data<br />
54