Slides
Slides
Slides
You also want an ePaper? Increase the reach of your titles
YUMPU automatically turns print PDFs into web optimized ePapers that Google loves.
Mapping the UK interbank system<br />
Given at Zurich, 14/09/12<br />
Sam Langfield, (1) Zijun Liu (2) and Tomohiro Ota (3)<br />
(1) UK Financial Services Authority and European Systemic Risk Board Secretariat. Email: samlangfield@gmail.com<br />
(2) UK Financial Services Authority. Email: zijun.liu@fsa.gov.uk<br />
(3) Bank of England. Email: tomohiro.ota@bankofengland.co.uk
What the UK interbank system looks like<br />
Why it looks like this
‘focus on the wood, not the trees’
9,700,000<br />
elements in the cross-section
163 variables:<br />
prime lending (unsecured, secured)<br />
equity<br />
fixed income<br />
CDS (bought, sold)<br />
SFT, incl repo<br />
derivatives (by underlying)<br />
et al<br />
by maturity (O/N,
Exposure Network<br />
Panel A: Exposures Network:<br />
Breakdown by Instrument<br />
Funding Network<br />
Panel B: Funding Network:<br />
Breakdown by Instrument<br />
derivati<br />
ves<br />
44%<br />
unsecur<br />
ed<br />
24%<br />
secured<br />
4%<br />
marketa<br />
ble<br />
16%<br />
repo<br />
66%<br />
unsecure<br />
d<br />
29%<br />
secured<br />
5%<br />
sft<br />
11%<br />
cds<br />
-1%<br />
Total exposures: £264bn<br />
Total funding: £192bn
Exposure Network by Bank Type<br />
UK<br />
Commercial<br />
Banks<br />
Overseas<br />
Banks<br />
Panel B: Funding Network:<br />
Breakdown by Instrument<br />
Large UK<br />
Banks<br />
Derivative (51%)<br />
Non-reporting<br />
Derivative (37%)<br />
Mkt securities (19%)<br />
Building<br />
Societies<br />
Investment<br />
Banks<br />
Derivative (46%)<br />
SFT (35%)<br />
Note: Some small links are not shown in the graph.
Funding Network by Bank Type<br />
UK<br />
Commercial<br />
Banks<br />
Unsec Loans (86%)<br />
Overseas<br />
Banks<br />
Panel B: Funding Network:<br />
Breakdown by Instrument<br />
Repo (64%)<br />
Large UK<br />
Banks<br />
Unsec Loans (57%)<br />
Non-reporting<br />
Building<br />
Societies<br />
Investment<br />
Banks<br />
Repo (98%)<br />
Note: Some small links are not shown in the graph.
Degree distribution<br />
Figure 9<br />
Degree: Exposures vs Funding Network<br />
0 5<br />
10 15 20 25<br />
0 20 40 60 80 100<br />
In-degree in Funding Network<br />
UK banks Building societies Investment banks<br />
Overseas banks Non-reporting banks<br />
Markers' area are proportional to within-quintile mean of banks' total global liabilities<br />
Sample: all 490 banks
Weighted degree distribution<br />
Figure 10<br />
Market Share: Exposures vs Funding Network<br />
0<br />
.05<br />
.1<br />
.15<br />
0 .05 .1 .15<br />
Funding Network: Market Share<br />
UK banks Building societies Investment banks<br />
Overseas banks Non-reporting banks<br />
Markers' area are proportional to within-quintile mean of banks' total global liabilities<br />
Sample: all 490 banks
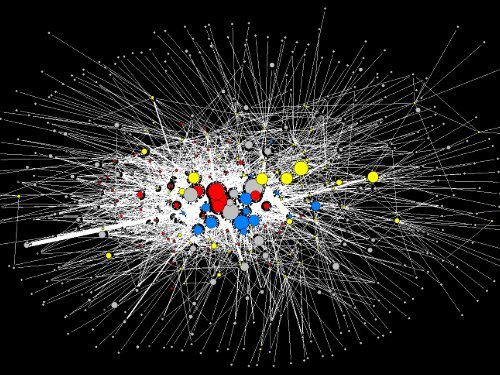
Structure (1): Interbank Exposures<br />
Generated using Financial Network Analytics
Structure (2):<br />
Hub-spoke / Core-periphery<br />
also see:<br />
Borgatti et al (2002)<br />
Craig and von Peter (2010)
No. of banks in core<br />
Fitness of core-periphery model<br />
No. of banks in core<br />
Fitness of core-periphery model<br />
Structure (3): Core-periphery fitness<br />
14<br />
12<br />
10<br />
8<br />
Panel A:<br />
Exposures networks<br />
No. of banks in core (LHS)<br />
Fitness of core-periphery model (RHS)<br />
0.8<br />
0.7<br />
0.6<br />
0.5<br />
0.4<br />
14<br />
12<br />
10<br />
8<br />
Panel B:<br />
Funding networks<br />
0.8<br />
0.7<br />
0.6<br />
0.5<br />
0.4<br />
6<br />
0.3<br />
6<br />
0.3<br />
4<br />
0.2<br />
4<br />
0.2<br />
2<br />
0.1<br />
2<br />
0.1<br />
0<br />
0<br />
0<br />
0
Broad Conclusion:<br />
Interbank system is incomplete<br />
and highly concentrated<br />
Similar findings:<br />
• Belgium (Degryse and Nguyen, 2010)Market-makers<br />
absorbing demand-supply gaps<br />
• Germany (Sacks, 2010; Craig and von Peter, 2010)<br />
• Italy (Fricke and Lux, 2012)<br />
• Mistrulli (2011)<br />
• Degryse and Nguyen (2010)
Interpretation:<br />
Why do we have core-periphery?<br />
• A specialist collecting info on behalf of<br />
others (Diamond-Dybvig monitoring)<br />
• Market-makers and search costs (Duffie et<br />
al, 2005)<br />
• Star-shape is the efficient way to be<br />
connected (Jackson and Wolinsky, 1996)
Source: BoE MFI stats<br />
One final thought
Appendix
Interpretation (3):<br />
Resilience: conflicting ideas<br />
• Complete vs incomplete network: which is risky?<br />
• Is core-periphery network risky?<br />
• Resilient because core bank becomes a fire-stop<br />
• Peripherals become more vulnerable against core<br />
• Depends on size, depends on the number of links<br />
• Identifying weakest links (Cont et al, 2011):<br />
• 173 Contagious Links which can “kill” exposed bank<br />
• 65 (out of 176) banks are exposed to contagious link
Structure (4):<br />
Core composition<br />
7<br />
6<br />
5<br />
4<br />
3<br />
2<br />
1<br />
0<br />
No. markets bank is in core<br />
8<br />
Red: UK banks<br />
Blue: Investment banks<br />
Yellow: Overseas banks<br />
Individual banks
Testing Maximum Entropy<br />
• Q: How reliable is the algorithm to populate<br />
incomplete matrices?<br />
1<br />
0.9<br />
0.8<br />
0.7<br />
0.6<br />
0.5<br />
0.4<br />
0.3<br />
0.2<br />
0.1<br />
0<br />
0% 5% 10% 15% 20% 25% 40% No Info
Maximum Entropy Algorithm:<br />
How reliable is the method?<br />
• Now we have an answer: the dataset is nearly<br />
complete<br />
Generate several incomplete matrices by<br />
eliminating exposures smaller than x% of capitals<br />
1. Populate the matrices by ME and RAS algorithms<br />
2. Calculating Pearson correlations with the original<br />
3. F test to check the Null hypothesis that ME method<br />
does not improve the estimation<br />
• populating the incomplete matrices by random numbers<br />
for 1000 times to generate a distribution to compare<br />
• Applying RAS for the randomly assigned matrices
k 1<br />
bk 2<br />
bk 3<br />
bk 1<br />
bk 2<br />
bk 3<br />
Why does ME work well?<br />
• Hypothesis: ME is prone to expect coreperiphery<br />
structure (even when it isn’t in fact)?<br />
1<br />
1<br />
2 3<br />
Actual matrix<br />
2 3<br />
ME’s estimate from total exposures<br />
bank 1 0 0.6 0 0.6<br />
bank 2 0 0 0.3 0.3<br />
bank 3 0.1 0 0 0.1<br />
0.1 0.6 0.3 1<br />
bank 1 0.06 0.36 0.18 0.6<br />
bank 2 0.03 0.18 0.09 0.3<br />
bank 3 0.01 0.06 0.03 0.1<br />
0.1 0.6 0.3 1


