BRR Examples - TL 9000
BRR Examples - TL 9000
BRR Examples - TL 9000

You also want an ePaper? Increase the reach of your titles
YUMPU automatically turns print PDFs into web optimized ePapers that Google loves.
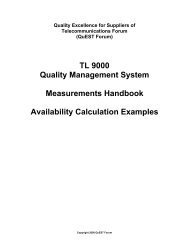
Quality Excellence for Suppliers of<br />
Telecommunications Forum<br />
(QuEST Forum)<br />
<strong>TL</strong> <strong>9000</strong><br />
Quality Management System<br />
Measurements Handbook<br />
<strong>BRR</strong> <strong>Examples</strong><br />
Copyright 2012 QuEST Forum<br />
Version 1.0
Basic Return Rate (<strong>BRR</strong>) <strong>Examples</strong><br />
7.2 <strong>BRR</strong> <strong>Examples</strong><br />
7.2.1 Basic Calculation<br />
Example 7.2-1<br />
Each month the reporting organization reports the Basic Return Rate measure<br />
for the month based on the returns received during the month that were originally<br />
shipped in the <strong>BRR</strong> basis period and the field population of units shipped in the<br />
<strong>BRR</strong> basis period. The <strong>BRR</strong> basis period is eighteen months. Therefore the<br />
returns count would include any unit shipped during the report month or the prior<br />
eighteen months. The field population would be the total number of units<br />
shipped in the eighteen months prior to the report month. It can be noted that<br />
<strong>BRR</strong> is equivalent to the combination of the ERI and YRR measures. <strong>BRR</strong> is<br />
used for products where tracking long term reliability is not practical.<br />
As an example, suppose during January 2013 there were a total of 355 returns<br />
received out of a total population of 186,914 units. Of the 355 returns, 316 were<br />
shipped during the month or the prior eighteen months. In other words, 316 of the<br />
returned units were shipped on or after July 1, 2011. For purposes of this<br />
example, let us set the number of units shipped in the previous eighteen months<br />
at 156,914 and a total number of shipments at 186,914. In tabular form the data<br />
for the month is:<br />
Table 7.2-1 <strong>BRR</strong> Data<br />
<strong>BRR</strong> Total<br />
Returns 316 355<br />
Population 156,914 186,914<br />
The resulting <strong>BRR</strong> calculation for the month is:<br />
Basic<br />
Returns from units shipped Jul-11 through Jan-13<br />
Return = 100 x 12 x ——————————————————————<br />
Rate<br />
Total shipments for Jul-11 through Dec-12<br />
= 100 x 12 x FRrb / FRsb<br />
= 100 x 12 x 316 / 156914<br />
= 2.42%<br />
Note: All returned units which fall into the basis shipping period and meet the <strong>TL</strong><br />
<strong>9000</strong> definition of a return are to be counted. Whether the unit is in or out of<br />
warranty does not have any bearing on the determination.<br />
The following shows this example in detail.<br />
Version 1.0 Copyright 2012 QuEST Forum<br />
<strong>BRR</strong> <strong>Examples</strong><br />
7.2-1
Basic Return Rate (<strong>BRR</strong>) <strong>Examples</strong><br />
Table 7.2-2<br />
Shipment<br />
Month<br />
Number<br />
Shipped<br />
Jan<br />
2013<br />
Feb<br />
2013<br />
Example Returns<br />
Returns from Shipment Population by Month Received<br />
Mar<br />
2013<br />
Apr<br />
2013<br />
May<br />
2013<br />
Jun<br />
2013<br />
Jul<br />
2013<br />
Aug<br />
2013<br />
Sep<br />
2013<br />
Oct<br />
2013<br />
Nov<br />
2013<br />
Dec<br />
2013<br />
Jun-11 & 30000 39 44 42 46 31 35 48 36 46 41 32 30<br />
before<br />
Jul-11 8253 22 9 11 12 11 10 7 10 8 15 16 5<br />
Aug-11 9243 11 11 14 12 19 15 13 1 16 10 13 21<br />
Sep-11 9261 17 16 17 12 16 16 17 7 16 11 12 17<br />
Oct-11 9721 19 13 21 15 17 11 14 19 16 18 17 13<br />
Nov-11 10131 16 8 15 14 21 28 17 17 19 13 14 20<br />
Dec-11 10140 24 16 17 22 12 19 17 15 24 14 15 14<br />
Jan-12 6263 11 11 7 9 9 9 9 13 6 3 6 3<br />
Feb-12 6436 7 9 8 11 10 8 5 5 3 14 7 9<br />
Mar-12 7244 14 15 12 8 10 15 4 12 7 9 5 12<br />
Apr-12 7275 10 9 14 10 9 8 10 6 12 11 11 10<br />
May-12 7396 6 11 12 11 16 9 13 16 8 13 10 3<br />
Jun-12 8263 6 13 12 16 11 7 9 12 14 13 7 13<br />
Jul-12 8833 14 12 14 12 12 14 14 15 11 10 11 8<br />
Aug-12 8954 16 6 14 17 14 14 11 14 12 12 8 13<br />
Sep-12 9368 20 18 15 18 16 6 12 19 12 6 16 11<br />
Oct-12 9818 39 24 18 7 15 15 17 16 13 6 19 9<br />
Nov-12 9787 36 26 24 23 12 13 6 13 9 9 20 12<br />
Dec-12 10528 23 30 20 22 25 15 15 15 16 12 16 11<br />
Jan-13 10644 5 33 23 25 22 30 18 15 14 19 14 19<br />
Feb-13 11321 1 31 23 27 24 24 11 13 22 11 16<br />
Mar-13 11332 5 27 26 20 29 38 17 14 19 12<br />
Apr-13 11674 2 33 28 26 26 16 19 19 12<br />
May-13 12151 4 27 27 28 31 18 13 24<br />
Jun-13 12460 1 31 26 28 26 22 15<br />
Jul-13 13494 1 35 25 32 35 16<br />
Aug-13 13670 5 33 25 28 21<br />
Sep-13 13933 4 30 23 32<br />
Oct-13 13725 4 34 22<br />
Nov-13 14467 3 36<br />
Dec-13 14905 4<br />
Total Returns<br />
Received In Month<br />
355 335 366 374 398 397 414 445 449 449 476 463<br />
Version 1.0 Copyright 2012 QuEST Forum<br />
<strong>BRR</strong> <strong>Examples</strong><br />
7.2-2
Basic Return Rate (<strong>BRR</strong>) <strong>Examples</strong><br />
Table 7.2-2 shows shipments for July 2011 through December 2013, plus all<br />
shipments prior to July 2011. In addition, it shows returns for January 2013<br />
through December 2013, by month of shipment as determined by shipping<br />
records. The highlighted first column of data in Table 7.2-2 shows the month of<br />
shipment for the 355 returns received during January 2013. For example, in<br />
January 2013, 22 returns were received from the 8253 units shipped in July 2011<br />
and 11 returns were received from the 9243 units shipped in August 2011.<br />
The Basic Return Rate, <strong>BRR</strong>, for the month of January 2013, is calculated as<br />
follows. The field population is determined by adding the shipment quantities<br />
shown on the left side of Table 7.2-2 for the months of July 2011 through<br />
December 2012. Therefore the total shipments are<br />
FRsb = 8253+9243+9261+9721+10131+10140+6263+6436+7244+<br />
7275+7396+8263+8833+8954+9368+9818+9787+10528 = 156,914<br />
The number of returned units is the total returned from July 2011 through<br />
January 2013. Therefore<br />
Basic<br />
FRrb = 22+11+17+19+16+24+11+7+14+10+6+6+14+16+20+39+<br />
36+23+5 = 316<br />
Returns of units shipped Jul-11 through Jan-13<br />
Return = 100 x 12 x ——————————————————————<br />
Rate<br />
= 100 x 12 x FRrb / FRsb<br />
= 100 x 12 x 316 / 156914<br />
= 2.42%<br />
Total Shipments for Jul-11 through Dec-12<br />
Note that the returns of units shipped in January are included to count all returns<br />
during the month and to be alerted to any developing problems. However,<br />
shipments during January are excluded because the majority of units shipped in<br />
January will not have been placed in operation.<br />
For those product categories that require the reporting of <strong>BRR</strong>, there is no<br />
tracking of return rate data outside of the initial eighteen months after shipment<br />
required. <strong>BRR</strong> is the only return rate measure reported for these product<br />
categories.<br />
Version 1.0 Copyright 2012 QuEST Forum<br />
<strong>BRR</strong> <strong>Examples</strong><br />
7.2-3
Basic Return Rate (<strong>BRR</strong>) <strong>Examples</strong><br />
Calculating the Basic Return rate for all months in 2013 gives<br />
Month<br />
in 2013<br />
<strong>BRR</strong><br />
Returns<br />
<strong>BRR</strong><br />
Shipments<br />
Basic Return<br />
Rate<br />
January 316 156914 2.42%<br />
February 282 159305 2.12%<br />
March 299 161383 2.22%<br />
April 292 163454 2.14%<br />
May 304 165407 2.21%<br />
June 282 167427 2.02%<br />
July 281 169747 1.99%<br />
August 327 176978 2.22%<br />
September 295 184212 1.92%<br />
October 301 190901 1.89%<br />
November 328 197351 1.99%<br />
December 306 204422 1.80%<br />
2) Field Replaceable Unit (FRU) Returns Data Table<br />
The data reported to the <strong>TL</strong> <strong>9000</strong> Administrator are shown in Table 7.2-3.<br />
Table 7.2-3<br />
Example 1 – FR Data Table Report<br />
Identifier Value<br />
Year 2013<br />
Month 01<br />
Product Category 7.7.2<br />
MeasurementID <strong>BRR</strong><br />
FRa 12<br />
FRrb 316<br />
FRsb 156914<br />
Version 1.0 Copyright 2012 QuEST Forum<br />
<strong>BRR</strong> <strong>Examples</strong><br />
7.2-4