AP BIO Summer Essays 2011-essays - Union City High School
AP BIO Summer Essays 2011-essays - Union City High School
AP BIO Summer Essays 2011-essays - Union City High School

Create successful ePaper yourself
Turn your PDF publications into a flip-book with our unique Google optimized e-Paper software.
Advanced Placement Biology<br />
<strong>Union</strong> <strong>City</strong> <strong>High</strong> <strong>School</strong><br />
<strong>Summer</strong> Assignment <strong>2011</strong><br />
Ecology Short Answer Questions<br />
1. Each of the terrestrial biomes have very different characteristics that determine the niches of<br />
the organisms that live within that biome.<br />
(a) Select THREE abiotic factors that affect the organisms within a biome. Compare<br />
how these factors function in any TWO distinct terrestrial biomes.<br />
(b) Describe the role of vertical layering in both a forest and non-forest biome.<br />
(c) The same biome is often found in multiple locations throughout the world. For<br />
example, Temperate Grasslands can be found in North America, South America,<br />
Europe, Asia, and Africa. Although the species that occupy the niches in this biome<br />
are physically and behaviorally similar, the niches are not filled by exactly the same<br />
species. Explain why the organisms in the same biome at a different location would<br />
be similar species, but not the same. Include a discussion of both the ecological and<br />
evolutionary explanation.<br />
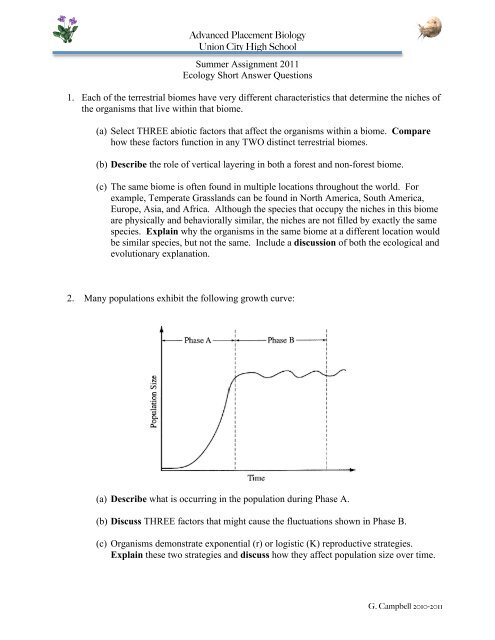
2. Many populations exhibit the following growth curve:<br />
(a) Describe what is occurring in the population during Phase A.<br />
(b) Discuss THREE factors that might cause the fluctuations shown in Phase B.<br />
(c) Organisms demonstrate exponential (r) or logistic (K) reproductive strategies.<br />
Explain these two strategies and discuss how they affect population size over time.<br />
G. Campbell 2010-<strong>2011</strong>
Advanced Placement Biology<br />
<strong>Union</strong> <strong>City</strong> <strong>High</strong> <strong>School</strong><br />
3. Population ecology studies the growth and distribution of organisms within one population<br />
in an ecosystem.<br />
(a) Identify THREE density-dependent factors in an ecosystem that regulate population<br />
growth and provide a specific example of each.<br />
(b) Compare the life history of a semelparous and iteroparous organism. Describe the<br />
benefits and detriments of each reproductive strategy.<br />
(c) Examine the age structure graphs below.<br />
Identify which population is exhibiting the most stable (no growth) population.<br />
Explain your selection.<br />
4. Organisms rarely exist alone in the natural environment. The following are five examples of<br />
symbiotic relationships<br />
• Plant root nodules<br />
• Digestion of cellulose<br />
• Epiphytic plants<br />
• AIDS (acquired immune deficiency syndrome)<br />
• Anthrax<br />
Choose FOUR of the above and for each example chosen.<br />
a) identify the participants involved in the symbiosis and describe the symbiotic<br />
relationship, and<br />
b) discuss the specific benefit or detriment, if any, that each participant receives from<br />
the relationship.<br />
G. Campbell 2010-<strong>2011</strong>
Advanced Placement Biology<br />
<strong>Union</strong> <strong>City</strong> <strong>High</strong> <strong>School</strong><br />
5. According to fossil records and recent published observations, two species of leaf-eating<br />
beetles (species A and B) have existed on an isolated island in the Pacific Ocean for over<br />
100,000 years. In 1964 a third species of leaf-eating beetle (species C) was accidentally<br />
introduced on the island. The population six of each species has been regularly monitored<br />
as shown in the graph above.<br />
(a) Propose an explanation for the pattern of population density observed in species C.<br />
(b) Describe the effect that the introduction of beetle species C has had on the<br />
population density of species A and species B. Propose an explanation for the<br />
patterns of population density observed in species A and in species B.<br />
(c) Predict the population density of species C in 2014. Provide a biological<br />
explanation for your prediction.<br />
(d) Explain why invasive species are often successful in colonizing new habitats.<br />
6. Bacteria play central biological roles.<br />
(a) Bacteria may act as<br />
• producers<br />
• parasites<br />
• mutualistic symbionts<br />
• decomposers<br />
Select THREE of the ecological roles above. For each one you choose, describe<br />
how bacteria carry out the role and discuss its ecological importance.<br />
(b) Explain the role of bacteria in any two biogeochemical cycles.<br />
G. Campbell 2010-<strong>2011</strong>
Advanced Placement Biology<br />
<strong>Union</strong> <strong>City</strong> <strong>High</strong> <strong>School</strong><br />
7. The diagram above shows the succession of communities from annual plants to hardwood<br />
trees in a specific area over a period of time.<br />
(a) Discuss the expected changes in biodiversity as the stages of succession progress as<br />
shown in the diagram above.<br />
(b) Describe and explain THREE changes in abiotic conditions over time that lead to<br />
the succession, as shown in the diagram above.<br />
(c) For each of the following disturbances, discuss the immediate and long-term effects<br />
on ecosystem succession.<br />
(i) A volcano erupts, covering a 10-square-kilometer portion of a mature forest<br />
with lava.<br />
(ii) A 10-square-kilometer portion of a mature forest is clear-cut.<br />
8. On a trip to a dense forest, a biologist noticed that millipedes (small invertebrates) were<br />
plentiful under logs but were rarely seen in any other location.<br />
(a) Propose THREE environmental variables (two abiotic and one biotic) that could<br />
explain why millipedes are found more frequently under logs.<br />
(b) For ONE of the abiotic environmental variables you chose above, design a<br />
controlled experiment to test a hypothesis that this factor affects the distribution of<br />
millipedes on the forest floor. Describe data that would support your hypothesis.<br />
(c) Suppose that you were examining the distribution of a plant, instead of the millipede.<br />
Describe modification sin the experiment that you designed in (b) that would be<br />
required to determine whether the abiotic factor you chose affects the distribution of<br />
the plant.<br />
G. Campbell 2010-<strong>2011</strong>
Advanced Placement Biology<br />
<strong>Union</strong> <strong>City</strong> <strong>High</strong> <strong>School</strong><br />
9. Interdependence in nature is illustrated by the transfer of energy through trophic levels. The<br />
diagram below depicts the transfer of energy in a food web of an arctic lake located in<br />
Alaska.<br />
(a) Choosing organisms from FOUR different trophic levels of this food web as<br />
examples, explain how energy is obtained at each trophic level.<br />
(b) Describe the efficiency of energy transfer between trophic levels and discuss how<br />
the amount of energy available at each trophic level affects the structure of the<br />
ecosystem.<br />
(c) If the cells in the dead terrestrial plant material that washed into the lake contained a<br />
commercially produced toxin, what would be the likely effects of this toxin on this<br />
food web? Explain.<br />
10. Consumers in aquatic ecosystems depend on producers for nutrition.<br />
(a) Explain the difference between gross and net productivity.<br />
(b) Describe a method to determine net and gross primary productivity ina freshwater<br />
pond over a 24-hour period.<br />
In an experiment, net primary productivity was measured , in the early spring, for water<br />
samples taken from different depths of a freshwater pond in a temperate deciduous forst.<br />
(c) Explain the data presented by the graph, including a description of the relative rates of<br />
metabolic processes occurring at different depths of the pond.<br />
(d) Describe how the relationship between net primary productivity and depth would be<br />
expected to differ if new data were collected in mid-summer from the same pond. Explain<br />
your prediction.<br />
G. Campbell 2010-<strong>2011</strong>