June 2006Gas <strong>Vehicles</strong> Report37Worldwide NGV and fuelling station growth, 2004-2005CountryNatural Gas <strong>Vehicles</strong>Refuelling stations2004 2005 Difference Growth 2004 2005 Difference GrowthDate ofreferenceNORTH & SOUTH AMERICAArgentina 1,294,615 1,457,118 162,503 13% 1,334 1,452 118 9% Oct. '04-Oct. '05Brazil 826,364 1,011,206 184,842 22% 650 1,138 488 75% Dec. '04-Oct. '05Colombia 47,880 72,136 24,256 51% 90 168 78 87% Oct. '04-Jun. '05Bolivia 15,486 35,810 20,324 131% 37 62 25 68% Apr. '04-Oct. '05Chile 3,770 5,500 1,730 46% 12 14 2 17% Apr. '04-Jun. '05Trinidad & Tobago 3,800 4,000 200 5% 13 13 0 0% Jul. '04-Oct. '05Mexico 3,037 3,037 0 0% 6 6 0 0% Mar. '04-Oct. '05Sub-total 2,194,952 2,588,807 393,855 2,142 2,853 711ASIA & MIDDLE EASTPakistan 475,000 700,000 225,000 47% 360 766 406 113% Jan. '04-Oct. '05China 79,600 97,200 17,600 22% 300 355 55 18% Jun. '04-Jan. '05Bangladesh 31,650 41,314 9,664 31% 60 122 62 103% Oct. '04-Oct. '05Armenia 28,328 38,100 9,772 34% 47 60 13 28% Oct. '04-Feb. '05Japan 21,305 24,648 3,343 16% 270 288 18 7% Jun. '04-Jun. '05Iran 15,000 63,779 48,779 325% 30 96 66 220% Oct. '04-Oct. '05Malaysia 10,500 14,900 4,400 42% 37 39 2 5% Apr. '04-May '05Korea 6,060 7,999 1,939 32% 67 105 38 57% Nov. '04-Sep. '05Thailand 4,311 8,500 4,189 97% 27 41 14 52% Oct. '04-Dec. '05Philippines 12 14 2 17% 1 1 0 0% Jul. '04-Oct. '05Singapore 7 7 0 0% 1 1 0 0% Oct. '04-Jul. '05Sub-total 671,773 996,461 324,688 1,200 1,874 674EUROPEItaly 381,250 382,000 750 0% 471 521 50 11% Jun. '04-Jul. '05Ukraine 55,000 67,000 12,000 22% 140 147 7 5% Jun. '04-May. '05Russia 40,500 41,780 1,280 3% 207 213 6 3% Jul. '04-May '05Germany 25,000 27,200 2,200 9% 522 622 100 19% Oct. '04-Sept. '05France 7,200 8,400 1,200 17% 105 125 20 19% Jan. '04-Oct. '05Belarus 5,500 5,500 0 0% 24 24 0 0% May '04-May '05Bulgaria 2,100 7,305 5,205 248% 8 11 3 38% Oct. '04-Sept. '05Sweden 4,238 5,298 1,060 25% 47 65 18 38% Jan. '04-Jan. '05Switzerland 1,044 1,700 656 63% 48 61 13 27% Sept. '04-Sept. 05Spain 664 912 248 37% 19 30 11 58% Feb. '04-Sept. '05Poland 147 771 624 424% 21 28 7 33% May '04-Apr. '05Austria 400 584 184 46% 68 71 3 4% May '04-Oct. '05Netherlands 340 540 200 59% 8 10 2 25% Jun. '04-Nov. '05Turkey 400 520 120 30% 5 6 1 20% Aug. '04-Nov. '05Czech Republic 390 455 65 17% 14 16 2 14% May '04-May '05Belgium 300 300 0 0% 4 9 5 125% Oct. '04-Nov. '05Slovakia 250 286 36 14% 7 7 0 0% Sept. '04-Nov. '05Portugal 242 242 0 0% 5 5 0 0% Jan'04-Jan. '05Norway 147 147 0 0% 4 4 0 0% Jul. '04-Apr. '05Croatia 100 100 0 0% 1 1 0 0% Oct. '04-Oct. '05Finland 76 86 10 13% 2 3 1 50% Apr. '04-Jan. '05Iceland 45 50 5 11% 1 1 0 0% Nov. '04-Oct. '05Luxembourg 32 49 17 53% 3 4 1 33% Jul.'04-Nov.'05Bosnia & Herzegovina 1 1 0 0% Apr. '04-Apr. '05Sub-total 525,366 551,226 25,860 1,734 1,984 250AFRICAEgypt 54,374 61,590 7,216 13% 86 91 5 6% Jul. '04-Jul. '05Sub-total 54,374 61,590 7,216 86 91 5WORLWIDETotal 3,446,465 4,198,084 751,619 5,162 6,802 1,640Additional data (<strong>no</strong>t included in the growth counting)U.S.A. 136,018 146,876 10,858 8% 1,340 1,600 260 19% Dec. '03-Dec. '04India 222,306 192 Mar. '04Venezuela 44,146 149 Apr. '04Canada 20,505 222 Sept. '03Tajikistan 10,600 53 May '05Indonesia 4,660 51 Apr. '02Moldavia 800 4,500 3,700 463% 87 8 -79 -91% Dec. '01-May. '05Australia 2,104 2,060 -44 -2% 127 Jul. '01-Nov. '05United Kingdom 543 31 Nov. '04New Zealand 471 12 Jun. '04Latvia 310 4 Oct. '04Algeria 125 3 Oct. '04Serbia & Montenegro 92 2 Dec. '04Ireland 81 2 Sept. '03Macedonia 32 1 Jan. '05Nigeria 28 2 May '98Liechtenstein 26 1 Sept. '04Taiwan 6 4 -2 -33% 1 1 0 0% Jul. '03-Apr. '05Total 291,489 21,910 3,654 832 117 -79Notes: N<strong>NGVs</strong>, With a growth rate of 46%-424% , ten countries with NGV population above 5.000 vehicles in Asia, Europe, Middle East and South America experienced the biggest NGV growth in 2004-2005. Those countriesin highest ranking are Poland, Iran, Bulgaria, Bolivia, Switzerland, The Netherlands, Colombia, Thailand, Pakistan, and Chile. However, if we look at the increase of the number of NGV population, South American countries dominatesthe top-ten ranking. Those countries are Pakistan, Brazil, Argentina, Iran, Colombia, Bolivia, China, Ukraine, Armenia,and Bangladesh. The increase is from 9.664 to 225.000 <strong>NGVs</strong> in one year.Fuelling Stations, The top-ten fuelling station growth by percentage (38%-220%) took place in Iran, Belgium, Pakistan, Bangladesh, Colombia, Brazil, Bolivia, Spain, Finland, and Sweden with the lowest growth. Those countrieshave at least 60 stations in their land. Biggest fuelling station increase by number took place in Brazil with 488 stations, followed by Pakistan, Argentina, Germany, Colombia, Iran, Bangladesh, China, Italy, and Bolivia with an increaseof 25 station in 2004-2005.
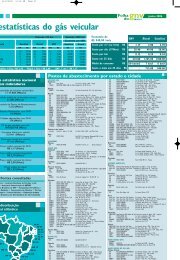
38 June 2006 Gas <strong>Vehicles</strong> ReportWorldwide fuel pricesCountryPremium RegularGasoline Gasoline(Euro/litre)(Euro/litre)Diesel(Euro/litre)CNG(Euro/m3)CNG priceequivalent perlitre gasolineCNG priceequivalent perlitre dieselArgentina 0.51 0.46 0.39 0.18 0.16 0.18Armenia 0.67 0.62 0.53 0.24 0.22 0.25Austria (a,c) 1.19 1.17 1.10 0.77 0.69 0.79Bangladesh 0.52 0.49 0.34 0.10 0.09 0.10Belarus 0.51 0.41 0.25 0.22 0.26Belgium 1.40 1.30 1.00 0.50 0.45 0.51Bolivia 0.55 0.41 0.18 0.16 0.18Bosnia & Herzegovina (d) 0.81 0.64 0.74 0.25 0.22 0.26Brazil (b,e) 0.97 0.61 0.46 0.41 0.47Bulgaria (a, f) 0.90 0.83 0.80 0.35 0.33 0.37Canada 0.41 0.32 0.21 0.19 0.22Chile (g) 0.58 0.56 0.36 0.23 0.21 0.24China 0.48 0.43 0.40 0.26 0.23 0.27Colombia 0.53 0.40 0.27 0.22 0.20 0.23Croatia (a, h) 1.08 1.13 1.00 0.33 0.30 0.34Czech Republic (i) 0.93 0.81 0.90 0.57 0.51 0.58Egypt (b) 0.19 0.13 0.08 0.06 0.05 0.06Finland (j) 1.23 1.20 0.97 0.66 0.59 0.68France 1.08 1.08 0.79 0.69 0.62 0.71Germany (a) 1.25 1.22 1.10 0.70 0.54 0.72Iceland (k) 1.65 1.50 1.46 1.19 1.07 1.22India 0.72 0.69 0.49 0.24 0.22 0.25Indonesia 0.47 0.37 0.40 0.15 0.13 0.15Iran (l) 0.10 0.07 0.016 0.018 0.016 0.017Italy (m) 1.29 1.26 1.17 0.50 0.47 0.52Japan (n) 0.98 0.89 0.67 0.52 0.40 0.44Korea (b) 1.26 0.98 0.44 0.39 0.45Latvia 0.76 0.70 0.62 0.23 0.21 0.24Liechtenstein 0.95 0.93 0.95 0.80 0.72 0.82Luxembourg 1.09 1.07 0.88 0.58 0.52 0.60Malaysia (o) 0.37 0.35 0.29 0.15 0.13 0.15Mexico 0.49 0.43 0.36 0.21 0.19 0.22Moldova 0.50 0.43 0.18 0.16 0.18Netherlands (a) 1.45 1.40 1.12 0.43 0.39 0.44New Zealand (p) 0.68 0.65 0.42 0.37 0.33 0.38Norway 1.24 1.20 1.03 0.46 0.41 0.47Pakistan (a) 0.88 0.79 0.52 0.30 0.27 0.31Philippines 0.62 0.57 0.53 0.24 0.22 0.25Poland (q) 0.95 0.91 0.85 0.29 0.26 0.30Portugal (r) 1.13 1.07 0.78 0.55 0.49 0.56Russia 0.56 0.50 0.45 0.18 0.16 0.18Serbia & Montenegro (a, s) 1.08 0.96 0.83 0.22 0.20 0.23Singapore (a, t) 0.77 0.86 0.53 0.33 0.30 0.34Slovakia (u) 0.97 1.05 1.03 0.43 0.39 0.44Spain (v) 1.12 1.02 0.96 0.56 0.44 0.49Sweden (w) 1.20 1.18 1.04 0.83 0.93Switzerland (a, x) 1.13 1.04 1.11 0.79 0.67 0.75Tajikistan 0.55 0.45 0.21 0.19 0.22Thailand (a, y) 0.59 0.57 0.55 0.18 0.16 0.18Trinidad & Tobago 0.39 0.35 0.19 0.14 0.13 0.14Turkey (z) 1.61 1.60 1.26 0.75 0.65 0.73Ukraine 0.44 0.40 0.40 0.15 0.13 0.15United Kingdom (a1) 1.40 1.37 1.31 0.64 0.57 0.66U.S.A. (b1) 0.59 0.60 0.45 0.40 0.46Venezuela 0.10 0.046 0.06 0.002 0.002 0.002Ratio price differential of NG to other fuelsCountryCNG / Premium CNG / Regular CNGGasoline Gasoline DieselArgentina 31.6% 40.1% 47.4%Armenia 32.1% 34.7% 46.5%Austria 58.0% 59.0% 71.8%Bangladesh 17.2% 18.3% 30.2%Belarus 43.9% 62.6%Belgium 32.0% 34.5% 51.3%Bolivia 29.3% 45.0%Bosnia & Herzegovina 27.6% 35.0% 34.7%Brazil 42.5% 77.4%Bulgaria 36.8% 39.9% 46.2%Canada 45.9% 67.3%Chile 35.5% 36.8% 65.6%China 48.5% 54.2% 66.7%Colombia 37.2% 49.3% 83.6%Croatia 27.4% 26.2% 33.9%Czech Republic 54.9% 63.0% 65.0%Egypt 28.3% 41.3% 77.0%Finland 48.1% 49.3% 69.8%France 57.2% 57.2% 89.6%Germany 43.2% 44.3% 65.3%Iceland 64.6% 71.1% 83.6%India 29.9% 31.2% 50.3%Indonesia 28.6% 36.3% 38.5%Iran 16.3% 23.4% 109.0%Italy 36.3% 37.1% 44.6%Japan 40.8% 44.9% 65.8%Korea 31.3% 46.1%Latvia 27.1% 29.4% 38.1%Liechtenstein 75.4% 77.1% 86.4%Luxembourg 47.7% 48.6% 67.6%Malaysia 36.3% 38.4% 53.1%Mexico 38.4% 43.8% 59.9%Moldova 32.3% 43.0%Netherlands 26.6% 27.5% 39.4%New Zealand 48.7% 51.0% 90.4%Norway 33.2% 34.3% 45.8%Pakistan 30.5% 34.0% 59.2%Philippines 34.7% 37.7% 46.5%Poland 27.3% 28.5% 35.0%Portugal 43.6% 46.0% 72.3%Russia 28.8% 32.3% 41.0%Serbia & Montenegro 18.2% 20.5% 27.2%Singapore 38.4% 34.4% 63.9%Slovakia 39.7% 36.7% 42.8%Spain 39.2% 43.1% 50.8%Sweden 69.0% 78.7%Switzerland 59.7% 64.8% 67.9%Tajikistan 34.2% 47.9%Thailand 27.3% 28.3% 33.4%Trinidad & Tobago 32.2% 35.8% 75.6%Turkey 40.6% 40.9% 57.8%Ukraine 30.5% 33.6% 38.5%United Kingdom 41.0% 41.8% 50.1%U.S.A. 68.1% 76.7%Venezuela 1.8% 3.9% 3.4%Notes: (a): In these countries the local gauge unit isEuro/kg, the conversion factor depends on the <strong>no</strong>rmaldensity of gaseous natural gas in each country. (b): InBrasil, Korea and Egypt diesel is only allowed in heavyduty engines, buses and trucks. (c): In Austria, the fueltaxes since 1-1-2004 are 0.066 Euro/m3 <strong>for</strong> CNG,0.302 Euro/lt <strong>for</strong> diesel (containing max. 10mg/kgsulphur) and 0.417 Euro/litre <strong>for</strong> unleaded gasoline.(d): VAT and additional fuel taxes are included in premiumand regular gasoline price. For CNG price, VAT isalready included; there is <strong>no</strong> additional tax <strong>for</strong> CNG. (e):Premium and regular gasoline contain 25% alcohol.The price of aditive gasoline is 0.67 Euro/litre. Alcohol<strong>for</strong> vehicles cost is 0.33 Euro/litre. (f): Bulgarian CNGprice is 0,45 Euro/kg. The <strong>no</strong>rmal density of CNG inBulgaria is 0.71 kg/Nm3, the energy content is 9.3kWH/Nm3. Gasoline energy conten is 8.79 kWH/litreand 9.83kWH/litre <strong>for</strong> diesel. (g): Exclusive annual taxi'spatent fee. Private owners = 786 US$/year (647Euro/year).Commercial fleet= 360 US$/year (296 Euro/year).,(h):Normal density of CNG in Croatia is0.753 kg/m3. CNG price in October 2005 is 0.43 Euro/kg.(i): The excise tax <strong>for</strong> premium gasoline is <strong>no</strong>t yetincorporated. The excise taxes <strong>for</strong> regular gasoline,diesel and CNG are included. Also, 22% VAT is includedin the CNG price. (j): In May 2005, CNG price isfirst made public in Finland. Be<strong>for</strong>e, CNG is only sold toprivate fleets. (k): Diesel retail price is inclusive VAT <strong>but</strong><strong>no</strong> other taxes. Owners of diesel vehicles must pay anextra tax, which depends on the vehicle weight and themileage. For trucks, total fuel price <strong>for</strong> diesel ends uplower than CNG. In July 2005, diesel tax will be incorporatedin the retail price. Service fee is already includedin all fuels except in the premium gasoline price. (l):Iranian fuel energy contents: CNG= 13.9kWH/kg =10.78kWH/m3; diesel = 10.44 kWH/litre; gasoline =9.79kWH/litre. The <strong>no</strong>rmal density of CNG is0.775kg/Nm3. (m): Italian CNG's <strong>no</strong>rmal density is 0.72kg/Nm3. CNG price is 0.70 Euro/kg. The energy contentsare: CNG=9.3kWh/m3 and 13 kEh/kg; diesel=9.7kWh/lt; gasoline=8.7 kWh/lt. (n): The 5% VAT is <strong>no</strong>t yetincluded. Normally, CNG price depends on the consumptionvolume of the customers. (o): In Malaysia, CNG ismeasured/sold in a litre equivalent gasoline. (p): CNGprices in New Zealand are between 0.89-0.98 NZ$/kg(0.35-0.38 Euro/m3) (q): There is <strong>no</strong> excise duty onCNG consumption. VAT is included in the CNG price. (r):The market was liberalised on January 1st, 2004. CNGprice increased from 0.45 Euro/m3 to 0.55 Euro/m3(s): The <strong>no</strong>rmal density of 1 Nm3 CNG is 0,76 kg in Serbiaand Montenegro. (t): The <strong>no</strong>rmal density of 1 Nm3CNG in Singapore is 0.76 kg (u): Slovak's fuel retail pricesinclude 19% VAT (v): The <strong>no</strong>rmal density of 1 Nm3CNG in Spain is 0.796 kg; fuel energy content (pcs) ofCNG is 11.77kWh/Nm3=14.79kWh/kg; <strong>for</strong> diesel is10.26kWh/litre and <strong>for</strong> gasoline is 9.23kWh/litre. CNGprice in Sept. 05 was 0.756 Euro/kg. LNG price was3.47 Euro/kg without transport (0.234 Euro/kWH). (w): The annual road tax in Sweden is about 500Euro higher <strong>for</strong> diesel cars (varies by vehicle weight) than<strong>for</strong> gasoline cars. This higher road tax compensates lowerfuel taxes on diesel. CNG cars have the same annualroad tax as gasoline cars. CNG energy content is 11,05kWh/Nm3, gasoline = 8.8 kWh/litre, diesel = 9.87 kWh-/litre, biogas = 9.77 kWh/litre. (x):The <strong>no</strong>rmal density ofSwiss biogas and CNG is 0.79 kg/m3. Energy content ofCNG is 10.3kWH/Nm3 and 13.04kWh/kg, 1 litre dieselis 9.83kWh/litre and 1 litre gasoline is 8.79kWh/litre.Biogas price in January 2006 was 0.89 (Euro/kg) =0.70 Euro/Nm^3 = 0.61 Euro/litre equivalent gasoline =0.66 Euro/litre equivalent diesel. (y): Thai's CNG <strong>no</strong>rmaldensity is 0.73 kg/Nm3. (z): All taxes included. Fuelenergy content in Turkey: CNG = 10.24 kWH/Nm3; diesel= 9.95kWH/litre; gasoline = 8.93 kWH/litre; LPG =Notes: This calculation in this table was made based on the ratiobetween CNG and the respective oil prices. Also, the energy contentof each fuels in each country was taken into consideration.Assumption made <strong>for</strong> fuel price calculationCH4 content in natural gas is 97%CNG energy content is 9.6 kWh/Nm3Gasoline energy content is 8.6 kWh/litreDiesel energy content is 9.85 kWH/litreThese conversion units are used in CNG price equivalent to gasolineand diesel, except the exact units of each countries are <strong>no</strong>tifiedin the foot <strong>no</strong>tes.Fuel price fluctuation in 2005In Germany, market leader oil Company Aral increased 106 timesand decreased 93 times gasoline price.Shell increased fuel prices 63 times and decreased the prices54 times in the Netherlands.The highest advice price <strong>for</strong> gasoline was 1.46 Euro in Germany,and 1.55 Euro <strong>for</strong> The Netherlands.7.15kWH/litre. LPG price is 0.75 Euro/litre in November 2005. Normaldensity of CNG is 0.7172 kg/Nm3. (a1): VAT inclusive. The taxes are0.69 Euro/litre <strong>for</strong> ultralow sulphur unleaded petrol/diesel, 0.75 Euro-/litre <strong>for</strong> conventional unleaded petrol, 0.77 Euro/litre <strong>for</strong> diesel, 0.39Euro/litre <strong>for</strong> bio-diesl and bio-etha<strong>no</strong>l, and 0.09 Euro/Nm3 <strong>for</strong> CNG.The <strong>no</strong>rmal density of British CNG is 0.73 kg/Nm3 (b1): The local gaugesin the US are gallon (diesel and gasoline) and GGE (gallon equivalentgasoline <strong>for</strong> CNG). The conversion factor is 1 US gallon = 3.79 litre.