The phenomenological solar effect on climate - Acrim.com
The phenomenological solar effect on climate - Acrim.com
The phenomenological solar effect on climate - Acrim.com

Create successful ePaper yourself
Turn your PDF publications into a flip-book with our unique Google optimized e-Paper software.
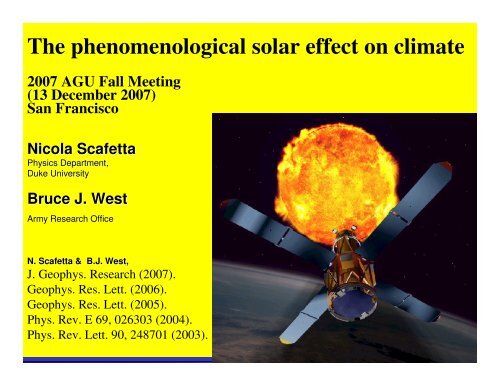
<str<strong>on</strong>g>The</str<strong>on</strong>g> <str<strong>on</strong>g>phenomenological</str<strong>on</strong>g> <str<strong>on</strong>g>solar</str<strong>on</strong>g> <str<strong>on</strong>g>effect</str<strong>on</strong>g> <strong>on</strong> <strong>climate</strong>2007 AGU Fall Meeting(13 December 2007)San FranciscoNicola ScafettaPhysics Department,Duke UniversityBruce J. WestArmy Research OfficeN. Scafetta & B.J. West,N. Scafetta & B.J. West,J. Geophys. Research (2007).Geophys. Res. Lett. (2006).Geophys. Res. Lett. (2005).Phys. Rev. E 69, 026303 (2004).Phys. Rev. Lett. 90, 248701 (2003).
GLOBAL WARMINGa disrupted debateDATA ARE UNCERTAIN and DEBATED1) direct Global Surface Temperature data are available since 18502) direct Total Solar Irradiance data are available since 1978THEORETICAL AND PROXY MODELS ARE POOR1) Climate models are known to be in<strong>com</strong>plete2) Total Solar Irradiance models are in<strong>com</strong>plete as wellSTRONG HISTORICAL SCIENTIFIC “BIAS”In late 1800s scientists vigorously supported the idea of ac<strong>on</strong>stant Sunand, so, the c<strong>on</strong>cept of <str<strong>on</strong>g>solar</str<strong>on</strong>g> c<strong>on</strong>stant was introduced.
Understanding Climate is an inverseproblem Different models might apparently fit the data. Models depend <strong>on</strong> the past and actual (notthe future) scientific-cultural cultural envir<strong>on</strong>ment inwhich they are produced. Scientific bias might play a major role in theengineering modeling processes. Models believed to be correct are used tomake predicti<strong>on</strong>s. Predicti<strong>on</strong> might indeed be based <strong>on</strong> bias!!!!
Correlati<strong>on</strong> between <str<strong>on</strong>g>solar</str<strong>on</strong>g> and <strong>climate</strong> recordsEddy J.A. (1976), <str<strong>on</strong>g>The</str<strong>on</strong>g> MaunderMinimum, Science 192, 1189-1202.Cosmic ray prot<strong>on</strong>s blast nuclei in the upper atmosphere, producing neutr<strong>on</strong>s which in turnbombard nitrogen, the major c<strong>on</strong>stituent of the atmosphere . This neutr<strong>on</strong> bombardment producesthe radioactive isotope carb<strong>on</strong>-14. Cosmic ray are modulated by <str<strong>on</strong>g>solar</str<strong>on</strong>g> wind.
IPCC 2007N+A FsN Fs
IPCC 2007Since 1750 “anthropogenic forcing” has been 13 times larger thatthe <str<strong>on</strong>g>solar</str<strong>on</strong>g> forcing.?? IS IT TRUE ??
Topology of the <strong>climate</strong> system according to the IPCC modelsVolcano
A Realistic Topology of the Climate System
A Realistic Topology of the Climate System
<str<strong>on</strong>g>The</str<strong>on</strong>g> topological structure of the <strong>climate</strong> modelscurrently available is too simplistic!Ice core data prove the existence of several GHGfeedback mechanisms.<str<strong>on</strong>g>The</str<strong>on</strong>g> overall feedback is positive.Once that all mechanisms are included in the modelsthe expectati<strong>on</strong> is that the <str<strong>on</strong>g>solar</str<strong>on</strong>g> <str<strong>on</strong>g>effect</str<strong>on</strong>g> <strong>on</strong> <strong>climate</strong> will be foundmuch str<strong>on</strong>ger than the current estimateand the anthropogenic <str<strong>on</strong>g>effect</str<strong>on</strong>g> will be reduced.?? HOW MUCH ??
IPCC 2007Mann and J<strong>on</strong>es 20030.2K0.65KMoberg et al 2005
Three different TSI proxy rec<strong>on</strong>structi<strong>on</strong>s since 1610 by Lean et al.MaunderMinimumDalt<strong>on</strong>Minimum3.51.2
Wills<strong>on</strong>, R. C., and A. V. Mordvinov (2003), Secular total <str<strong>on</strong>g>solar</str<strong>on</strong>g> irradiance trend during <str<strong>on</strong>g>solar</str<strong>on</strong>g> cycles 21-23, Geophys. Res. Lett.,30(5)˫Frohlich C. and J. Lean (1998), <str<strong>on</strong>g>The</str<strong>on</strong>g> Sun's total irradiance: Cycles, trends and related <strong>climate</strong> change uncertainties since 1976, GRL.
Climate model approach:1) TSI defines TSI forcing.2) TSI forcing stimulates some TSI feedbacks predefined in the model.direct <str<strong>on</strong>g>solar</str<strong>on</strong>g> forcing + all <str<strong>on</strong>g>solar</str<strong>on</strong>g> feedbacks = total <str<strong>on</strong>g>solar</str<strong>on</strong>g> <str<strong>on</strong>g>effect</str<strong>on</strong>g>C<strong>on</strong>clusi<strong>on</strong>:weaker TSI forcing = weaker feedbacks = weaker total <str<strong>on</strong>g>solar</str<strong>on</strong>g> <str<strong>on</strong>g>effect</str<strong>on</strong>g>Climate Phenomenological approach:1) Temperature record shows a <str<strong>on</strong>g>solar</str<strong>on</strong>g> signature.2) Solar signature <strong>on</strong> <strong>climate</strong> defines the total <str<strong>on</strong>g>solar</str<strong>on</strong>g> <str<strong>on</strong>g>effect</str<strong>on</strong>g> <strong>on</strong> <strong>climate</strong>total <str<strong>on</strong>g>solar</str<strong>on</strong>g> <str<strong>on</strong>g>effect</str<strong>on</strong>g> = direct <str<strong>on</strong>g>solar</str<strong>on</strong>g> forcing + all <str<strong>on</strong>g>solar</str<strong>on</strong>g> feedbacksC<strong>on</strong>clusi<strong>on</strong>:Two methods, two philosophiestotal <str<strong>on</strong>g>solar</str<strong>on</strong>g> <str<strong>on</strong>g>effect</str<strong>on</strong>g> is unaltered, thusweaker TSI forcing = str<strong>on</strong>ger feedbacks
A PhenomenologicalSun-Climate Coupling Modeld∆Tsdt( t)α ∆I( t)− ∆T( t)=sτSolar InputN. Scafetta & BJ West,J. Geophys Research (2007).Geophys. Res. Lett. (2006).Geophys. Res. Lett. (2005).EarthClimateSystemSolar-InducedTemperatureOutput
CLIMATE RESPONSE to the 11-YEAR SOLAR CYCLEIPCC 2007, page 674
Climate sensitivity of the earth to <str<strong>on</strong>g>solar</str<strong>on</strong>g> irradianceWhite et al. JGR 1998.Douglass & Clader, GRL 29(16), 2002.Scafetta &West, GRL, 32 2005.A(11year cycle) = 0.1 K
Energy Balance Model Simulati<strong>on</strong>High frequencies are damped11-year cycle signature is 0.03K0.03K0.03KFoukal, P., G. North, andT. Wigley (2004), A StellarView <strong>on</strong> Solar Variati<strong>on</strong>sand Climate, Science, 306,68-69.
IPCC 2007 MYSTERIES??? 0.1K or 0.03K ???According to <str<strong>on</strong>g>phenomenological</str<strong>on</strong>g> studies the11-year <str<strong>on</strong>g>solar</str<strong>on</strong>g> cycle signature <strong>on</strong> the surfacetemperature is approximately 0.1KAccording to Energy Balance Model studiesthe 11-year <str<strong>on</strong>g>solar</str<strong>on</strong>g> cycle signature <strong>on</strong> the surfacetemperature is approximately 0.03KWhich <strong>on</strong>e is right?
A <str<strong>on</strong>g>phenomenological</str<strong>on</strong>g>/theoreticalsimple sun-<strong>climate</strong> EBMHigh frequencies are reducedbecause of the ocean inertiad∆T( t)α ∆I( t)−∆T( t)s=sdt τα = c<strong>on</strong>versi<strong>on</strong> c<strong>on</strong>stantτ = relaxati<strong>on</strong> time1) 11-year <str<strong>on</strong>g>solar</str<strong>on</strong>g> cycle signature<strong>on</strong> <strong>climate</strong> during 1980-2000= 0.10 K2) pre-industrial warming3)3)5 yearsyears< τ
1600-2005 P. Solar SignatureMaximum EstimatesPSS fitspre-industrial warming+ 11-year P. SignatureR= 0.45 & 0.76 (cross-corr)˫τ = 0.0 +/− 0.9 year (2000)˫τ = 3.5 +/− 1.4 year (2005)˫0.80.18R= 0.70 & 0.87 (cross-corr)˫τ = 2.8 +/− 1.2 year (2000)˫τ = 9 +/− 3.3 year (2005)˫0.80.4Since1900
1600-2005 P. Solar Signature(with ACRIM since 1980)PSSPSSfitsfitspre-industrialpre-industrialwarmingwarming+ 11-year P. Signatureτ = 0.0 +/− 0.9 year (2000)˫τ = 3.5 +/− 1.4 year (2005)˫0.80.3τ = 2.8 +/− 1.2 year (2000)˫τ = 9 +/− 3.3 year (2005)˫0.80.56Since1900
Schwartz (2007) JGR “Heat Capacity, time c<strong>on</strong>stant and sensitivity of Earth’s <strong>climate</strong> system”CORRECTED!Auto-Correlati<strong>on</strong> functi<strong>on</strong>
TSI Proxy by Krivova, Balmaceda, Solanki,Astr<strong>on</strong>omy and Astrophysics 467, 335-346 (2007).
1600-2007 P. Solar Signature to thewarming(with ACRIM or PMOD since 1978)PSS fitsτ = 8 year+ 11-year P. Signature
1600-2007 P. Solar Signature to thewarming(with ACRIM or PMOD since 1980)PSS fitsτ = 8 year+ 11-year P. SignatureComparis<strong>on</strong>: 22-year temperature and PSS<strong>com</strong>p<strong>on</strong>ents
CONCLUSIONSIf τ min= 5 +/- 1 years or more Mann et al.'s temperature and bothis not thermodynamically c<strong>on</strong>sistent with the 0.1K<str<strong>on</strong>g>phenomenological</str<strong>on</strong>g> <str<strong>on</strong>g>solar</str<strong>on</strong>g> signature <strong>on</strong> <strong>climate</strong>.During the 20 th century the sun might have c<strong>on</strong>tributed froma minimum of 31 +/- 8 % to a maximum of 52 +/- 21 %(with Moberg's temperature) of the observed warming.(<str<strong>on</strong>g>The</str<strong>on</strong>g>se estimates increase of 30% if ACRIM is adopted since1978)˫<str<strong>on</strong>g>The</str<strong>on</strong>g> above estimates are much larger than what has beenestimated by using EBM and GCM (IPCC 2007).
High frequencies are dampedOut of EquilibriumRelaxati<strong>on</strong> Effectsτ=9 years
Proxy TSI secular rec<strong>on</strong>structi<strong>on</strong>s using multiple <str<strong>on</strong>g>solar</str<strong>on</strong>g> indexesMaunderMinimumDalt<strong>on</strong>MinimumRec<strong>on</strong>structi<strong>on</strong>s of total <str<strong>on</strong>g>solar</str<strong>on</strong>g> irradiance (TSI) by Lean et al. (1995, solid red curve), Hoytand Schatten (1993, data updated by the authors to 1999, solid black curve), Solanki andFligge (1998, dotted blue curves), and Lockwood and Stamper (1999, heavy dash-dotgreen curve); the grey curve shows group sunspot numbers (Hoyt and Schatten, 1998)scaled to Nimbus-7 observati<strong>on</strong>s for 1979 to 1993.
Crowley, Science 289, 270-277 (2000).Red Curve (Mann et al. 1999)˫0.40.20-0.2-0.4-0.6'moberg-<strong>com</strong>b.dat'-0.81000 1200 1400 1600 1800 2000Green curve (Moberg et al. 2005)˫
Crowley, Science 289, 270-277 (2000).