

InSAR Stack Processing â Deformation Mapping in the Area of ...
InSAR Stack Processing â Deformation Mapping in the Area of ...
InSAR Stack Processing â Deformation Mapping in the Area of ...

You also want an ePaper? Increase the reach of your titles
YUMPU automatically turns print PDFs into web optimized ePapers that Google loves.
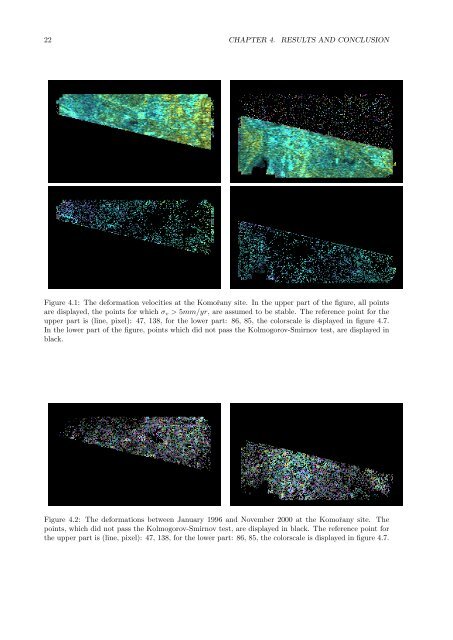
22 CHAPTER 4. RESULTS AND CONCLUSIONFigure 4.1: The deformation velocities at <strong>the</strong> Komořany site. In <strong>the</strong> upper part <strong>of</strong> <strong>the</strong> figure, all po<strong>in</strong>tsare displayed, <strong>the</strong> po<strong>in</strong>ts for which σ v > 5mm/yr, are assumed to be stable. The reference po<strong>in</strong>t for <strong>the</strong>upper part is (l<strong>in</strong>e, pixel): 47, 138, for <strong>the</strong> lower part: 86, 85, <strong>the</strong> colorscale is displayed <strong>in</strong> figure 4.7.In <strong>the</strong> lower part <strong>of</strong> <strong>the</strong> figure, po<strong>in</strong>ts which did not pass <strong>the</strong> Kolmogorov-Smirnov test, are displayed <strong>in</strong>black.Figure 4.2: The deformations between January 1996 and November 2000 at <strong>the</strong> Komořany site. Thepo<strong>in</strong>ts, which did not pass <strong>the</strong> Kolmogorov-Smirnov test, are displayed <strong>in</strong> black. The reference po<strong>in</strong>t for<strong>the</strong> upper part is (l<strong>in</strong>e, pixel): 47, 138, for <strong>the</strong> lower part: 86, 85, <strong>the</strong> colorscale is displayed <strong>in</strong> figure 4.7.