flow and thermal performance of a gas turbine nozzle guide vane
flow and thermal performance of a gas turbine nozzle guide vane
flow and thermal performance of a gas turbine nozzle guide vane

You also want an ePaper? Increase the reach of your titles
YUMPU automatically turns print PDFs into web optimized ePapers that Google loves.
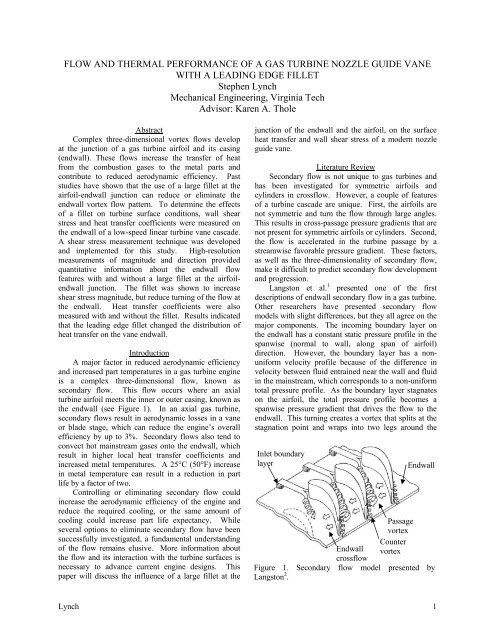
FLOW AND THERMAL PERFORMANCE OF A GAS TURBINE NOZZLE GUIDE VANEWITH A LEADING EDGE FILLETStephen LynchMechanical Engineering, Virginia TechAdvisor: Karen A. TholeAbstractComplex three-dimensional vortex <strong>flow</strong>s developat the junction <strong>of</strong> a <strong>gas</strong> <strong>turbine</strong> airfoil <strong>and</strong> its casing(endwall). These <strong>flow</strong>s increase the transfer <strong>of</strong> heatfrom the combustion <strong>gas</strong>es to the metal parts <strong>and</strong>contribute to reduced aerodynamic efficiency. Paststudies have shown that the use <strong>of</strong> a large fillet at theairfoil-endwall junction can reduce or eliminate theendwall vortex <strong>flow</strong> pattern. To determine the effects<strong>of</strong> a fillet on <strong>turbine</strong> surface conditions, wall shearstress <strong>and</strong> heat transfer coefficients were measured onthe endwall <strong>of</strong> a low-speed linear <strong>turbine</strong> <strong>vane</strong> cascade.A shear stress measurement technique was developed<strong>and</strong> implemented for this study. High-resolutionmeasurements <strong>of</strong> magnitude <strong>and</strong> direction providedquantitative information about the endwall <strong>flow</strong>features with <strong>and</strong> without a large fillet at the airfoilendwalljunction. The fillet was shown to increaseshear stress magnitude, but reduce turning <strong>of</strong> the <strong>flow</strong> atthe endwall. Heat transfer coefficients were alsomeasured with <strong>and</strong> without the fillet. Results indicatedthat the leading edge fillet changed the distribution <strong>of</strong>heat transfer on the <strong>vane</strong> endwall.IntroductionA major factor in reduced aerodynamic efficiency<strong>and</strong> increased part temperatures in a <strong>gas</strong> <strong>turbine</strong> engineis a complex three-dimensional <strong>flow</strong>, known assecondary <strong>flow</strong>. This <strong>flow</strong> occurs where an axial<strong>turbine</strong> airfoil meets the inner or outer casing, known asthe endwall (see Figure 1). In an axial <strong>gas</strong> <strong>turbine</strong>,secondary <strong>flow</strong>s result in aerodynamic losses in a <strong>vane</strong>or blade stage, which can reduce the engine’s overallefficiency by up to 3%. Secondary <strong>flow</strong>s also tend toconvect hot mainstream <strong>gas</strong>es onto the endwall, whichresult in higher local heat transfer coefficients <strong>and</strong>increased metal temperatures. A 25°C (50°F) increasein metal temperature can result in a reduction in partlife by a factor <strong>of</strong> two.Controlling or eliminating secondary <strong>flow</strong> couldincrease the aerodynamic efficiency <strong>of</strong> the engine <strong>and</strong>reduce the required cooling, or the same amount <strong>of</strong>cooling could increase part life expectancy. Whileseveral options to eliminate secondary <strong>flow</strong> have beensuccessfully investigated, a fundamental underst<strong>and</strong>ing<strong>of</strong> the <strong>flow</strong> remains elusive. More information aboutthe <strong>flow</strong> <strong>and</strong> its interaction with the <strong>turbine</strong> surfaces isnecessary to advance current engine designs. Thispaper will discuss the influence <strong>of</strong> a large fillet at thejunction <strong>of</strong> the endwall <strong>and</strong> the airfoil, on the surfaceheat transfer <strong>and</strong> wall shear stress <strong>of</strong> a modern <strong>nozzle</strong><strong>guide</strong> <strong>vane</strong>.Literature ReviewSecondary <strong>flow</strong> is not unique to <strong>gas</strong> <strong>turbine</strong>s <strong>and</strong>has been investigated for symmetric airfoils <strong>and</strong>cylinders in cross<strong>flow</strong>. However, a couple <strong>of</strong> features<strong>of</strong> a <strong>turbine</strong> cascade are unique. First, the airfoils arenot symmetric <strong>and</strong> turn the <strong>flow</strong> through large angles.This results in cross-passage pressure gradients that arenot present for symmetric airfoils or cylinders. Second,the <strong>flow</strong> is accelerated in the <strong>turbine</strong> passage by astreamwise favorable pressure gradient. These factors,as well as the three-dimensionality <strong>of</strong> secondary <strong>flow</strong>,make it difficult to predict secondary <strong>flow</strong> development<strong>and</strong> progression.Langston et al. 1 presented one <strong>of</strong> the firstdescriptions <strong>of</strong> endwall secondary <strong>flow</strong> in a <strong>gas</strong> <strong>turbine</strong>.Other researchers have presented secondary <strong>flow</strong>models with slight differences, but they all agree on themajor components. The incoming boundary layer onthe endwall has a constant static pressure pr<strong>of</strong>ile in thespanwise (normal to wall, along span <strong>of</strong> airfoil)direction. However, the boundary layer has a nonuniformvelocity pr<strong>of</strong>ile because <strong>of</strong> the difference invelocity between fluid entrained near the wall <strong>and</strong> fluidin the mainstream, which corresponds to a non-uniformtotal pressure pr<strong>of</strong>ile. As the boundary layer stagnateson the airfoil, the total pressure pr<strong>of</strong>ile becomes aspanwise pressure gradient that drives the <strong>flow</strong> to theendwall. This turning creates a vortex that splits at thestagnation point <strong>and</strong> wraps into two legs around theInlet boundarylayerEndwallPassagevortexCounterEndwall vortexcross<strong>flow</strong>Figure 1. Secondary <strong>flow</strong> model presented byLangston 2 .Lynch 1
pressure <strong>and</strong> suction sides <strong>of</strong> the <strong>turbine</strong> airfoil—this isthe horseshoe vortex. The portion <strong>of</strong> the horseshoevortex on the pressure side, known as the passagevortex, is augmented further by the inherent pressuregradient between airfoils (i.e., the pressure side <strong>of</strong> oneairfoil faces the suction side <strong>of</strong> its neighbor). Theportion <strong>of</strong> the horseshoe vortex that passes to thesuction side, known as the counter vortex, has anopposite sense <strong>of</strong> rotation to the passage vortex, <strong>and</strong>tends to orbit the passage vortex as it interacts with thepassage vortex downstream <strong>of</strong> the stagnation point(refer to Figure 1).Past research has shown that modifications to theleading edge <strong>of</strong> a <strong>gas</strong> <strong>turbine</strong> <strong>vane</strong> can reduce oreliminate some <strong>of</strong> the features <strong>of</strong> the secondary <strong>flow</strong>.Sauer et al. 3 used an asymmetric leading edge bulb tointensify the counter vortex, which resulted in a 50%reduction in aerodynamic losses at the exit <strong>of</strong> the <strong>vane</strong>passage. Zess <strong>and</strong> Thole 4 used computational fluiddynamics (CFD) to design an asymmetric leading edgefillet, which they later experimentally tested. Theirresearch indicated elimination <strong>of</strong> the leading edgehorseshoe vortex <strong>and</strong> an order <strong>of</strong> magnitude reductionin turbulent kinetic energy levels associated with vortexdevelopment. Becz et al. 5 studied two bulb designs aswell as an asymmetric elliptical fillet <strong>and</strong> found thatonly the fillet reduced overall total pressure loss. It alsoslightly reduced air<strong>flow</strong> turning, which agrees with thewall shear stress results <strong>of</strong> this study presented later.Other studies have considered the effects <strong>of</strong>leading-edge modifications on the <strong>thermal</strong> environment<strong>of</strong> the <strong>vane</strong> or blade. Shih <strong>and</strong> Lin 6 performedcomputational studies on two fillet designs with <strong>and</strong>without swirl in the incoming <strong>flow</strong> pr<strong>of</strong>ile. Their studyindicated the largest reduction <strong>of</strong> heat transfer on theairfoil <strong>and</strong> endwall <strong>and</strong> the least overall aerodynamicpenalty occurred with no fillet <strong>and</strong> inlet swirl.Leth<strong>and</strong>er et al. 7 successfully integrated optimizations<strong>of</strong>tware with a commercial CFD solver to design arelatively large fillet (with dimensions at the limits <strong>of</strong>their design space) that reduced surface temperatures onthe endwall. Han <strong>and</strong> Goldstein 8 used naphthalenesublimation to infer heat transfer distributions on theendwall through the heat <strong>and</strong> mass transfer analogy.Their linear asymmetric fillet, based on the optimaldesign by Zess <strong>and</strong> Thole, reduced the horseshoe vortexeffects but resulted in increased heat transfer near theleading edge endwall-airfoil junction due to intensifiedcorner vortices. Mahmood et al. 9 performed smoke<strong>flow</strong> visualization, took total pressure measurements,<strong>and</strong> obtained Nusselt number distributions on theendwall for four fillet geometries. Their resultsindicated a reduction in the leading edge vortex size<strong>and</strong> lower endwall heat transfer coefficients for all filletgeometries, with a concave elliptical geometry showingthe largest reduction in heat transfer.It is apparent from past studies that a modificationto the airfoil-endwall junction has some positive effectin optimizing the aerodynamic <strong>and</strong> heat transferenvironment <strong>of</strong> a <strong>gas</strong> <strong>turbine</strong> <strong>vane</strong>. Fillets have shownthe most promise; thus, this study focused onunderst<strong>and</strong>ing how that geometry influences the <strong>flow</strong>.To date, none <strong>of</strong> the studies have presentedmeasurements <strong>of</strong> heat transfer on the fillet surfaceitself. This surface would be <strong>of</strong> interest to <strong>turbine</strong>designers, since it would require additional cooling.Furthermore, wall shear stress has not beenexperimentally measured for <strong>vane</strong>s with airfoil-endwallmodifications. Wall shear stress may be a contributorto total pressure loss in a cascade. Measurements mayprovide further insight into the secondary <strong>flow</strong>reduction mechanisms <strong>of</strong> a fillet.Experimental DesignA large closed-loop, low-speed wind tunnel wasused to perform heat transfer <strong>and</strong> wall shear stressmeasurements on a scaled-up <strong>nozzle</strong> <strong>guide</strong> <strong>vane</strong> testsection. The <strong>flow</strong> is driven by a 50-hp axial fan, <strong>and</strong>passes through a primary heat exchanger to modulatethe overall <strong>flow</strong> temperature. It enters a splitter section,where <strong>flow</strong> can be diverted for <strong>vane</strong> coolingexperiments (not used in this study). The primary <strong>flow</strong>passes through several screens <strong>and</strong> a contractionsection, which can be used to simulate a <strong>gas</strong> <strong>turbine</strong>annular combustor. The <strong>flow</strong> enters the corner testsection, which contains the <strong>vane</strong>s for this study, <strong>and</strong>then passes back into the fan.The corner test section holds two full <strong>nozzle</strong> <strong>guide</strong><strong>vane</strong>s <strong>and</strong> a third partial <strong>vane</strong> connected to a flexiblewall. The sides <strong>of</strong> the test section contain bleeds toremove the sidewall boundary layers <strong>and</strong> ensure that the<strong>flow</strong> around the <strong>vane</strong>s is periodic. The <strong>vane</strong> design is athree-dimensional extrusion <strong>of</strong> the two-dimensionalmidspan airfoil geometry from the Pratt & WhitneyPW6000 <strong>turbine</strong> engine. The <strong>vane</strong> is scaled up by afactor <strong>of</strong> nine for high measurement resolution, <strong>and</strong> isinstrumented with static pressure taps at 40% <strong>of</strong> thespan (measured from the bottom endwall) to determinethe static pressure coefficient. A description <strong>of</strong> theTable 1 PW6000 <strong>nozzle</strong> <strong>guide</strong> <strong>vane</strong> geometry <strong>and</strong> <strong>flow</strong>parameters.Actual chord length 6.60 cm (2.6”)Scaling factor 9Scaled chord length (C) 59.4 cm (23.4”)Pitch/chord 0.77Span/chord 0.93Axial chord (C ax )/chord 0.48Inlet Reynolds number 2.2x10 5Flow inlet angle 0°Flow exit angle 78°Lynch 2
<strong>turbine</strong> <strong>vane</strong> parameters is given in Table 1.The bottom endwall surface <strong>of</strong> the corner testsection was manufactured out <strong>of</strong> a 2.54 cm (1”) thicksheet <strong>of</strong> Last-A-Foam FR-6706 low-density closed-cellpolyurethane foam, which has a very low <strong>thermal</strong>conductivity (0.0287 W/m-K). This material was usedto minimize conduction losses for the heat transferstudies. The endwall was instrumented with type-Ethermocouples in various locations throughout the <strong>vane</strong>passages, for calibration <strong>of</strong> the infrared images.The top endwall was made <strong>of</strong> acrylic, <strong>and</strong> hadthirteen image ports spaced around the test section. Thelayout <strong>of</strong> the image ports allowed overlap <strong>of</strong> infraredimages to create a full endwall temperature map. Eachimage port was sealed with a removable acrylic coverwhen an image was not being taken.Heat Transfer MeasurementsHeatexchangerAxial fanCorner testsection with <strong>vane</strong>sFigure 2. Schematic <strong>of</strong> the low-speed recirculatingwind tunnel used in this study.Endwall heat transfer measurements were taken ona constant heat flux plate attached to the endwall <strong>and</strong>fillet surfaces. The heaters, manufactured byElectr<strong>of</strong>ilm Manufacturing, consisted <strong>of</strong> a 37 µmcopper layer on top <strong>of</strong> a 75 µm thick kapton layer, inwhich 25 µm inconel elements were embedded in aserpentine pattern. The endwall heater had fourseparate circuits, three <strong>of</strong> which could be turned <strong>of</strong>fwhen a fillet geometry was installed over the top <strong>of</strong>them, so as to not introduce error in the determination<strong>of</strong> the fillet surface heat transfer. The heaters wereattached to the foam surfaces using double-sided tapeembedded in a very thin layer <strong>of</strong> silicone adhesive. E-type thermocouples embedded in the foam endwall <strong>and</strong>fillet surfaces were placed in contact with the bottomsurfaces <strong>of</strong> the heaters with Omegabond <strong>thermal</strong>cement.The heater top surfaces were painted with Krylonflat black paint, which has a nominal emissivity <strong>of</strong> 0.96,<strong>and</strong> enables good resolution <strong>of</strong> surface temperatureswith the infrared camera. Small crosses were etchedinto the paint on the endwall heater, for imagepositioning <strong>and</strong> thermocouple location determination.Three E-type ribbon thermocouples were attached tothe endwall heater top surface with Omegabond <strong>thermal</strong>cement. The ribbon thermocouples were used to checkthe calibration with the bottom-surface thermocouples.An infrared camera (Flir P20) was used to capturesurface temperatures on the heat flux plate. Infraredradiation emitted from the surface is converted totemperatures by the camera. Calibration <strong>of</strong> the imagedsurface temperatures was achieved by matchingacquired thermocouple measurements with the knownlocation <strong>of</strong> the thermocouple in an image. Ameasurement bias between the bottom-mountedthermocouple <strong>and</strong> the infrared top-surface measurementwas accounted for by a one-dimensional calculation <strong>of</strong>the <strong>thermal</strong> resistance <strong>of</strong> the heater. The bias <strong>of</strong> 0.5°Cwas slightly larger than the uncertainty <strong>of</strong> a type-Ethermocouple (±0.2°C).Infrared images were taken by sequentiallyremoving the inserts in the imaging locations on the topendwall <strong>and</strong> placing the camera (in a fixture) over theimaging location. Based on an uncertainty analysis, itwas determined that five images should be taken ateach location <strong>and</strong> averaged, where each image is alsoan average <strong>of</strong> 16 frames taken by the camera. Theviewing area <strong>of</strong> the camera on the heat flux surface was16.6 cm by 22.3 cm (6.5” x 8.78”), which it digitizedonto 240 by 320 pixels. Flir’s ThermaCam Researchers<strong>of</strong>tware was used to process the images <strong>and</strong> calibratethem. An in-house routine was developed to assemblethe individual images into a single map <strong>of</strong> the entireendwall.A particular goal <strong>of</strong> this study was to analyze theheat transfer on the fillet surface. However, imagingthe fillet is complicated by its three-dimensional nature.Perspective distortion is introduced, in which regions <strong>of</strong>the fillet closer to the camera appear larger than regionsfarther away. To correct this, crosses were etched intoFigure 3. Infrared images <strong>of</strong> the heat flux surfaceprovide surface temperatures. The images arecalibrated <strong>and</strong> assembled into an endwall map.Lynch 3
Figure 4. An infrared image <strong>of</strong> the foil grid used todetermine spatial transformation control points. The basis <strong>of</strong> oil film interferometry (OFI) is thebehavior <strong>of</strong> a thin oil film under the influence <strong>of</strong> shear.black paint on a stainless steel foil grid. The fillet wasMovement <strong>of</strong> the oil film can be dictated by shear on itswrapped with the foil grid <strong>and</strong> imaged with the infraredsurface, pressure gradients, gravity, <strong>and</strong> surface tension.camera. The grid provided control points for spatialIn many cases, such as for this study, shear is thetransformation <strong>of</strong> the fillet surface in the image. Thedominant force, by several orders <strong>of</strong> magnitude. Thecamera location was fixed so that subsequent imagesuse <strong>of</strong> light ray interferometry to measure the height <strong>of</strong>would be at the same location <strong>and</strong> orientation. Error inthe oil film as it is thinned by air<strong>flow</strong> can be used withsubsequent camera positioning was less than 4 pixelsa thin-oil film reduction <strong>of</strong> the Navier-Stokes equations(2.8 mm at the nominal focal distance <strong>of</strong> the endwall).for the oil, to obtain the shear acting on the oil.An in-house MATLAB code was developed toDerivation <strong>of</strong> the thin oil film equation consists <strong>of</strong>perform the spatial transformations. Thea mass <strong>and</strong> momentum balance on a differential controltransformations involved some distortion <strong>of</strong> the imagevolume through which oil convects. A mass balance onoutside <strong>of</strong> the control points, so only the portion <strong>of</strong> thethe control volume gives the height <strong>of</strong> the oil <strong>and</strong> thefillet surface within the grid was retained from theaverage convective velocity as functions <strong>of</strong> time <strong>and</strong>transformed images. Three-dimensional spatialspace. The x- <strong>and</strong> z-momentum fluid equations can betransformation enabled a realistic look at the fullsimplified by performing an order <strong>of</strong> magnitudesurface heat transfer. The capability also existed toanalysis to determine that the Reynolds number for theperform two-dimensional transformations by projectingoil film is much less than one. The inertial terms <strong>and</strong>the fillet surface to the endwall.streamwise viscous terms can then be neglected, whichThe input heat to the endwall <strong>and</strong> fillet surfacessimplifies the x- <strong>and</strong> z-momentum equations so thatwas calculated by measuring the voltage across a heatershear forces are balanced by pressure gradients <strong>and</strong>circuit, as well as the voltage across a precision resistorgravity. The momentum equations can be solved for(1Ω) in series with the circuit, which gave the current.the u <strong>and</strong> w oil velocities in terms <strong>of</strong> the pressureThe total power was divided by the area <strong>of</strong> the circuit togradient, gravity, <strong>and</strong> air<strong>flow</strong> shear by applying no-slipobtain the input heat flux. This flux was corrected forboundary conditions at the wall-oil interface, <strong>and</strong> theconduction <strong>and</strong> radiation losses, which accounted for amaximum <strong>of</strong> 0.2% <strong>and</strong> 21% <strong>of</strong> the input power,respectively. No correction due to conduction to the<strong>vane</strong> itself was performed, since the <strong>vane</strong> was alsoτw , x ∂Uconstructed <strong>of</strong> low-density closed-cell foam. TheU +remaining convective flux was used with the measured∂ xsurface temperatures to calculate heat transfercoefficients, which were normalized in the form <strong>of</strong> a∂hStanton number based on inlet mainstream velocity hdx h + ∂ xhSt =(1)ρC UU =1hyu dyp∞where h is the heat transfer coefficient (relatingconvective heat flux to temperature gradients betweenthe wall <strong>and</strong> the air), ρ is the density <strong>of</strong> air, C p is thespecific heat <strong>of</strong> air, <strong>and</strong> U ∞ is the freestream inletvelocity.Theory <strong>of</strong> Oil Film InterferometryA measurement technique for wall shear stress hadnot yet been developed in our laboratory. A methodknown as oil film interferometry was selected based onits robustness <strong>and</strong> simplicity. Holley <strong>and</strong> Langstonpresented oil film interferometry results for their lowspeedscaled-up <strong>turbine</strong> blade cascade 10 . They wereable to determine the unique features <strong>of</strong> endwallsecondary <strong>flow</strong> (saddle point, separation line).Naughton <strong>and</strong> Sheplak 11 present a very good description<strong>of</strong> the fundamentals <strong>and</strong> implementation considerations<strong>of</strong> the oil film interferometry technique.h∫0zFigure 5. Oil film control volume with x-directioncomponents shown.xLynch 4
desired shear at the air-oil interface. These velocitiesare related to the average convective velocities byintegrating over the height <strong>of</strong> the oil. Combining thevelocity distribution from momentum with the massbalance for the oil yields the thin oil-film equation2 3∂h∂ ⎛ τ⎞w,xh⎜h ⎧∂P⎫+ −⎟⎨ − ρgx ⎬∂t∂x2 3⎝ µ µ ⎩ ∂x⎭⎠(2)2⎛3∂ τ⎞w,zh⎜h ⎧∂P⎫+ −⎟ = 0⎨ − ρgz ⎬∂z2 3⎝ µ µ ⎩ ∂z⎭⎠For representative values pertinent to this study (h = 1µm, oil viscosity ν = 100 cSt, shear stress τ w = 10 Pa, oildensity ρ = 1000 kg/m 3 , dP/dx = 100 Pa/m, g x = 10m/s 2 ), order-<strong>of</strong>-magnitude analysis on the terms in theparentheses in Eq. (2) shows that the shear stress termis at least two orders <strong>of</strong> magnitude larger than the otherterms, which are then neglected. Knowledge <strong>of</strong> theheight <strong>of</strong> the oil as a function <strong>of</strong> space <strong>and</strong> time leads tothe wall shear that acted on the oil. For spatiallyconstant viscosity <strong>and</strong> shear stress (reasonableassumptions in this study because <strong>of</strong> the large scale <strong>and</strong>small measurement sizes), the reduced oil film equationcan be solved by separation <strong>of</strong> variables for the height<strong>of</strong> the oil. Such a solution requires measurement <strong>of</strong> theoil height only at the end <strong>of</strong> the wind tunnel run, sincethe conditions leading to the final oil film thickness areintegrated over time.Fizeau interferometry provides a means <strong>of</strong>measuring the height <strong>of</strong> the oil. Light strikes thesurface <strong>of</strong> the oil film <strong>and</strong> is reflected <strong>and</strong> refracted.The refracted rays are then reflected by the solidboundary at the lower surface <strong>of</strong> the oil <strong>and</strong> pass backout <strong>of</strong> the oil. The phase difference between theinitially reflected <strong>and</strong> refracted rays will attenuate oraugment the rays, creating interference b<strong>and</strong>s. Thephase difference is related to the height <strong>of</strong> the oil byλφ ⎛h = ⎜4π⎜⎝n2oil1− n2airsin2θi⎞⎟⎟⎠(3)where λ is the light wavelength, φ is the phasedifference, θ i is the incidence angle <strong>of</strong> the light, <strong>and</strong> n oil<strong>and</strong> n air are the indices <strong>of</strong> refraction <strong>of</strong> the oil <strong>and</strong> air,respectively. Examination <strong>of</strong> the interferograms relatedthe phase difference to the physical spacing <strong>of</strong> theb<strong>and</strong>s.The wall friction coefficient reported in this studyhas been normalized by the upstream dynamic pressure<strong>and</strong> is generally defined asτwCf=(4)1 2ρU2∞~500 nmLow-pressure sodium vaporlamp (monochromatic)θ Interference betweenilight raysAir<strong>flow</strong>h∆ x, φ = 2πDow Corning200 silicone oilNickel foil substrateFigure 6. Schematic <strong>of</strong> Fizeau interferometry techniqueon oil film.Implementation <strong>of</strong> Oil Film InterferometryThe reader is again referred to Naughton <strong>and</strong>Sheplak 11 for an excellent description <strong>of</strong>implementation considerations for the oil filminterferometry method. The major componentsrequired for oil film interferometry are a light source, acamera to capture images, a properly reflective surface,<strong>and</strong>, most importantly, oil.It is desirable to have a single wavelength <strong>of</strong> light,to eliminate noise in an interferogram <strong>and</strong> allow forprecise determination <strong>of</strong> the spacing <strong>of</strong> the patterns. Alaser is an ideal source; however, other less-costlysources can work just as well. A low-pressure sodiumvapor lamp, recognizable as a faded yellow street lamp,emits light at two very closely spaced wavelengths(589.0 nm, 589.6 nm). For this study, a low-pressuresodium vapor lamp from ABS Lighting was used toilluminate the oil films.The interferograms are typically on the order <strong>of</strong> 1mm (0.040”) between b<strong>and</strong>s, so high-resolutionimaging is necessary. A digital camera (Pentax *iSt DSdigital SLR) with a 75-300 mm zoom/macro lens wasFigure 7. A nickel foil patch on the endwall isilluminated in a fixture. Interferograms are analyzedfor shear stress direction <strong>and</strong> magnitude.Lynch 5
attached to a fixture. The fixture allowed formeasurement <strong>of</strong> the incident angle <strong>of</strong> light relative tothe oil film, <strong>and</strong> consistency in the positioning <strong>of</strong> thecamera.A highly reflective surface provides goodresolution <strong>of</strong> interference patterns without lowering thecontrast. Glass, Mylar, <strong>and</strong> polished steel have all beenfound to be good substrates, but polished aluminum isnot. Nickel <strong>and</strong> other foils can also work, especiallysince they can be moved to various regions <strong>of</strong> a largemodel without having to plate the entire model. Forthis study, 0.05 mm (0.002”) thick nickel foil with 14%tungsten (by weight) was cut into 7.6 cm by 3.81 cm(3” x 1.5”) rectangular patches, <strong>and</strong> adhered to thepainted surface <strong>of</strong> the heater with a sprayed-on layer <strong>of</strong>rubber cement. To ensure that the leading edge <strong>of</strong> thefoil did not interfere with the boundary layer, severaltests were performed in which the oil film was in thesame geometrical location, but the distance <strong>of</strong> the filmfrom the leading edge <strong>of</strong> the foil was varied. In allcases, the variation <strong>of</strong> measured skin friction was lessthan 9%, which is approximately the uncertainty <strong>of</strong> theoil film method.The choice <strong>of</strong> oil depends on the test conditions<strong>and</strong> the degree <strong>of</strong> uncertainty tolerable in the results.Typically, silicone oils (polydimethylsiloxane,commercially known as Dow Corning 200 Fluid) areused because <strong>of</strong> the relative insensitivity <strong>of</strong> theirviscosity with temperature, their transparency, <strong>and</strong> theease <strong>of</strong> removal from the model. Silicone oils can betailored to a wide range <strong>of</strong> viscosities by lengtheningthe polymer chain. Although the viscosity is lesssensitive to temperature than petroleum oils, it can stillvary by 2% per °C, which makes determination <strong>of</strong> theoil viscosity one <strong>of</strong> the largest terms in the uncertainty<strong>of</strong> the shear stress measurement. It is recommendedthat the viscosity <strong>of</strong> each batch <strong>of</strong> oil be measured toaccount for variations from the nominal viscosity.Naughton <strong>and</strong> Sheplak 11 provide a correlation thatrelates a reference measurement <strong>of</strong> oil viscosity over alarge range <strong>of</strong> temperatures. For this study, silicone oilin nominal viscosities <strong>of</strong> 100 cSt, 500 cSt, <strong>and</strong> 1000 cStwere used for shear stress measurements on the <strong>vane</strong>cascade endwall. Brian Holley performed referencemeasurements for each nominal viscosity, for thetemperature correction.The test procedure to obtain shear stressmeasurements consisted <strong>of</strong> several steps. First, a nickelfoil patch was cleaned <strong>and</strong> sprayed with the thin layer<strong>of</strong> rubber cement. It was affixed to the endwall in thedesired measurement location, which was recorded sothat the measurements could be converted to <strong>vane</strong>coordinates. Next, the nickel surface was cleaned <strong>and</strong>lightly polished to remove any cleaning fluid film. Asilicone dropper was dipped into the oil <strong>and</strong> smalldroplets (
St ∞Figure 9. Installation <strong>of</strong> the linear fillet tested in thisstudy.determine which have the largest effect on reducingendwall heat transfer <strong>and</strong> aerodynamic loss. To thatend, a test matrix <strong>of</strong> possible fillet designs wasdeveloped. Based on the success <strong>of</strong> the large linearpr<strong>of</strong>ilefillet <strong>of</strong> Leth<strong>and</strong>er et al. 7 , this fillet was chosenas a baseline for comparison with elliptical filletdesigns. Elliptical designs might be simpler tointegrally cast into a <strong>vane</strong> or blade shape withoutcreating stress concentration points where the filletmeets the endwall or airfoil. The fillet <strong>of</strong> Leth<strong>and</strong>er etal. is suited for parameter studies, since the focus <strong>of</strong> thatwork was an optimization <strong>of</strong> the fillet design formaximum <strong>thermal</strong> benefit.Due to the limits <strong>of</strong> time <strong>and</strong> the complexities <strong>of</strong>measuring heat transfer <strong>and</strong> shear stress on the nonconformablesurfaces <strong>of</strong> an elliptical fillet, results haveonly been obtained for the linear fillet. Future workwill include testing for other fillet configurations todetermine the dominant design parameters <strong>of</strong> a filletthat reduce endwall heat transfer <strong>and</strong> shear stress.Two complete fillets were machined out <strong>of</strong> thesame closed-cell foam as the endwall <strong>and</strong> instrumentedwith type-E thermocouples. One <strong>of</strong> the fillets was splitto go around the two side <strong>vane</strong>s. Kapton heaters, withthe same thickness <strong>and</strong> composition as the endwallheater, were attached to the fillet surfaces with doublesidedtape. The fillets were secured firmly to theendwall <strong>and</strong> airfoil, <strong>and</strong> sealed around their perimeterwith silicone.ResultsThe results for measurements <strong>of</strong> heat transfer onthe endwall, <strong>and</strong> on the fillet when installed, arepresented first. Shear stress measurements with <strong>and</strong>without the fillet are shown for the endwall only.Heat Transfer ResultsTo provide a baseline for comparison to the filletresults, measurements <strong>of</strong> endwall heat transfer for the(a)(b)Figure 10. Comparison <strong>of</strong> endwall heat transfermeasurements for this study (b), to Kang et al. 11 (a).unfilleted <strong>nozzle</strong> <strong>guide</strong> <strong>vane</strong> were taken. Kang et al. 11presented measurements <strong>of</strong> endwall heat transfer for thePW6000 <strong>vane</strong> geometry, which were compared to theresults from this experiment to determine that thebaseline case was displaying the correct trends. Figure10 shows contours <strong>of</strong> Stanton number for Kang et al.compared to this study. High contour values denotehigh heat transfer coefficients; heat can more easilymove into the endwall. Although there are some slightdifferences, particularly in the region directly upstream<strong>of</strong> the blades <strong>and</strong> along the flexible wall connected tothe lower <strong>vane</strong> (x/C = 0.5, y/C = 0.25), these are mostlikely due to different <strong>flow</strong> conditions for this study.Specifically, the endwall heater plate had a shorterupstream length, <strong>and</strong> the inlet boundary layer had adifferent shape due to previous combustor simulatormodifications. It can be seen from the baseline resultsthat the horseshoe vortex near the stagnation region <strong>of</strong>the <strong>vane</strong> causes increased heat transfer upstream <strong>of</strong> the<strong>vane</strong>. Also, the passage vortex, sweeping from thepressure to suction sides <strong>of</strong> adjacent airfoils, causeshigher heat transfer along the suction side <strong>of</strong> the <strong>vane</strong>.Figure 11 shows a three-dimensional view <strong>of</strong> themeasured heat transfer on an endwall with a linearfillet, compared to measurements on the unfilletedendwall. It is not immediately obvious that the fillethas reduced endwall heat transfer, especially on thesuction side <strong>of</strong> the fillet. However, the shapes <strong>of</strong> thecontours have changed, which indicates that the fillet isinfluencing the secondary <strong>flow</strong> <strong>and</strong> its interaction withthe surface. Regions <strong>of</strong> low Stanton number are shiftedmore to the pressure side <strong>of</strong> the endwall with the linearfillet. Also, the large gradient in heat transfer at thestagnation region <strong>of</strong> the <strong>vane</strong> has been somewhatreduced. Overall, the surface areas <strong>of</strong> the endwall <strong>and</strong>the near-wall airfoil region have decreased with theaddition <strong>of</strong> a fillet. Thus, even though the fillet doesnot dramatically reduce endwall heat transfer, it mayLynch 7
C f= 0.100(a)St∞=hρC Up∞C f= 0.050(b)Inlet <strong>flow</strong>directionFigure 12. Wall shear stress vectors show the saddlepoint (insert) <strong>and</strong> cross-passage <strong>flow</strong>.Figure 11. Comparison <strong>of</strong> endwall heat transfer with(b) <strong>and</strong> without (a) a large linear fillet.C f = 0.150reduce overall cooling requirements for the <strong>nozzle</strong><strong>guide</strong> <strong>vane</strong>.Wall Shear Stress ResultsA vector plot <strong>of</strong> wall shear stress on the endwall <strong>of</strong>the unfilleted <strong>vane</strong> is presented in Figure 12. Thevectors displayed in the figure were uniformly sampledfrom approximately 400 data points taken over theentire endwall. Several features <strong>of</strong> the endwall shearstress due to secondary <strong>flow</strong> are apparent. Sheardecreases as <strong>flow</strong> approaches the <strong>vane</strong> <strong>and</strong> stagnates.Flow washes down the airfoil <strong>and</strong> moves away from thebase <strong>of</strong> the airfoil in the horseshoe vortex. The saddlepoint, where the <strong>flow</strong> diverges around the <strong>vane</strong>, iswhere the incoming boundary layer separates <strong>of</strong>f <strong>of</strong> theendwall. Further in the passage, cross-passage <strong>flow</strong>sweeps from the pressure side <strong>of</strong> the lower airfoil to thesuction side on the adjacent airfoil. The turning at theendwall due to secondary <strong>flow</strong> is larger than for thebulk <strong>flow</strong> away from the wall, which smoothly followsthe airfoils.Figure 13 shows endwall shear stress vectorsoverlaid on the results from the unfilleted <strong>vane</strong>. In thestagnation region, it appears that the fillet is divertingBlue Linear filletRed No filletC f = 0.020Figure 13. Endwall shear stress with a linear fillet (bluevectors), with the unfilleted results overlaid (red vectors).Lynch 8
50Inviscid predictionwith no filletVane with linear filletVane with no filletcooling requirements, although this conclusion wouldrequire knowledge <strong>of</strong> the airfoil surface heat transferwith <strong>and</strong> without the fillet.C p-5-10-15-20-25-30-1 -0.5 0 0.5 1s/CFigure 14. Static pressure coefficient around the <strong>vane</strong> at40% span, showing the acceleration <strong>of</strong> the <strong>flow</strong> on thesuction side due to the fillet.<strong>flow</strong> around the <strong>vane</strong> farther upstream. This may meanthat the horseshoe vortex has not been eliminated, buthas been displaced away from the <strong>vane</strong>. In the passage,the endwall shear for the linear fillet case is larger thanthe unfilleted case, which is unfortunate since wallshear is thought to be a contributor to total pressure loss(aerodynamic efficiency reduction) in a <strong>gas</strong> <strong>turbine</strong>.However, the increase is not unexpected since the filletreduces the <strong>flow</strong> area <strong>of</strong> the <strong>nozzle</strong> <strong>guide</strong> <strong>vane</strong> passage,causing <strong>flow</strong> to accelerate more rapidly. The staticpressure coefficient around the <strong>vane</strong>, shown in Figure14, supports this argument. The more interesting resultfrom the linear fillet endwall shear is the turning <strong>of</strong> theendwall <strong>flow</strong>. The linear fillet begins to turn thepassage <strong>flow</strong> sooner than in the unfilleted case, but theoverall turning when the <strong>flow</strong> exits the <strong>vane</strong> passage isreduced. This may indicate a weaker passage vortexstructure. Flowfield measurements should be taken toconfirm this.ConclusionsA wall shear stress method was developed <strong>and</strong>benchmarked for this study. High-resolutionmeasurements on the scaled-up <strong>nozzle</strong> <strong>guide</strong> <strong>vane</strong>provided quantitative information about the endwallsecondary <strong>flow</strong> features. When a fillet was added to theairfoil-endwall junction, the shear stress magnitude inthe passage increased, but the overturning due to thepassage vortex decreased, indicating possibly weakersecondary <strong>flow</strong>.The addition <strong>of</strong> a fillet was shown to change thelayout <strong>of</strong> the endwall surface heat transfer coefficients,shifting regions <strong>of</strong> low heat transfer to the pressure side<strong>of</strong> the airfoil. The reduced surface area <strong>of</strong> the endwallairfoiljunction with a fillet may mean reduced partAcknowledgmentsThe authors gratefully acknowledge the support <strong>of</strong>the National Science Foundation’s GOALI (GrantOpportunities for Academic Liaisons with Industry)program, <strong>and</strong> the Virginia Space Grant Consortium.Dr. Lee Langston <strong>and</strong> Brian Holley at theUniversity <strong>of</strong> Connecticut provided silicone oil <strong>and</strong>nickel foil, <strong>and</strong> were instrumental in our development<strong>of</strong> the OFI method.Kaitlin Keim from Virginia Tech assisted in thedevelopment <strong>of</strong> the OFI method <strong>and</strong> performed thebenchmarking experiments.Industrial input was provided by Joel Wagner <strong>and</strong>Peter Tay at Pratt & Whitney Engines in Hartford,Connecticut.References1 Langston, L.S., Nice, M.L., Hooper, R.M, 1977,“Three-Dimensional Flow Within a Turbine CascadePassage,” ASME Journal <strong>of</strong> Engineering for Power,Vol. 102, pp. 21-28.2 Langston, L.S., 1980, “Cross<strong>flow</strong>s in a TurbineCascade Passage,” ASME Journal <strong>of</strong> Engineering forPower, Vol. 102, pp. 866-874.3 Sauer. H., Muller, R., Vogeler, K., 2000, “Reduction<strong>of</strong> Secondary Flow Losses in Turbine Cascades byLeading Edge Modifications at the Endwall,” ASMEPaper 2000-GT-0473.4 Zess, G.A., Thole, K.A., 2002, “Computational Design<strong>and</strong> Experimental Evaluation <strong>of</strong> Using a Leading EdgeFillet on a Gas Turbine Vane,” ASME Journal <strong>of</strong>Turbomachinery, Vol. 124, pp. 167-175.5 Becz, S., Majewski, M.S., Langston, L.S., 2004, “AnExperimental Investigation <strong>of</strong> Contoured LeadingEdges for Secondary Flow Loss Reduction,” ASMEPaper GT2004-53964.6 Shih, T.I-P., Lin, Y.-L., 2002, “Controlling Secondary-Flow Structure by Leading-Edge Airfoil Fillet <strong>and</strong> InletSwirl to Reduce Aerodynamic Loss <strong>and</strong> Surface HeatTransfer,” ASME Paper GT-2002-30529.7 Leth<strong>and</strong>er, A.T., Thole, K.A., Zess, G.A., Wagner, J.,2003, “Optimizing the Vane-Endwall Junction toReduce Adiabatic Wall Temperatures in a TurbineVane Passage,” ASME Paper GT2003-38940.Lynch 9
8 Han, S., Goldstein, R.J., 2005, “Influence <strong>of</strong> BladeLeading Edge Geometry on Turbine Endwall Heat(Mass) Transfer,” ASME Paper GT2005-68590.9 Mahmood, G.I., Gustafson, R., Acharya, S., 2005,“Experimental Investigation <strong>of</strong> Flow Structure <strong>and</strong>Nusselt Number in a Low-Speed Linear Blade PassageWith <strong>and</strong> Without Leading-Edge Fillets,” ASMEJournal <strong>of</strong> Heat Transfer, Vol. 127, pp. 499-512.10 Holley, B.M., Becz, S., Langston, L.S., 2005,“Measurement <strong>and</strong> Calculation <strong>of</strong> Turbine CascadeEndwall Pressure <strong>and</strong> Shear Stress,” ASME PaperGT2005-68256.11 Naughton, J.W., Sheplak, M., 2002, “ModernDevelopments in Shear-Stress Measurement,” Progressin Aerospace Sciences, Vol. 38, pp. 515-570.12 Kang, M.B., Kohli, A., Thole, K.A., 1999, “HeatTransfer <strong>and</strong> Flowfield Measurements in the LeadingEdge Region <strong>of</strong> a Stator Vane Endwall,” ASME Paper98-GT-173.(b)Lynch 10