
You also want an ePaper? Increase the reach of your titles
YUMPU automatically turns print PDFs into web optimized ePapers that Google loves.
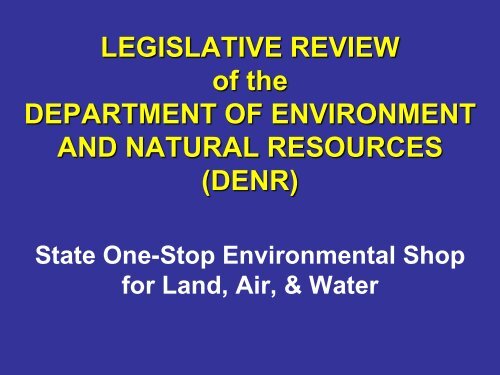
“BACK THEN”Federal environmental programsbegan 30 to 40 years ago:•1970 – Federal Clean Air Act•1972 – Water Pollution Control Act•1974 – Federal Safe Drinking Water•1976 – Federal ResourceConservation and Recovery Act
“Back Then” - South Dakota’sNumber One Pollution ProblemBACK THEN• Whitewood Creek• Homestake Miningdischarged rawmine tailings
Whitewood CreekBACK THEN• Daily pollutant loads in tailings:• 300 pounds of Cyanide• 240 pounds of Zinc• 70 pounds of Copper• 2,700 tons of Solids• Pollution stretched from WhitewoodCreek, to the Belle Fourche River, to theCheyenne, and to Missouri River
Whitewood CreekBACK THEN• Pollution not just industrial wastewater– cities of Lead and Deadwood had nowastewater treatment– raw sewage discharged directly intoWhitewood Creek too
Whitewood Creek Cleanup• Homestake - $20 million cleanup– 1977 - Grizzly Gulch tailings dam– 1985 - Innovative state-of-the-artcyanide treatment plant
Whitewood Creek Cleanup• Lead/Deadwood Sanitary District– 1978 – innovative, fully enclosedwastewater treatment plant
Whitewood CreekBACK THEN• 1976 – dead streamNOW• A first-class, blueribbon trout stream
Wastewater Treatment StatewideBACK THEN• 1976 – WhitewoodCreek was not theonly polluted stream– municipalities hadelementary treatment– poor quality effluent– frequent fish kills
Wastewater TreatmentBACK THEN• 1976 – poor qualityNOW• Major municipalitieshave advanced -tertiary plants• High effluent quality• No fish kills for years
Safe Drinking WaterBACK THEN• 1976 – Safewater determinedby about 20 tests
Safe Drinking WaterBACK THEN• 1976 - About 20 parametersNOW• Test for more than 90 parameters• No drinking water related healthoutbreaks since 1997
Rural Water SystemsBACK THEN• 1967 – Rapid Valley (just east ofRapid City) is first rural watersystem in South Dakota
Rural Water SystemsNOW• Rural water nearly blankets the state• Thousands of rural users; 237 towns• Reliable, high quality, safe water
Quality Drinking Water BringsEconomic SuccessesBACK THEN• 1988 – 1 small ethanol plant in SD
Quality Drinking Water BringsEconomic SuccessesPermitted Ethanol Production Facilities!(RosholtIpswich!(Aberdeen!( !(GrotonBig Stone City!(!(Redfield!(WatertownNOWLegend!( Permitted Ethanol Plants In OperationXW Permitted Ethanol Plants Not In Operation• 16 ethanol plants; 1 billion gallons• About half use rural waterHuron!( !(!(ScotlandMitchellMarion!(!(!( XY !(ParkerMadisonAuroraXWChancellor!(ShermanHudson
State Water FundingBACK THEN• 1992 – no coordinated water funding- individual water projects cameto Appropriations Committee- annual fights for funding
State Water FundingBACK THEN• 1992 - Annual legislative fightsNOW• 1993 – Dedicated Water Funding• State water plan developed byBoard of Water & Natural Resources• Governor’s Omnibus Water Bill
Ground WaterBACK THEN1974 – ground water was primarywater supply, but we had little or noknowledge about:• quantity• quality• location• potential pollution sources
Ground Water/GeologyBACK THEN• 1976 – little knowledgeNOW• <strong>DENR</strong> operatesTest hole at a medical waste site, Mellette County; September 1990monitoring networks– quantity– quality• Aquifer mapping
Ground Water/GeologyNOW• Ground water & wellconstruction standards• Pollution sourcesregulated/removed• Water rights protects usesBOTTOM LINE:Ground water protectedfor future generations
BACK THENAir Quality1979 – Rapid City nearly in violation(nonattainment) due to high dust levelsNOWSouth Dakota 1 ofonly 13 states infull attainment ofstandards
Solid Waste DisposalBACK THEN• 1990 – 190 smoldering dumps withno pollution controls; no recycling
Solid Waste DisposalBACK THEN• 1990 – 190 smoldering dumpsNOW• 15 regional landfills in full compliancewith federal solid waste rules• Recycling in many municipalities
SUMMARYBACK THEN• Higher risks to public health• Higher air, land, and water pollutionNOW• Lower risks to public health• Cleaner air, land, and water
FTE198619871988198919901991199219931994199519961997199819992000200120022003200420052006200720082009201020112012Accomplishments - Fewer PeopleBACK THEN1987 - 5 Divisions210- 204.5 FTE205204.8<strong>DENR</strong> BUDGETED FTE HISTORY200195200.8199.8 197.3195.3196.3200.3198.3198.3190188.3NOW185• 2 Divisions• 174.7 FTE180175170174.5 174.5 174.5 173.5 173.5174.5 174.5 174.5172.5 172.5173.5176.5174.7176.5 176.5
<strong>DENR</strong> Employees Get the Job Done!The <strong>DENR</strong> Team today:• 174.7 FTE• Engineers, scientists, geologists,hydrologists, and support staff• 46• 17- average age- average years of service• Experience, expertise, & dedicationmake <strong>DENR</strong> employees environmentalnatural resource experts in SD
End of <strong>DENR</strong>’S Past
<strong>DENR</strong>On To Present & Future Challenges