Cognitive Reflection and Decision Making - to open FTP session ...
Cognitive Reflection and Decision Making - to open FTP session ...
Cognitive Reflection and Decision Making - to open FTP session ...

You also want an ePaper? Increase the reach of your titles
YUMPU automatically turns print PDFs into web optimized ePapers that Google loves.
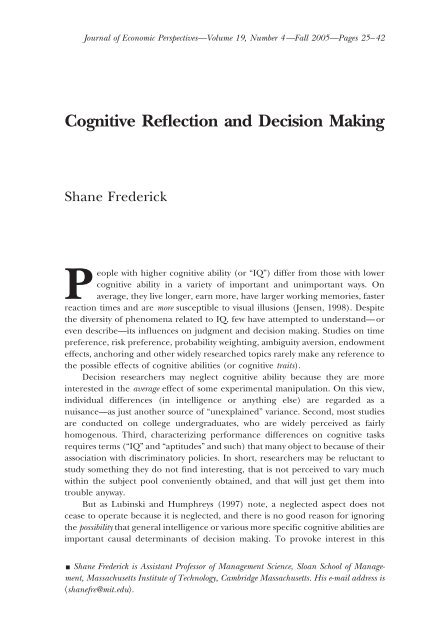
28 Journal of Economic Perspectivesthought the problem was <strong>to</strong>o easy <strong>to</strong> miss. Fourth, respondents do much better onanalogous problems that invite more computation. For example, respondents missthe “bat <strong>and</strong> ball” problem far more often than they miss the “banana <strong>and</strong> bagel”problem: “A banana <strong>and</strong> a bagel cost 37 cents. The banana costs 13 cents more thanthe bagel. How much does the bagel cost?”The CRT was administered <strong>to</strong> 3,428 respondents in 35 separate studies over a26-month period beginning in January 2003. Most respondents were undergraduatesat various universities in the midwest <strong>and</strong> northeast who were paid $8 <strong>to</strong>complete a 45-minute questionnaire that included the CRT <strong>and</strong> measures ofvarious decision-making characteristics, like time <strong>and</strong> risk preferences. 3 On thepage on which the CRT appeared, respondents were <strong>to</strong>ld only: “Below are severalproblems that vary in difficulty. Try <strong>to</strong> answer as many as you can.”Table 1 shows the mean scores at each location <strong>and</strong> the percentage answering0, 1, 2 or 3 items correctly. Most of the analyses that follow compare the “low” group(those who scored 0 out of 3) with the “high” group (those who scored 3 out of 3).The two “intermediate” groups (those who scored a1or2)typically fell betweenthe two extreme groups on whatever dependent measure was analyzed. Thus,focusing attention on the two “extreme” groups simplifies the exposition <strong>and</strong>analysis without affecting the conclusions.Since more of the respondents were college students from selective schools,the two “extreme” groups that formed the basis for most statistical comparisonswere far more similar in cognitive abilities than two extreme groups formed fromthe general population. Thus, the group differences reported here likely understatethe differences that would have been observed if a more representative sample hadbeen used.<strong>Cognitive</strong> <strong>Reflection</strong> <strong>and</strong> Time PreferencesThe notion that more intelligent people are more patient—that they devalueor “discount” future rewards less—has prevailed for some time. For example, in hisNew Principles of Political Economy (1834, pp. 57), Rae writes: “The strength of theintellectual powers, giving rise <strong>to</strong> reasoning <strong>and</strong> reflective habits. . . brings before usthe future. . . in its legitimate force, <strong>and</strong> urge the propriety of providing for it.”The widely presumed relation between cognitive ability <strong>and</strong> patience has beentested in several studies, although rather unsystematically. Melikian (1959) askedchildren from five <strong>to</strong> twelve years of age <strong>to</strong> draw a picture of a man, which theycould exchange for either 10 fils (about 3 cents) or for a “promissory note”redeemable for 20 fils two days later. Those who opted for the promissory notescored slightly higher on an intelligence test based on an assessment of those3 There were three exceptions <strong>to</strong> this: 1) the participants from Carnegie Mellon University completedthe survey as part of class; 2) the 4 th of July participants received “only” a frozen ice cream bar; <strong>and</strong> 3) theparticipants from the web study were unpaid, although they were entered in<strong>to</strong> a lottery for iPods <strong>and</strong>other prizes.
<strong>Cognitive</strong> <strong>Reflection</strong> <strong>and</strong> <strong>Decision</strong> <strong>Making</strong> 29Table 1CRT Scores, by LocationPercentage scoring 0, 1, 2 or 3Locations at which data were collectedMean CRT score“Low”0 1 2“High”3N Massachusetts Institute of Technology 2.18 7% 16% 30% 48% 61Prince<strong>to</strong>n University 1.63 18% 27% 28% 26% 121Bos<strong>to</strong>n fireworks display a 1.53 24% 24% 26% 26% 195Carnegie Mellon University 1.51 25% 25% 25% 25% 746Harvard University b 1.43 20% 37% 24% 20% 51University of Michigan: Ann Arbor 1.18 31% 33% 23% 14% 1267Web-based studies c 1.10 39% 25% 22% 13% 525Bowling Green University 0.87 50% 25% 13% 12% 52University of Michigan: Dearborn 0.83 51% 22% 21% 6% 154Michigan State University 0.79 49% 29% 16% 6% 118University of Toledo 0.57 64% 21% 10% 5% 138Overall 1.24 33% 28% 23% 17% 3428Notes: a Respondents in this study were people picnicking along the banks of the Charles River prior <strong>to</strong>the July 4 th fireworks display. Their ages ranged from 15 <strong>to</strong> 63, with a mean of 24. Many of the youngerparticipants were presumably students at a college in the Bos<strong>to</strong>n or Cambridge area. Most completed thesurvey in small groups of friends or family. Although they were requested not <strong>to</strong> discuss it until everyonein their group had completed it, some may have. (This, presumably, would elevate the CRT scoresrelative <strong>to</strong> most of the other studies in which participation was more closely supervised.)b The participants in this study were all members of a student choir group, which was predominatelyfemale. Unlike the other locations in which the numbers of men <strong>and</strong> women were comparable, 42 of 51participants in this study were women.c These were participants in two online studies, consisting of both college students <strong>and</strong> others whosee-mail addresses were obtained from online retailers.drawings. 4 Funder <strong>and</strong> Block (1989) paid 14 year-olds <strong>to</strong> participate in six experimental<strong>session</strong>s. For each of the first five <strong>session</strong>s, they could choose betweenreceiving $4 or foregoing (“investing”) their $4 payment for $4.80 in the sixth <strong>and</strong>final <strong>session</strong>. The teenagers with higher IQs chose <strong>to</strong> invest more of their money.In a follow-up <strong>to</strong> an extensive series of experiments investigating the ability ofpreschool children <strong>to</strong> delay gratification (Mischel, 1974), Shoda, Mischel <strong>and</strong>Peake (1990) found that the children who had waited longer before succumbing <strong>to</strong>the impulse <strong>to</strong> take an immediately available inferior reward scored higher on theirSATs taken over a decade later. Similarly, Parker <strong>and</strong> Fischhoff (2005) found thatscores on a vocabulary test taken around age eleven predicted the individual’stendency, at around age 18, <strong>to</strong> prefer a larger later reward over a smaller soonerone (for example, $120 in four weeks <strong>to</strong> $100 <strong>to</strong>morrow). Using small real rewards,Benjamin <strong>and</strong> Shapiro (2005) found that respondents with higher SAT math scores4 Given the relatively wide range of ages in this study, it remains unclear whether this relation isattributable <strong>to</strong> intelligence, per se, or <strong>to</strong> age, which might correlate with the development of artistic skillor patience or trust or some other specific trait that can be distinguished from cognitive ability.
30 Journal of Economic Perspectives(or their Chilean equivalent) were more likely <strong>to</strong> choose a larger later reward overa smaller sooner one (for example, <strong>to</strong> prefer a postdated check for $5.05 over a$5.00 check that can be immediately cashed). However, Monterosso et al. (2001)found no relation between the IQ of cocaine addicts <strong>and</strong> their imputed discountrates, <strong>and</strong> Kirby, Wins<strong>to</strong>n <strong>and</strong> Santiesteban (2005) found no reliable relationbetween students’ SAT scores <strong>and</strong> the amount they would bid for a delayedmonetary reward (although they did find that college grade point averages correlatedpositively with those bids).Collectively, these studies support the view that cognitive ability <strong>and</strong> timepreference are somehow connected, though they have not generally focused on thetypes of intertemporal decisions over which cognitive ability exerts influence, norexplained why it does so. 5 Toward this end, I examined the relation between CRTscores <strong>and</strong> various items intended <strong>to</strong> measure different aspects of “time preference.”As shown in Table 2, these included several hypothetical choices between animmediate reward <strong>and</strong> a larger delayed reward (items a through e), an immediatereward <strong>and</strong> a sequence of delayed rewards (items f through h), a shorter moreimmediate massage <strong>and</strong> longer more delayed massage (item i) <strong>and</strong> a smallerimmediate loss or a larger delayed loss (items j <strong>and</strong> k). 6 Item l asked respondents<strong>to</strong> state their maximum willingness <strong>to</strong> pay <strong>to</strong> have a book shipped overnight ratherthan waiting two weeks. Item m involved real money. Through a series of choices,respondents specified the smallest amount of money in four days that they wouldprefer <strong>to</strong> $170 in two months, <strong>and</strong> one of them was selected <strong>to</strong> actually receive oneof their choices. Items n through q asked respondents <strong>to</strong> report their impulsivity,procrastination, preoccupation with their future <strong>and</strong> concerns about inflation onan 11-point scale ranging from –5 (much less than the average person taking thissurvey <strong>to</strong>day) <strong>to</strong> 5 (much more than the average person taking this survey <strong>to</strong>day). 7Table 2 shows the responses of the low <strong>and</strong> high CRT groups for each of the17 items. The reported value is either the percentage choosing the patient optionor the mean response. The subscripts are the <strong>to</strong>tal number of respondents in thelow <strong>and</strong> high CRT groups who answered that item. The rightmost column reportsthe level of statistical significance of group differences—the p-values from a chisquaretest (for dicho<strong>to</strong>mous responses) or a t-test (for continuous responses).Those who scored higher on the CRT were generally more “patient”; theirdecisions implied lower discount rates. For short-term choices between monetaryrewards, the high CRT group was much more inclined <strong>to</strong> choose the later larger5 Shoda, Mischel <strong>and</strong> Peake (1990) examined preschoolers’ willingness <strong>to</strong> wait (for additional marshmallows<strong>and</strong> pretzels <strong>and</strong> such) under four experimental conditions. They found that patience predictedSAT scores in only one of their four conditions—when the attractive but inferior reward wasvisually exposed <strong>and</strong> no distraction technique (such as “think fun”) was suggested. In the other threeconditions, patient behavior was actually negatively correlated with subsequent SAT scores.6 I assumed that delaying the extraction of a <strong>to</strong>oth involved a larger delayed loss, because during theintervening two weeks, one will suffer additional <strong>to</strong>othache pain, or additional disutility from dreadingthe forthcoming extraction pain, <strong>and</strong> that the only reason for not doing it immediately was that futurepain was discounted relative <strong>to</strong> immediate pain.7 Among the items in Table 2, men were more patient for items c, k <strong>and</strong> l, <strong>and</strong> they worried more aboutinflation. There were no significant differences between men <strong>and</strong> women for any other item.
Shane Frederick 31Table 2Intertemporal Behavior for Low <strong>and</strong> High CRT Groups(percentage choosing patient option or mean response)CRT groupItemIntertemporal Choice or JudgmentLowHighStat. Signif.a $3400 this month or $3800 next month 35% 611 60% 196 p 0.0001b $100 now or $140 next year 22% 409 37% 297 p 0.0001c $100 now or $1100 in 10 years 47% 283 57% 208 p 0.05d $9 now or $100 in 10 years 40% 364 46% 277 p 0.10e $40 immediately or $1000 in 10 years 50% 135 59% 83 n.s.f $100 now or $20 every year for 7 years 28% 60 43% 28 n.s.g $400 now or $100 every year for 10 years 64% 44 72% 43 n.s.h $1000 now or $100 every year for 25 years 52% 295 49% 99 n.s.i 30 min. massage in 2 weeks or 45 min. massage in Nov. 28% 272 27% 126 n.s.j Lose $1000 this year or lose $2000 next year 78% 166 73% 86 n.s.k Tooth pulled <strong>to</strong>day or <strong>to</strong>oth pulled in 2 weeks 59% 430 65% 242 n.s.l Willingness <strong>to</strong> pay for overnight shipping of chosen book $4.54 150 $2.18 163 p 0.0001m Smallest amount in 4 days preferred <strong>to</strong> $170 in 2 months $116 72 $133 82 p 0.01n How impulsive are you? 1.01 110 0.21 47 p 0.001o How much do you tend <strong>to</strong> procrastinate? 1.05 110 1.06 47 n.s.p How much do you think about your future? 2.49 110 1.64 47 p 0.01q How much do you worry about inflation? 1.16 110 0.11 47 p 0.01reward (see items a <strong>and</strong> b). However, for choices involving longer horizons (itemsc through h), temporal preferences were weakly related or unrelated <strong>to</strong> CRT scores.A tentative explanation for these results is as follows: a thoughtful respondentcan find good reasons for discounting future monetary outcomes at rates exceedingthe prevailing interest rate—the promiser could default, one may be predictablywealthier in the future (with correspondingly diminished marginal utility forfurther wealth gains), interest rates could increase (which increases the opportunitycost of foregoing the immediate reward), <strong>and</strong> inflation could reduce the futurerewards’ real value (if the stated amounts are interpreted as being denominated innominal units). 8 Collectively, these reasons could, for example, justify choosing $9now over $100 in 10 years (item d), even though the implied discount rate of sucha choice (27 percent), exceeds market interest rates. However, such reasons are notsufficiently compelling <strong>to</strong> justify choosing $3400 this month over $3800 next month(which implies an annual discount rate of 280 percent). Hence, one observesconsiderable differences between CRT groups for choices like those in items a <strong>and</strong>b, where more careful deliberation or “cognitive reflection” should argue stronglyin favor of the later larger reward, but negligible differences for many of the otheritems, for which additional reflection would not make such a strong case for thelarger later reward (although one might argue that additional reflection should8 Frederick, Loewenstein <strong>and</strong> O’Donoghue (2002) offer a detailed <strong>and</strong> extended discussion of theconceptual dissection of imputed discount rates <strong>and</strong> discuss many reasons why choices betweenmonetary rewards are problematic for measuring pure time preference.
32 Journal of Economic Perspectivesreveal the wisdom of choosing the delayed 45-minute massage, since one will likelystill be alive, still be stressed <strong>and</strong> sore, still like massages, <strong>and</strong> still derive greaterbenefits from longer ones).It appears that greater cognitive reflection fosters the recognition or appreciationof considerations favoring the later larger reward (like the degree <strong>to</strong> whichthe implied interest rate exceeds the rate offered by the market). However, itremains unclear whether cognitive reflection also influences other determinants ofintertemporal choices (like pure time preference). CRT scores were unrelated <strong>to</strong>preferences for the massage <strong>and</strong> <strong>to</strong>oth-pull items, which were intended as measuresof pure time preference. On the other h<strong>and</strong>, those in the low CRT group (the“cognitively impulsive”) were willing <strong>to</strong> pay significantly more for the overnightshipping of a chosen book (item l), which does seem like an expression of an aspec<strong>to</strong>f pure time preference (the psychological “pain” of waiting for something desired).Thus, despite the wide variety of items included <strong>to</strong> help address this issue,further resolution of the types of psychological characteristics associated withcognitive reflection (<strong>and</strong> other cognitive abilities) is still required. Toward this goal,respondents in some of the later studies were also asked <strong>to</strong> report several personalitycharacteristics that seemed relevant <strong>to</strong> intertemporal choices (items n throughq). The self-perceived tendency <strong>to</strong> procrastinate was unrelated <strong>to</strong> CRT scores (bothgroups thought that they procrastinate more than their peers). However, the highCRT group perceived themselves <strong>to</strong> be significantly less impulsive, more concernedabout inflation <strong>and</strong> (curiously) less preoccupied with their future. The inflationresult supports the idea that the high-scoring groups are more likely <strong>to</strong> considersuch background fac<strong>to</strong>rs in their choices between temporally separated monetaryrewards. Its interpretation, however, is ambiguous, since it implies a considerationof future conditions, but would be a justification for choosing the proximatereward.<strong>Cognitive</strong> <strong>Reflection</strong> <strong>and</strong> Risk PreferencesIn the domain of risk preferences, there is no widely shared presumptionabout the influences of cognitive ability <strong>and</strong> almost no research on the <strong>to</strong>pic.Donkers, Melenberg <strong>and</strong> van Soest (2001) found that more educated respondentswere more <strong>to</strong>lerant of risk in hypothetical gambles: for example, they were morelikely <strong>to</strong> prefer an 80 percent chance of 45 florins (about $23) over a sure 30 florins(about $15). Benjamin <strong>and</strong> Shapiro (2005) found that students with higher scoreson the math section of the SAT (or its Chilean equivalent) were more likely <strong>to</strong>choose according <strong>to</strong> expected value for real decisions involving small stakes (forexample, they were more likely <strong>to</strong> prefer a 50 percent chance <strong>to</strong> win $1.05 over asure 50 cents).To assess the relation between CRT <strong>and</strong> risk preferences, I included severalmeasures of risk preferences in my questionnaires, including choices between acertain gain (or loss) <strong>and</strong> some probability of a larger gain (or loss). For some
<strong>Cognitive</strong> <strong>Reflection</strong> <strong>and</strong> <strong>Decision</strong> <strong>Making</strong> 33items, expected value was maximized by choosing the gamble, <strong>and</strong> for some it wasmaximized by choosing the certain outcome.The results are shown in Table 3a. In the domain of gains, the high CRT groupwas more willing <strong>to</strong> gamble—particularly when the gamble had higher expectedvalue (<strong>to</strong>p panel), but, notably, even when it did not (middle panel). If all five itemsfrom the middle panel of Table 3a are aggregated, the high CRT group gambledsignificantly more often than the low CRT group (31 percent versus 19 percent; 2 8.82; p 0.01). This suggests that the correlation between cognitive ability<strong>and</strong> risk taking in gains is not due solely <strong>to</strong> a greater disposition <strong>to</strong> computeexpected value or <strong>to</strong> adopt that as the choice criterion. 9 For items involving losses(lower panel), the high CRT group was less risk seeking; they were more willingaccept a sure loss <strong>to</strong> avoid playing a gamble with lower (more negative) expectedvalue.Two pairs of items (d versus o <strong>and</strong> h versus r) were reflections of one anotherin the domain of gains <strong>and</strong> losses. Prospect theory predicts that people will be morewilling <strong>to</strong> take risks <strong>to</strong> avoid losses than <strong>to</strong> achieve gains; that respondents willswitch from risk aversion <strong>to</strong> risk seeking when the valence of a gamble (or “prospect”)changes from positive <strong>to</strong> negative (Kahneman <strong>and</strong> Tversky, 1979). Thoughthis is spectacularly true for the low CRT group, who are much more willing <strong>to</strong>gamble in the domain of losses than in the domain of gains, there is no suchreflection effect among the high CRT group, as shown in Table 3b. This resultstarkly shows the importance of considering cognitive ability when evaluating thedescriptive validity of a theory of decision making. 10Is the CRT Just Another IQ test?Of the 3,428 respondents who completed the three-item CRT, many alsocompleted one or more additional cognitive measures: 921 completed the WonderlicPersonnel Test (WPT)—a 12-minute, 50-item test used by the National9 As expected, the gamble was not popular among either group for any of the “anti-expected-value”gambles, since risk aversion <strong>and</strong> expected value both militate against it. However, any fac<strong>to</strong>rs favoringthe gamble over the sure thing (for example, valuing the excitement of gambling or dismissing the sureamount as negligibly small) would be more likely <strong>to</strong> tip preferences in favor of the gamble among thoseless averse <strong>to</strong> it (the high CRT group, as judged from items a through h). The gambles in items i throughm were designed, in part, <strong>to</strong> have some chance of being chosen (the sure amounts were small, <strong>and</strong> theexpected values of the gambles were typically close <strong>to</strong> the sure amount). Including choices in which thegambles lacked these properties (for example, offering a choice between $4,000 for sure <strong>and</strong> a 50percent chance of $5000) would be pointless, because nearly everyone would reject the gamble, leavingno response variance <strong>to</strong> analyze. Item i comes close <strong>to</strong> illustrating this point.10 Although the descriptive accuracy of expected utility theory markedly improves for respondents withhigher scores, it cannot explain why a 75 percent chance of $200 is frequently rejected in favor of a sure$100, across all levels of cognitive ability, since this is a small fraction of one’s wealth, <strong>and</strong> even a concaveutility function is approximately linear over small changes (Rabin, 2000).
34 Journal of Economic PerspectivesTable 3aRisk Seeking Behavior among Low <strong>and</strong> High CRT GroupsPercentage choosing riskier optionCRT groupItemCertain gains vs. Higher expected value gambles Low HighStat. Signif.a $1,000 for sure or a 90% chance of $5,000 52% 280 74% 225 p 0.0001b $100 for sure or a 90% chance of $500 56% 95 78% 92 p 0.01c $1,000 for sure or a 75% chance of $4,000 37% 264 57% 102 p 0.001d $100 for sure or a 75% chance of $200 19% 843 38% 475 p 0.0001e $100 for sure or a 75% chance of $150 10% 217 34% 94 p 0.0001f $100 for sure or a 50% chance of $300 47% 68 75% 20 p 0.05g $500 for sure or a 15% chance of $1,000,000 31% 341 60% 135 p 0.0001h $100 for sure or a 3% chance of $7,000 8% 139 21% 70 p 0.01Certain gains vs. Lower expected value gambles Low Highi $100 for sure or a 25% chance of $200 7% 68 10% 20 n.s.j $100 for sure or a 25% chance of $300 14% 137 18% 39 n.s.k $5 for sure or a 4% chance of $80 29% 84 36% 50 n.s.l $5 for sure or a 1% chance of $80 27% 37 37% 38 n.s.m $60 for sure or a 1% chance of $5000 19% 153 32% 31 n.s.Certain losses vs. Lower expected value gambles Low Highn Lose $10 for sure or a 90% chance <strong>to</strong> lose $50 24% 29 6% 16 n.s.o Lose $100 for sure or a 75% chance <strong>to</strong> lose $200 54% 339 31% 141 p 0.0001p Lose $100 for sure or a 50% chance <strong>to</strong> lose $300 61% 335 55% 109 n.s.q Lose $50 for sure or a 10% chance <strong>to</strong> lose $800 44% 180 23% 56 p 0.01r Lose $100 for sure or a 3% chance <strong>to</strong> lose $7000 63% 68 28% 57 p 0.0001Table 3bThe <strong>Reflection</strong> Effect for Low <strong>and</strong> High CRT GroupsItemPercentage choosing gamblein the domain of gains <strong>and</strong> lossesLowCRT groupHighd $100 for sure or a 75% chance of $200 19% 843 38% 475o Lose $100 for sure or a 75% chance <strong>to</strong> lose $200 54% 339 31% 141h $100 for sure or a 3% chance of $7,000 8% 139 21% 70r Lose $100 for sure or a 3% chance <strong>to</strong> lose $7000 63% 68 28% 57Football League 11 <strong>and</strong> other employers <strong>to</strong> assess the intellectual abilities of theirprospective hires; 944 completed an 18-item “need for cognition” scale (NFC),which measures the endorsement of statements like “the notion of thinking ab-11 Pat McInally, a Harvard graduate who later became a punter for the Cincinnati Bengals, was the onlycollege football player <strong>to</strong> score a perfect 50 out of 50 on the Wonderlic—a score attained by only oneperson in 30,000. Of the 921 respondents who <strong>to</strong>ok it in these studies, the highest score was a 47.
36 Journal of Economic PerspectivesTable 5Correlations Between <strong>Cognitive</strong> Measures <strong>and</strong> <strong>Decision</strong>-<strong>Making</strong> IndicesChoice under uncertainty(Preferences for gambles across domains)Intertemporal choiceGainsLosses<strong>Cognitive</strong>measurePreference forpatient optionExpected valuefavors gambleExpected valuefavors sure gainExpected valuefavors sure lossCRT 0.12**** 3099 0.22**** 3150 0.08** 1014 0.12**** 1366SAT 0.07 387 0.09 368 0.07 149 0.12* 275SAT M 0.04 387 0.19*** 368 0.05 149 0.11 275SAT V 0.15** 387 0.03 368 0.06 149 0.08 275ACT 0.10* 577 0.14** 549 0.13* 367 0.01 358WPT 0.00 837 0.13*** 904 0.08 287 0.24**** 546NFC 0.06 755 0.13**** 875 0.03 497 0.00 215predictive validities. To assess this issue, I correlated the scores on the variouscognitive measures with composite indices of decision-making characteristicsformed from the time preference items in Table 2 or the risk preference items inTable 3. The composite scores registered the proportion of patient (or risk seeking)responses. For example, respondents might have been asked whether theyprefer $3,400 this month or $3,800 next month, whether they would prefer ashorter massage in two weeks or a longer one in November <strong>and</strong> how much theywould pay for overnight shipping of a book. Respondents who preferred the $3800,the longer later massage <strong>and</strong> who were willing <strong>to</strong> pay less than the median personfor express shipping would be coded as “patient” on all three items <strong>and</strong> wouldreceive a score of 1. If they were patient on two of the three items, they wouldreceive a score of 0.66, <strong>and</strong> so on. Thus, the indices are scores ranging from 0 <strong>to</strong>1, in coarse or fine increments depending on how many questions the respondentanswered. 12As shown in Table 5, the CRT was either the best or second-best predic<strong>to</strong>racross all four decision-making domains <strong>and</strong> the only test related <strong>to</strong> them all. Thus,12 Composite indices were used <strong>to</strong> measure respondents’ general tendencies within a given decisionmakingdomain <strong>and</strong> <strong>to</strong> permit aggregation across studies. However, unless respondents receivedidentical items, their scores are not perfectly comparable. This issue is not vital for establishing thepredictive validity of the CRT, because the correlations reflect the pattern plainly observable from theindividual items. However, for the purpose of comparing the cognitive measures, composite indices aremore problematic, because the full battery of cognitive tests was not typically given, <strong>and</strong> different studiesinvolved different items. For example, at Carnegie Mellon University, respondents answered items b, d<strong>and</strong> l from Table 2 <strong>and</strong> items a <strong>and</strong> d from Table 3. The CRT was the only cognitive measure obtainedfor these respondents. Thus, these particular items will be disproportionately represented in thecomposite decision-making indices with which the CRT is correlated. This problem can be overcome bydoing a pairwise comparison of cognitive measures only for those respondents who were given both.This more painstaking analysis generally confirms the implications of Table 5—namely, the differenttests often function similarly, but the CRT is a bit more highly correlated with the characteristics ofinterest.
<strong>Cognitive</strong> <strong>Reflection</strong> <strong>and</strong> <strong>Decision</strong> <strong>Making</strong> 37for researchers interested in separating people in<strong>to</strong> cognitive groups, the CRT is anattractive test: it involves only three items <strong>and</strong> can be administered in a minute ortwo, yet its predictive validity equals or exceeds other cognitive tests that involve up<strong>to</strong> 215 items <strong>and</strong> take up <strong>to</strong> 3 1 ⁄2 hours <strong>to</strong> complete (or which involve self-reports thatcannot be readily verified).Sex DifferencesMen scored significantly higher than women on the CRT, as shown in Table 6.The difference is not likely due <strong>to</strong> a biased sampling procedure, because there wereno significant sex differences for any other cognitive measure, except SAT mathscores, for which there was a modest difference corresponding <strong>to</strong> national averages.Nor can it be readily attributed <strong>to</strong> differences in the attention or effort expendedon the survey, since women scored slightly higher on the Wonderlic test, which wasgiven under identical circumstances (included as part of a 45-minute survey thatrecruited respondents were paid <strong>to</strong> complete).It appears, instead, that these items measure something that men have moreof. That something may be mathematical ability or interest, since the CRT itemshave mathematical content, <strong>and</strong> men generally score higher than women on mathtests (Benbow <strong>and</strong> Stanley, 1980; Halpern, 1986; Hyde, Fennema <strong>and</strong> Lamon, 1990;Hedges <strong>and</strong> Nowell, 1995). However, men score higher than women on the CRT,even controlling for SAT math scores. Furthermore, even if one focuses only onrespondents who gave the wrong answers, men <strong>and</strong> women differ. Women’s mistakestend <strong>to</strong> be of the intuitive variety, whereas men make a wider variety of errors.For example, the women who miss the “widgets” problem nearly always give theerroneous intuitive answer “100,” whereas a modest fraction of the men giveunexpected wrong answers, such as “20” or “500” or “1.” For every CRT item (<strong>and</strong>several other similar items used in a longer variant of the test) the ratio of“intuitive” mistakes <strong>to</strong> “other” mistakes is higher for women than for men. Thus,the data suggest that men are more likely <strong>to</strong> reflect on their answers <strong>and</strong> lessinclined <strong>to</strong> go with their intuitive responses. 13Because men score higher, the “high” CRT group is two-thirds men, whereasthe “low” CRT group is two-thirds women. Thus, the differences between CRTgroups may be revealing other male/female differences besides cognitive reflection.To remove this confound, Table 7 presents results split by both sex <strong>and</strong> CRTscore for selected items, including a here<strong>to</strong>fore undiscussed item involving thewillingness <strong>to</strong> pay for a coin flip in which “heads” pays $100 <strong>and</strong> “tails” pays nothing.Four facts are noteworthy. First, CRT scores are more highly correlated withtime preferences for women than for men; the low <strong>and</strong> high groups differ more.Second, as suggested by most prior research (Byrnes, Miller <strong>and</strong> Schafer, 1999,13 One might draw the opposite conclusion from self-reports. Using the scale described earlier, respondentswere asked “How long do you deliberate before reaching a conclusion?” Women reported higherscores than men (1.16 vs. 0.45; t 186 2.32; p0.05).
38 Journal of Economic PerspectivesTable 6Sex Differences in <strong>Cognitive</strong> MeasuresTest Men Women Significance of group differenceCRT 1.47 1.03 p 0.0001SAT 1334 1324 n.s.SAT math 688 666 p 0.01SAT verbal 646 658 n.s.ACT 26.7 26.3 n.s.Wonderlic 26.2 26.5 n.s.NFC 0.91 0.85 n.s.present an overview), women were considerably more risk averse than men, <strong>and</strong>this remains true even after controlling for CRT score. Third, for the selected riskitems, CRT is as important as sex. In other words, high-scoring women behavealmost identically <strong>to</strong> low-scoring men (compare the upper left <strong>and</strong> lower right cellswithin each of the five items in the lower panel). Fourth, in contrast <strong>to</strong> the patternobserved for the time preference items, CRT scores are more highly correlated withrisk preferences for men than for women.The curious finding that CRT scores are more tightly linked with time preferencesfor women than for men, but are more tightly linked with risk preferencesfor men than for women held for the other tests of cognitive ability, as well.Expressed loosely, being smart makes women patient <strong>and</strong> makes men take morerisks. 14 This result was unanticipated <strong>and</strong> suggests no obvious explanation. The onlyrelated finding of which I am aware is in a study by Shoda, Mischel <strong>and</strong> Peake(1990), who found that the patience of preschool girls was strongly related <strong>to</strong> theirsubsequent SAT scores, but the patience of preschool boys was not.DiscussionThe instructions in studies of decision making commonly reassure respondentsthat “there are no right or wrong answers.” If this line is sincere, it impliesthat researchers will interpret such preferences as they would a choice between14 This conclusion can also be expressed less loosely. First, when faced with three mathematicalreasoning problems (“bat <strong>and</strong> ball,” “widgets” <strong>and</strong> “lilypads”), certain responses that are plausiblyconstrued as manifestations of intelligence (“5,” “5” <strong>and</strong> “47”) tend <strong>to</strong> correlate positively with certainother responses that are plausibly construed as expressions of patience (namely, an expressed willingness<strong>to</strong> wait for larger later rewards), <strong>and</strong> this tendency is more pronounced in women than men.Second, the production of the canonically correct responses tends also <strong>to</strong> correlate positively withcertain responses that are plausibly construed as expressions of risk <strong>to</strong>lerance (namely, an expressedwillingness <strong>to</strong> forego a smaller certain reward in favor of a probabalistic larger one), <strong>and</strong> this tendencyis more pronounced in men than in women. Third, sex differences in risk seeking <strong>and</strong> in the degree ofrelation <strong>to</strong> CRT scores was true only in the domain of gains. For the selected loss items (n through r inTable 3), there were no sex differences.
Shane Frederick 39Table 7Results Split by Both CRT <strong>and</strong> Sex(percentage choosing patient option or mean response)Intertemporal choice or judgmentSexLowCRT groupHighSignificanceof groupdifference$3400 this month or $3800 next month Men 39% 170 60% 84 p0.01Women 39% 252 67% 51 p0.001$100 this year or $140 next year Men 21% 106 34% 161 p0.05Women 25% 194 49% 70 p0.001$100 now or $1100 in 10 years Men 58% 88 56% 110 n.s.Women 43% 186 57% 68 p0.05$9 now or $100 in 10 years Men 40% 123 43% 178 n.s.Women 41% 229 53% 89 p0.10Willingness <strong>to</strong> pay for overnight shipping Men $4.05 41 $1.94 84 p0.001of chosen book Women $4.54 95 $2.19 40 p0.001Risky choice or judgment(percentage choosing risky option or meanresponse)SexLowCRT groupHighSignificanceof groupdifference$100 for sure or a 75% chance of $200 Men 26% 239 43% 244 p 0.0001Women 16% 398 29% 130 p 0.01$500 for sure or a 15% chance of $1,000,000 Men 40% 68 80% 41 p 0.0001Women 25% 109 38% 37 n.s.$1000 for sure or a 90% chance of $5000 Men 59% 103 81% 151 p 0.001Women 46% 166 59% 65 p 0.10$100 for sure or a 3% chance of $7000 Men 6% 36 30% 44 p 0.01Women 8% 99 8% 24 n.s.Willingness <strong>to</strong> pay for a coin flip, where Men $13.00 54 $20.00 59 p 0.001“HEADS” pays $100 <strong>and</strong> “TAILS” pays Women $11.00 12 $12.00 36 n.s.nothing.apples <strong>and</strong> oranges—as a primitive that neither requires nor permits furtherscrutiny.However, unlike a preference between apples <strong>and</strong> oranges, time <strong>and</strong> riskpreferences are sometimes tied so strongly <strong>to</strong> measures of cognitive ability that theyeffectively function as such a measure themselves. 15 For example, when a choice15 To encourage respondents <strong>to</strong> consider each choice carefully, <strong>and</strong> independently from the otheritems, several “filler” choices were inserted between the “focal items.” An analysis of these responsesshows that CRT scores are unrelated <strong>to</strong> preferences between apples <strong>and</strong> oranges, Pepsi <strong>and</strong> Coke, beer
<strong>Cognitive</strong> <strong>Reflection</strong> <strong>and</strong> <strong>Decision</strong> <strong>Making</strong> 41brilliant neighbor seems prudent. However, if one were deciding between an apple<strong>and</strong> an orange, Einstein’s preference for apples seems irrelevant.Thus, a relation between cognitive ability <strong>and</strong> preference does not, by itself,establish the correct choice for any particular individual. Two individuals withdifferent cognitive abilities may experience outcomes differently, which may warrantdifferent choices (for example, what magazines <strong>to</strong> read or movies <strong>to</strong> attend).But with respect <strong>to</strong> the example motivating this discussion, one must ask whetherit is plausible that people of differing cognitive abilities experience increments ofwealth as differently as their choices suggest. It seems exceedingly unlikely that thelow CRT group has a marked kink in their utility function around $W 500,beyond which an extra $999,500 confers little additional benefit. It seems morereasonable, instead, <strong>to</strong> override the conventional caveat about arguing with tastes(Becker <strong>and</strong> Stigler, 1977) <strong>and</strong> conclude that choosing the $500 is the “wronganswer”—much as 10 cents is the wrong answer in the “bat <strong>and</strong> ball” problem.Whatever stance one adopts on the contentious normative issues of whether apreference can be “wrong” <strong>and</strong> whether more reflective people make “better”choices, respondents who score differently on the CRT make different choices, <strong>and</strong>this dem<strong>and</strong>s some explanation.y I thank Dan Ariely, Scott Armstrong, Daniel Benjamin, Brett Boshco, Eric Bradlow, CraigFox, Kerri Frederick, Steve Garcia, Timothy Heath, James Hines, Eric Johnson, DanielKahneman, Robyn LeBoeuf, George Loewenstein, Leif Nelson, Nathan Novemsky, GregPogarsky, Drazen Prelec, Daniel Read, Eldar Shafir, Timothy Taylor, Catherine Tucker,Michael Waldman <strong>and</strong> Jaclyn Zires for comments received on earlier drafts. A special thanks<strong>to</strong> Steve Garcia, who coordinated most of the surveys generating the data summarized here. Asalways (but particularly in this case), the views expressed or implied are those of the authoralone.ReferencesBar-Hillel, Maya. 1991. “Commentary on Wolford,Taylor, <strong>and</strong> Beck: The Conjunction Fallacy?”Memory <strong>and</strong> Cognition. 19:4, pp. 412–14.Becker, Gary <strong>and</strong> George Stigler. 1977. “DeGustibus Non est Disput<strong>and</strong>um.” American EconomicReview. 67:2, pp. 76–90.Benbow, Camilla P. <strong>and</strong> J. C. Stanley. 1980.“Sex Differences in Mathematical Ability: Fact orArtifact?” Science. 210:4475, pp. 1262–264.Benjamin, Daniel J. <strong>and</strong> Jesse M. Shapiro.2005. “Who is ‘Behavioral?’ <strong>Cognitive</strong> Ability<strong>and</strong> Anomalous Preferences.” Working paper,Harvard University.Byrnes, James P., David C. Miller <strong>and</strong> WilliamD. Schafer. 1999. “Gender Differences in RiskTaking: A Meta-Analysis.” Psychological Bulletin.125:3, pp. 367–83.Cacioppo, John T. <strong>and</strong> Richard E. Petty. 1982.“The Need for Cognition.” Journal of Personality<strong>and</strong> Social Psychology. 42:1, pp. 116–31.Cacioppo, John T., Richard E. Petty <strong>and</strong>Chuan Feng Kao. 1984. “The Efficient Assessmen<strong>to</strong>f Need for Cognition.” Journal of PersonalityAssessment. 48:3, pp. 306–07.Cacioppo, John T., Richard E. Petty, JeffreyA. Feinstein <strong>and</strong> W. Blair G. Jarvis. 1996. “Dis-
42 Journal of Economic Perspectivespositional Differences in <strong>Cognitive</strong> Motivation:The Life <strong>and</strong> Times of Individuals Varying inNeed for Cognition.” Psychological Bulletin. 119:2,pp. 197–253.Chaiken, Shelly <strong>and</strong> Yaacov Trope. 1999.Dual-Process Theories in Social Psychology. NewYork: Guilford Press.Donkers, Bas, Bertr<strong>and</strong> Melenberg <strong>and</strong> Arthurvan Soest. 2001. “Estimating Risk Attitudes UsingLotteries: A Large Sample Approach.” Journalof Risk <strong>and</strong> Uncertainty. 22:2, pp. 165–95.Epstein, Seymour. 1994. “Integration of the<strong>Cognitive</strong> <strong>and</strong> Psychodynamic Unconscious.”American Psychologist. 49:8, pp. 709–24.Frederick, Shane. 2002. “Au<strong>to</strong>mated ChoiceHeuristics,” in Heuristics <strong>and</strong> Biases: The Psychologyof Intuitive Judgment. T. Gilovich, D. Griffin <strong>and</strong>D. Kahneman, eds. New York: Cambridge UniversityPress, pp. 548–58.Frederick, Shane, George Loewenstein <strong>and</strong>Ted O’Donoghue. 2002. “Time Discounting <strong>and</strong>Time Preference: A Critical Review.” Journal ofEconomic Literature. 40:2, pp. 351–401.Funder, David C. <strong>and</strong> Jack Block. 1989. “TheRole of Ego-Control, Ego-Resiliency, <strong>and</strong> IQ inDelay of Gratification in Adolescence.” Journal ofPersonality <strong>and</strong> Social Psychology. 57:6, pp. 1041–050.Halpern, Diane F. 1986. Sex Differences in <strong>Cognitive</strong>Abilities. Hillsdale, N.J.: Erlbaum.Hedges, Larry V. <strong>and</strong> Amy Nowell. 1995. “SexDifferences in Mental Test Scores, Variability,<strong>and</strong> Numbers of High-Scoring Individuals.” Science.July 7, 269, pp. 41–45.Hil<strong>to</strong>n, Denis J. 1995. “The Social Context ofReasoning: Conversational Inference <strong>and</strong> RationalJudgment.” Psychological Bulletin. September,118, pp. 248–71.Hyde, Janet Shibley, Elizabeth Fennema <strong>and</strong>Susan J. Lamon. 1990. “Gender Differences inMathematics Performance: A Meta-Analysis.”Psychological Bulletin. 107:2, pp. 139–55.Jensen, Arthur R. 1998. The g Fac<strong>to</strong>r: The Scienceof Mental Ability. Westport, Conn.: Praeger.Kahneman, Daniel <strong>and</strong> Shane Frederick. 2002.“Representativeness Revisited: Attribute Substitutionin Intuitive Judgment,” in Heuristics <strong>and</strong>Biases: The Psychology of Intuitive Judgment. T.Gilovich, D. Griffin <strong>and</strong> D. Kahneman, eds. NewYork: Cambridge University Press, pp. 49–81.Kahneman, Daniel <strong>and</strong> Amos Tversky. 1979.“Prospect Theory: An Analysis of <strong>Decision</strong> UnderRisk.” Econometrica. 47:2, pp. 263–91.Kirby, Kris N., Gordon C. Wins<strong>to</strong>n <strong>and</strong> MarianaSentiesteban. 2005. “Impatience <strong>and</strong>Grades: Delay-Discount Rates Correlate Negativelywith College GPA.” Learning <strong>and</strong> IndividualDifferences. Forthcoming.Lubinski, David <strong>and</strong> Lloyd Humphreys. 1997.“Incorporating General Intelligence in<strong>to</strong> Epidemiology<strong>and</strong> the Social Sciences.” Intelligence.24:1, pp. 159–201.Melikian, Levon. 1959. “Preference for DelayedReinforcement: An Experimental Studyamong Palestinian Arab Refugee Children.” Journalof Social Psychology. 50, pp. 81–86.Mischel, Walter. 1974. “Processes in Delay ofGratification,” in Advances in Experimental SocialPsychology. L. Berkowitz, ed. San Diego, Calif.:Academic Press, pp. 249–92.Monterosso, John, Ronald Ehrman, KimberlyL. Napier, Charles P. O’Brien <strong>and</strong> Anna RoseChildress. 2001. “Three <strong>Decision</strong>-<strong>Making</strong> Tasksin Cocaine-Dependent Patients: Do They Measurethe Same Construct?” Addiction. 96:12,pp. 1825–837.Nagin, Daniel S. <strong>and</strong> Greg Pogarsky. 2003.“An Experimental Investigation of Deterrence:Cheating, Self-Serving Bias, <strong>and</strong> Impulsivity.”Criminology. 41:1, pp. 501–27.Parker, Andrew M. <strong>and</strong> Baruch Fischhoff.2005. “<strong>Decision</strong>-<strong>Making</strong> Competence: ExternalValidation through an Individual-DifferencesApproach.” Journal of Behavioral <strong>Decision</strong> <strong>Making</strong>.18:1, pp. 1–27.Rabin, Matthew. 2000. “Risk Aversion <strong>and</strong>Expected-Utility Theory: A Calibration Theorem.”Econometrica. 68:5, pp. 1281–292.Rae, John. 1834. The New Principles of PoliticalEconomy. Reprinted in 1905 as The SociologicalTheory of Capital. New York: Macmillan.Savage, Leonard J. 1954. The Foundations ofStatistics. New York: Wiley.Shoda, Yuichi, Walter Mischel <strong>and</strong> Philip K.Peake. 1990. “Predicting Adolescent <strong>Cognitive</strong><strong>and</strong> Self-Regula<strong>to</strong>ry Competencies from PreschoolDelay of Gratification: Identifying DiagnosticConditions.” Developmental Psychology. 26:6,pp. 978–86.Sloman, Steven A. 1996. “The Empirical Casefor Two Systems of Reasoning.” Psychological Bulletin.119:1, pp. 3–22.Slovic, Paul <strong>and</strong> Amos Tversky. 1974. “WhoAccepts Savage’s Axiom?” Behavioral Science. 19:4,pp. 368–73.Stanovich, Keith E. <strong>and</strong> Richard F. West. 2000.“Individual Differences in Reasoning: Implicationsfor the Rationality Debate?” Behavioral <strong>and</strong>Brain Sciences. 22:5, pp. 645–726.Sternberg, Robert J. 2000. “The Ability isnot General, <strong>and</strong> Neither are the Conclusions.[Response <strong>to</strong> K. E. Stanovich <strong>and</strong> R.F.West.]” Behavioral <strong>and</strong> Brain Sciences. 23:5,pp. 697–98.