4-5 Scatter Plots notes
4-5 Scatter Plots notes
4-5 Scatter Plots notes

Create successful ePaper yourself
Turn your PDF publications into a flip-book with our unique Google optimized e-Paper software.
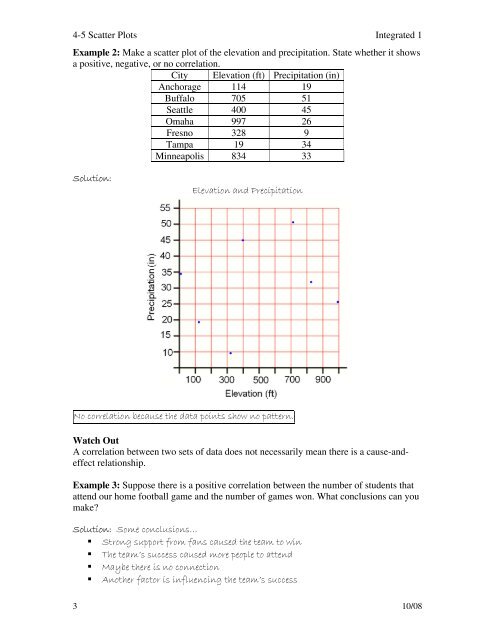
4-5 <strong>Scatter</strong> <strong>Plots</strong> Integrated 1Example 2: Make a scatter plot of the elevation and precipitation. State whether it showsa positive, negative, or no correlation.City Elevation (ft) Precipitation (in)Anchorage 114 19Buffalo 705 51Seattle 400 45Omaha 997 26Fresno 328 9Tampa 19 34Minneapolis 834 33Solution:Elevation and PrecipitationNo correlation because the data points show no pattern.Watch OutA correlation between two sets of data does not necessarily mean there is a cause-andeffectrelationship.Example 3: Suppose there is a positive correlation between the number of students thatattend our home football game and the number of games won. What conclusions can youmake?Solution: Some conclusions…• Strong support from fans caused the team to win• The team’s success caused more people to attend• Maybe there is no connection• Another factor is influencing the team’s success3 10/08