Constrained Policies
Constrained Policies
Constrained Policies

Create successful ePaper yourself
Turn your PDF publications into a flip-book with our unique Google optimized e-Paper software.
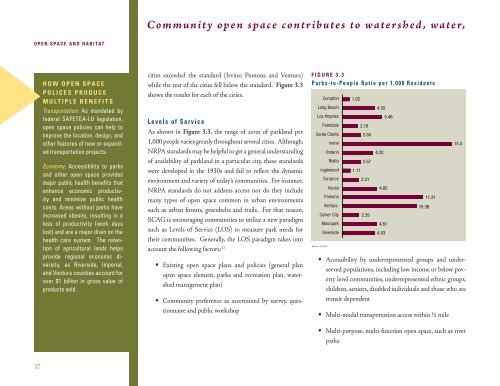
Community open space contributes to watershed, water,OPEN SPACE AND HABITATHOW OPEN SPACEPOLICES PRODUCEMULTIPLE BENEFITSTransportation: As mandated byfederal SAFETEA-LU legislation,open space policies can help toimprove the location, design, andother features of new or expandedtransportation projects.Economy: Accessibility to parksand other open space providesmajor public health benefits thatenhance economic productivityand minimize public healthcosts. Areas without parks haveincreased obesity, resulting in aloss of productivity (work dayslost) and are a major drain on thehealth care system. The retentionof agricultural lands helpsprovide regional economic diversity,as Riverside, Imperial,and Ventura counties account forover $1 billion in gross value ofproducts sold.cities exceeded the standard (Irvine, Pomona and Ventura)while the rest of the cities fell below the standard. Figure 3.3shows the results for each of the cities.Levels of ServiceAs shown in Figure 3.3, the range of acres of parkland per1,000 people varies greatly throughout several cities. Although,NRPA standards may be helpful to get a general understandingof availability of parkland in a particular city, these standardswere developed in the 1930s and fail to reflect the dynamicenvironment and variety of today’s communities. For instance,NRPA standards do not address access nor do they includemany types of open space common in urban environmentssuch as urban forests, greenbelts and trails. For that reason,SCAG is encouraging communities to utilize a new paradigmsuch as Levels of Service (LOS) to measure park needs fortheir communities. Generally, the LOS paradigm takes intoaccount the following factors: 11 Existing open space plans and policies (general planopen space element, parks and recreation plan, watershedmanagement plan)Community preference as ascertained by survey, questionnaireand public workshopFIGURE 3.3Parks-to-People Ratio per 1,000 ResidentsLong BeachLos AngelesSanta ClaritaSources: SCAG Accessibility by underrepresented groups and underservedpopulations, including low income or below povertylevel communities, underrepresented ethnic groups,children, seniors, disabled individuals and those who aretransit dependentComptonPalmdaleIrvineOntarioRialtoInglewoodTorranceAzusaPomonaVenturaCulver CityMoorparkRiverside1.021.112.162.562.572.312.354.554.324.854.814.535.4610.3911.21Multi-modal transportation access within ½ mile15.3Multi-purpose, multi-function open space, such as riverparks37