Agency Budget Chapters - Office of the Chief Financial Officer
Agency Budget Chapters - Office of the Chief Financial Officer
Agency Budget Chapters - Office of the Chief Financial Officer

Create successful ePaper yourself
Turn your PDF publications into a flip-book with our unique Google optimized e-Paper software.
Government <strong>of</strong> <strong>the</strong>District <strong>of</strong> ColumbiaVincent C. Gray, MayorDe'Shawn WrightDeputy Mayor for EducationAllen Y. LewCity AdministratorBeatriz OteroDeputy Mayor for Health and Human ServicesVictor L. HoskinsDeputy Mayor for Planning and EconomicDevelopmentPaul QuanderDeputy Mayor for Public Safety and JusticeChristopher Murphy<strong>Chief</strong> <strong>of</strong> StaffEric GouletDeputy <strong>Chief</strong> <strong>of</strong> Staff and <strong>Budget</strong> DirectorNatwar M. Gandhi<strong>Chief</strong> <strong>Financial</strong> <strong>Office</strong>rMembers <strong>of</strong> <strong>the</strong> CouncilPhil MendelsonChairmanDavid A. Catania ........................................................ At LargeMichael A. Brown .......................................................At LargeVincent Orange.............................................................At LargeJim Graham ....................................................................Ward 1Jack Evans ......................................................................Ward 2Mary M. Cheh ................................................................Ward 3Muriel Bowser.................................................................Ward 4Kenyon McDuffie ..........................................................Ward 5Tommy Wells ...................................................................Ward 6Yvette M. Alexander.......................................................Ward 7Marion Barry ..................................................................Ward 8Jennifer Bud<strong>of</strong>f<strong>Budget</strong> Director
<strong>Office</strong> <strong>of</strong> <strong>Budget</strong> and PlanningGordon McDonaldDeputy <strong>Chief</strong> <strong>Financial</strong> <strong>Office</strong>rLakeia Williams, Executive AssistantJames SpauldingAssociate Deputy <strong>Chief</strong> <strong>Financial</strong> <strong>Office</strong>r<strong>Budget</strong> AdministrationEric Cannady, DirectorSunday Okparaocha, Deputy DirectorStacy-Ann White, Deputy DirectorRenee Waddy, Executive AssistantTeam LeadersJoshua AgbebakunErnest ChukwumaRandall MyersWilliam PowellJanice Walker<strong>Budget</strong> Administration AnalystsRasheed DawoduLee HaywardBenjamin IyunRobin MooreSeblewengel MulawCharles PryorNaila TengraAlex TessemaLinda W. Williams<strong>Financial</strong> Planning and AnalysisLeticia Stephenson, DirectorDavid KobesDuane Smith<strong>Financial</strong> Management Servicesand OperationsSumita Chaudhuri, DirectorRobert JohnsonDarryl MillerCarlotta OsorioSue TaingMargaret Myers, <strong>Office</strong> and Production ManagerTravis AllenSharon NelsonCapitalImprovements ProgramDavid Clark, DirectorSherrie GreenfieldOmar HerziBharat KothariJoseph WolfeA special thank you to <strong>the</strong> analysts from o<strong>the</strong>r District agencies who assisted <strong>the</strong> <strong>Office</strong> <strong>of</strong><strong>Budget</strong> and Planning during <strong>the</strong> preparation <strong>of</strong> <strong>the</strong> budget.
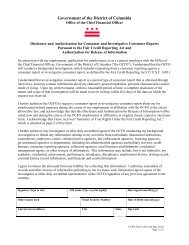
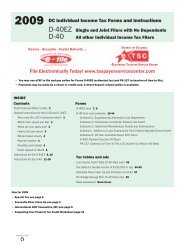
District <strong>of</strong> Columbia- Organization Chart
GOVERNMENT OF THE DISTRICT OF COLUMBIALEGISLATIVEBRANCHEXECUTIVEBRANCHJUDICIALBRANCHCouncil <strong>of</strong> <strong>the</strong> District <strong>of</strong>Columbia<strong>Office</strong> <strong>of</strong> <strong>the</strong> <strong>Chief</strong><strong>Financial</strong> <strong>Office</strong>rMayor<strong>Office</strong> <strong>of</strong> <strong>the</strong>Inspector GeneralDC Court <strong>of</strong> AppealsDC Auditor<strong>Office</strong> <strong>of</strong> <strong>Budget</strong> andPlanningDC Superior Court<strong>Office</strong> <strong>of</strong> Tax andRevenue<strong>Office</strong> <strong>of</strong> <strong>the</strong> CityAdministrator<strong>Office</strong> <strong>of</strong> <strong>the</strong> AttorneyGeneralExecutive <strong>Office</strong> <strong>of</strong> <strong>the</strong>MayorAdvisory NeighborhoodCommissions<strong>Office</strong> <strong>of</strong> <strong>Financial</strong>Operations and Systems<strong>Office</strong> <strong>of</strong> Finance andTreasury<strong>Office</strong> <strong>of</strong> RevenueAnalysis<strong>Office</strong> <strong>of</strong> Deputy Mayorfor Education<strong>Office</strong> <strong>of</strong> <strong>the</strong> DeputyMayor for Planning andEconomic Development<strong>Office</strong> <strong>of</strong> <strong>the</strong> DeputyMayor for Public Safetyand Justice<strong>Office</strong> <strong>of</strong> <strong>the</strong> DeputyMayor for Health andHuman Services<strong>Office</strong> <strong>of</strong> <strong>the</strong> <strong>Chief</strong> <strong>of</strong> Staff<strong>Office</strong> <strong>of</strong> <strong>Budget</strong> and Finance<strong>Office</strong> <strong>of</strong> Communications:Mayor’s Correspondence Unit<strong>Office</strong> <strong>of</strong> Cable TelevisionJoint Commission onJudicial AdministrationCommission on JudicialDisabilities and TenureIndependent Agencies· DC Water (Water and Sewer Authority)· District <strong>of</strong> Columbia Retirement Board· <strong>Office</strong> <strong>of</strong> Employee Appeals· Public Employee Relations Board· Events DC (Washington Convention and Sports Authority)· Housing Finance <strong>Agency</strong>· Public Defender Service· Pretrial Services <strong>Agency</strong>· DC Lottery and Charitable Games Control Board· Board <strong>of</strong> Library Trustees· University <strong>of</strong> <strong>the</strong> District <strong>of</strong> Columbia Board <strong>of</strong> Trustees· <strong>Office</strong> <strong>of</strong> <strong>the</strong> People’s Counsel· DC Housing Authority· Contract Appeals Board· Board <strong>of</strong> Real Property Assessment and Appeals· Alcoholic Beverage Regulation Administration· Criminal Justice Coordinating CouncilDC Public SchoolsPublic Charter SchoolsUniversity <strong>of</strong> <strong>the</strong> District<strong>of</strong> ColumbiaDC Community College<strong>Office</strong> <strong>of</strong> <strong>the</strong> StateSuperintendent <strong>of</strong>EducationDepartment <strong>of</strong>Employment ServicesDepartment <strong>of</strong> Housingand CommunityDevelopmentDepartment <strong>of</strong> Consumerand Regulatory Affairs<strong>Office</strong> <strong>of</strong> TenantAdvocateDepartment <strong>of</strong>Insurance, Securitiesand BankingDepartment <strong>of</strong> Small andLocal BusinessDevelopment<strong>Office</strong> <strong>of</strong> Motion PictureDevelopment<strong>Office</strong> <strong>of</strong> PlanningCommission on Arts andHumanitiesDepartment <strong>of</strong> <strong>the</strong>EnvironmentDepartment <strong>of</strong> HumanResourcesDepartment <strong>of</strong> MotorVehiclesDepartment <strong>of</strong> PublicWorksDepartment <strong>of</strong>TransportationDepartment <strong>of</strong> GeneralServices<strong>Office</strong> <strong>of</strong> RiskManagement<strong>Office</strong> <strong>of</strong> Human Rights<strong>Office</strong> <strong>of</strong> <strong>the</strong> <strong>Chief</strong>Technology <strong>Office</strong>r<strong>Office</strong> <strong>of</strong> Contracts andProcurementTaxicab CommissionMetropolitan PoliceDepartmentFire and EmergencyMedical ServicesDepartment<strong>Office</strong> <strong>of</strong> UnifiedCommunicationsHomeland Security andEmergency Management<strong>Agency</strong>Department <strong>of</strong>Corrections<strong>Office</strong> <strong>of</strong> <strong>the</strong> <strong>Chief</strong>Medical ExaminerJustice GrantsAdministrationDepartment <strong>of</strong> HealthDepartment <strong>of</strong> HumanServicesChild and FamilyServices <strong>Agency</strong>Department on DisabilityServices<strong>Office</strong> <strong>of</strong> Disability RightsDepartment <strong>of</strong> MentalHealthDepartment <strong>of</strong> YouthRehabilitation ServicesDepartment <strong>of</strong> HealthCare Finance<strong>Office</strong> on AgingDepartment <strong>of</strong> Parks andRecreation<strong>Office</strong> <strong>of</strong> Policy and Legislative Affairs<strong>Office</strong> <strong>of</strong> Boards and Commissions<strong>Office</strong> <strong>of</strong> Community Affairs:<strong>Office</strong> <strong>of</strong> Community Relations<strong>Office</strong> <strong>of</strong> Partnerships and Grant Services<strong>Office</strong> on Ex-Offenders Affairs<strong>Office</strong> on Women’s Policy and InitiativesServe DCYouth Advisory Council<strong>Office</strong> <strong>of</strong> African Affairs<strong>Office</strong> <strong>of</strong> Asian & Pacific Islander Affairs<strong>Office</strong> <strong>of</strong> GLBT Affairs<strong>Office</strong> on Latino Affairs<strong>Office</strong> <strong>of</strong> Religious Affairs<strong>Office</strong> <strong>of</strong> Veteran Affairs<strong>Office</strong> <strong>of</strong> <strong>the</strong> Secretary<strong>Office</strong> <strong>of</strong> <strong>the</strong> General CounselCharter Independent Agencies· Zoning Commission· Public Charter Schools· Public Service Commission· Board <strong>of</strong> Elections and EthicsJudicial NominationCommissionDistrict <strong>of</strong> Columbia BarSentencing and CriminalCode RevisionCommissionRegional Bodies· Metropolitan Washington Council <strong>of</strong> Governments· National Capital Planning Commission· Washington Metropolitan Area Transit Authority· Washington Metropolitan Area Transit Commission· Washington Metropolitan Airports Authority
1. Transmittal LetterFY 2013 Proposed <strong>Budget</strong> and <strong>Financial</strong> PlanVolume 2<strong>Agency</strong> <strong>Budget</strong> <strong>Chapters</strong> - Part I(by Appropriation Title)Contents2. How to Read <strong>the</strong> <strong>Budget</strong> and <strong>Financial</strong> Plan3. <strong>Agency</strong> <strong>Budget</strong> <strong>Chapters</strong> by Appropriation Title(Governmental Direction and Support, Economic Development and Regulation, Public Safety and Justice)A. Governmental Direction and Support1. Council <strong>of</strong> <strong>the</strong> District <strong>of</strong> Columbia (AB)..............................................................................................................A-12. <strong>Office</strong> <strong>of</strong> <strong>the</strong> District <strong>of</strong> Columbia Auditor (AC) ..................................................................................................A-93. Advisory Neighborhood Commissions (DX).......................................................................................................A-174. <strong>Office</strong> <strong>of</strong> <strong>the</strong> Mayor (AA) ......................................................................................................................................A-235. <strong>Office</strong> <strong>of</strong> Community Affairs (RP) .......................................................................................................................A-336. Serve DC (RS)........................................................................................................................................................A-377. <strong>Office</strong> <strong>of</strong> <strong>the</strong> Secretary (BA)...................................................................................................................................A-418. <strong>Office</strong> <strong>of</strong> <strong>the</strong> City Administrator (AE) .................................................................................................................A-499. D.C. <strong>Office</strong> <strong>of</strong> Risk Management (RK) ...............................................................................................................A-5710. D.C. Department <strong>of</strong> Human Resources (BE)......................................................................................................A-6711. <strong>Office</strong> <strong>of</strong> Disability Rights (JR).............................................................................................................................A-8112. Medical Liability Captive Insurance <strong>Agency</strong> (RJ)................................................................................................A-8913. <strong>Office</strong> <strong>of</strong> Finance and Resource Management (AS)............................................................................................A-9314 <strong>Office</strong> <strong>of</strong> Contracting and Procurement (PO)....................................................................................................A-10115 <strong>Office</strong> <strong>of</strong> <strong>the</strong> <strong>Chief</strong> Technology <strong>Office</strong>r (TO)....................................................................................................A-11516. Department <strong>of</strong> General Services (AM) ..............................................................................................................A-12917. Contract Appeals Board (AF)..............................................................................................................................A-14718. Board <strong>of</strong> Elections (DL).......................................................................................................................................A-15319. <strong>Office</strong> <strong>of</strong> Campaign Finance (CJ) .......................................................................................................................A-16120. Public Employee Relations Board (CG).............................................................................................................A-17121. <strong>Office</strong> <strong>of</strong> Employee Appeals (CH)......................................................................................................................A-17722 Metropolitan Washington Council <strong>of</strong> Governments (EA)...............................................................................A-18523. Municipal Facilities: Non-Capital (ZX)..............................................................................................................A-19124. <strong>Office</strong> <strong>of</strong> <strong>the</strong> Attorney General for <strong>the</strong> District <strong>of</strong> Columbia (CB) .................................................................A-19525. D.C. Board <strong>of</strong> Ethics and Government Accountability (AG)..........................................................................A-21726. Access to Justice (AJ) ............................................................................................................................................A-22327. <strong>Office</strong> <strong>of</strong> <strong>the</strong> Inspector General (AD) ................................................................................................................A-22728. <strong>Office</strong> <strong>of</strong> <strong>the</strong> <strong>Chief</strong> <strong>Financial</strong> <strong>Office</strong>r (AT).........................................................................................................A-235FY 2013 Proposed <strong>Budget</strong> and <strong>Financial</strong> Plan: <strong>Agency</strong> <strong>Budget</strong> <strong>Chapters</strong> - Part I
How toRead <strong>the</strong><strong>Budget</strong> and<strong>Financial</strong>Plan
How to Read <strong>the</strong> <strong>Budget</strong> and <strong>Financial</strong>PlanThe District <strong>of</strong> Columbia’s FY 2013 Proposed <strong>Budget</strong> and <strong>Financial</strong>Plan is a communication tool that presents and explains policy priorities,agency operations, including programmatic/organizational structures,and performance measures in <strong>the</strong> context <strong>of</strong> <strong>the</strong> <strong>Financial</strong> Plan,which shows <strong>the</strong> District’s sources <strong>of</strong> revenue and planned expenditures.The <strong>Budget</strong> and <strong>Financial</strong> Plan include forecasts <strong>of</strong> economicand financial conditions, current and planned long-term debt financing,policy decisions, and o<strong>the</strong>r important financial information for<strong>the</strong> District's government, all <strong>of</strong> which are essential elements for accuratefinancial reporting and sound management <strong>of</strong> public resources.This chapter, How to Read <strong>the</strong> <strong>Budget</strong> and <strong>Financial</strong> Plan, is a guide for understanding <strong>the</strong> sections <strong>of</strong> this budgetvolume that define <strong>the</strong> budget priorities for <strong>the</strong> District. These sections are consistent with <strong>the</strong> NationalAdvisory Council on State and Local <strong>Budget</strong>ing’s recommended budget practices, which call for a presentation <strong>of</strong>information to provide readers with a guide to government programs and organizational structure. Additionally,<strong>the</strong>se sections are consistent with <strong>the</strong> standards <strong>of</strong> <strong>the</strong> Government Finance <strong>Office</strong>rs Association for <strong>the</strong>Distinguished <strong>Budget</strong> Presentation Award.The FY 2013 <strong>Budget</strong> and <strong>Financial</strong> Plan is presented in six volumes summarized as follows:Executive Summary (Volume 1) - provides a high-level summary <strong>of</strong> <strong>the</strong> budget and financial information, includingsections describing new initiatives within <strong>the</strong> District's proposed budget, <strong>the</strong> transmittal letter from <strong>the</strong> Mayor,information on <strong>the</strong> strategic budgeting process, <strong>the</strong> District’s five-year financial plan, detailed information on <strong>the</strong>District’s projected revenues and expenditures, and summary information about <strong>the</strong> Capital Improvements Plan.In addition, this volume includes information about <strong>the</strong> District's budgetary and financial management policies,grant match and maintenance <strong>of</strong> effort, a glossary <strong>of</strong> budget terms, budget summary tables by agency and fundtype, and <strong>the</strong> <strong>Budget</strong> Request Act legislation that serves as <strong>the</strong> basis for <strong>the</strong> District’s federal appropriations act.<strong>Agency</strong> <strong>Budget</strong> <strong>Chapters</strong> (Volumes 2 and 3) - describes, by appropriation title, <strong>the</strong> operating budgets for each <strong>of</strong><strong>the</strong> District's agencies. Appropriation titles categorize <strong>the</strong> general areas <strong>of</strong> services provided by <strong>the</strong> District, onbehalf <strong>of</strong> its citizens and are listed on <strong>the</strong> table <strong>of</strong> contents. Examples are Economic Development and Regulation,Public Education System, and Human Support Services.FY 2013 Proposed <strong>Budget</strong> and <strong>Financial</strong> PlanHow to Read <strong>the</strong> <strong>Budget</strong> and <strong>Financial</strong> Plani
Operating Appendices (Volumes 4 and 5) - includes detailed supporting tables displaying <strong>the</strong> proposed expendituresand full-time equivalents in <strong>the</strong> operating budgets that are described in Volumes 2 and 3. Please note: <strong>the</strong>sevolumes are available exclusively on <strong>the</strong> Government <strong>of</strong> <strong>the</strong> District <strong>of</strong> Columbia website at http://cfo.dc.gov/.Capital Improvements Plan (Including Highway Trust Fund) (Volume 6) - describes <strong>the</strong> District’s proposed sixyearCapital Improvements Plan for all <strong>of</strong> <strong>the</strong> District's agencies. The Highway Trust Fund describes <strong>the</strong> District’sproposed FY 2013 to FY 2018 planned transportation projects including federal highway grants.Detailed information on <strong>the</strong> chapter contents <strong>of</strong> each volume include:Volume 1: Executive SummaryIncludes <strong>the</strong> following sections:Introduction: FY 2012 Proposed <strong>Budget</strong> and <strong>Financial</strong> PlanThis chapter is a narrative and graphic summary <strong>of</strong> <strong>the</strong> proposed budget and financial plan. It describes <strong>the</strong> overallproposed budget, including <strong>the</strong> sources and uses <strong>of</strong> public funds, and compares <strong>the</strong> prior year's approved budgetto <strong>the</strong> current one. The chapter also explains <strong>the</strong> budget development process and calendar for FY 2013.Strategic <strong>Budget</strong>ingThis chapter describes <strong>the</strong> initiatives that <strong>the</strong> District is undertaking to improve budgeting and management <strong>of</strong>resources. It includes a description <strong>of</strong> <strong>the</strong> District's continued efforts in and progress toward Performance-Based<strong>Budget</strong>ing (PBB), which is <strong>the</strong> District's initiative to align resources with results through benchmarking, performancemeasurement, performance planning, and service-level budgeting.<strong>Financial</strong> PlanThe <strong>Financial</strong> Plan summarizes planned revenues and expenditures from FY 2013 through FY 2016. This chapterincludes financing sources, uses, and <strong>the</strong> assumptions used to derive <strong>the</strong> District’s short-term and long-term economicoutlook.RevenueThis chapter shows current revenue projections for each revenue type as certified by <strong>the</strong> <strong>Office</strong> <strong>of</strong> <strong>the</strong> <strong>Chief</strong><strong>Financial</strong> <strong>Office</strong>r. It also details <strong>the</strong> District's revenue sources, provides an overview <strong>of</strong> <strong>the</strong> District’s and regionaleconomy and economic trends, and <strong>the</strong> revenue outlook from FY 2013 through FY 2016.Operating ExpendituresThis chapter describes <strong>the</strong> District's recent local expenditures. It includes analysis <strong>of</strong> expenditures between FY 2008and FY 2011, both by agency and by expense category, e.g. personnel, supplies, and fixed costs.Capital Improvements Plan (CIP)This chapter describes <strong>the</strong> overall CIP, including <strong>the</strong> sources and uses <strong>of</strong> Capital funds.How to Read <strong>the</strong> <strong>Budget</strong> and <strong>Financial</strong> PlaniiFY 2013 Proposed <strong>Budget</strong> and <strong>Financial</strong> Plan
AppendicesThe last section <strong>of</strong> <strong>the</strong> Executive Summary includes explanations <strong>of</strong> specific items to <strong>the</strong> District's budget:• The D.C. Comprehensive <strong>Financial</strong> Management Policy provides a framework for fiscal decision-making by<strong>the</strong> District to ensure that financial resources are available to meet <strong>the</strong> present and future needs <strong>of</strong> District citizens;• The Grant Match and Maintenance <strong>of</strong> Effort section includes a table by agency and grant number that provides<strong>the</strong> required grant match and maintenance <strong>of</strong> effort contributions for federal and private grants receivedby <strong>the</strong> District;• The Basis <strong>of</strong> <strong>Budget</strong>ing and Accounting section describes <strong>the</strong> basis <strong>of</strong> budgeting and accounting, enabling <strong>the</strong>readers to understand <strong>the</strong> presentation methods <strong>of</strong> <strong>the</strong> District's finances;• The Glossary <strong>of</strong> <strong>Budget</strong> Terms section describes unique budgeting, accounting, and District terms that maynot be known by <strong>the</strong> general reader;• The Summary Tables detail <strong>the</strong> District's proposed operating budget by agency and fund type for both budgeteddollars and positions; and• The <strong>Budget</strong> Request Act section is <strong>the</strong> legislation that <strong>the</strong> District uses to enact <strong>the</strong> District's budget via locallaw, and serves as <strong>the</strong> basis for <strong>the</strong> District’s federal appropriations act to be enacted into law by <strong>the</strong> United StatesCongress and President through <strong>the</strong> federal appropriations process.Volumes 2 and 3: <strong>Agency</strong> <strong>Budget</strong> <strong>Chapters</strong> - Part I & IIThese volumes include agency chapters that describe available resources, <strong>the</strong>ir uses, and <strong>the</strong> achieved and anticipatedoutcomes as a result <strong>of</strong> <strong>the</strong>se expenditures. <strong>Chapters</strong> in <strong>the</strong>se volumes are grouped by appropriation title, andeach chapter contains <strong>the</strong> following sections, as applicable:Header Information:• <strong>Agency</strong> name and budget code;• Website address and telephone; and• FY 2013 proposed operating budget table.Introduction:• <strong>Agency</strong> mission; and• Summary <strong>of</strong> Services<strong>Financial</strong> and Program Information:• Proposed Funding by Source table;• Proposed Full-Time Equivalents table;• Proposed Expenditure by Comptroller Source Group table;• Division/Program descriptions;• Proposed Expenditure by Division/Program table;• FY 2013 Proposed <strong>Budget</strong> Changes;• FY 2012 Approved <strong>Budget</strong> to FY 2013 Proposed <strong>Budget</strong> reconciliation table;• <strong>Agency</strong> Performance Plan Objectives; and• <strong>Agency</strong> Performance Measures table.FY 2013 Proposed <strong>Budget</strong> and <strong>Financial</strong> PlanHow to Read <strong>the</strong> <strong>Budget</strong> and <strong>Financial</strong> Planiii
FY 2013 Proposed <strong>Budget</strong> ChangesThe FY 2013 Proposed <strong>Budget</strong> Changes section within each agency chapter provides a comprehensive explanation<strong>of</strong> <strong>the</strong> FY 2012 Approved <strong>Budget</strong> to FY 2013 Proposed <strong>Budget</strong>, by Revenue Type table that appears in nearly everychapter. The following are desciptions <strong>of</strong> calculations done for <strong>the</strong> specific assumptions applied to certaincategories within one particular agency or within specific groups <strong>of</strong> agencies. Please see <strong>the</strong> CurrentServices Funding Level (CSFL) Development appendix in this volume for more information about <strong>the</strong>CSFL methodology.• Recurring <strong>Budget</strong> Items: - Where applicable, recurring budget items were identified to adjust specificexpenditure items.• Fixed Cost Inflation Factor: – The fixed costs for <strong>the</strong> FY 2013 CSFL were derived from cost estimatesprovided by <strong>the</strong> Department <strong>of</strong> General Services (DGS). Additionally, <strong>the</strong> <strong>Office</strong> <strong>of</strong> Finance andResource Management (OFRM) and <strong>the</strong> <strong>Office</strong> <strong>of</strong> <strong>the</strong> <strong>Chief</strong> Technology <strong>Office</strong>r (OCTO) will centrallymanage certain costs within <strong>the</strong>ir agency budgets.• Medicaid Growth Factor: The Medicaid growth factor on <strong>the</strong> cost <strong>of</strong> health care services in <strong>the</strong> Districtprovided by <strong>the</strong> Department <strong>of</strong> Health Care Finance (DHCF) and <strong>the</strong> public provider agencies fluctuatedbased on <strong>the</strong> prevailing conditions <strong>of</strong> <strong>the</strong> economy and changes in <strong>the</strong> federal government’sMedicaid policy. Based on <strong>the</strong> 8.1 percent growth factor provided by DHCF, OBP calculated baselinefunding for Medicaid in <strong>the</strong> FY 2013 CSFL.• Student Funding Formula Inflation Factor: The funding formula was adjusted by <strong>the</strong> 2.0 CPI toaccount for inflationary costs that are generally associated with educating students in <strong>the</strong> District <strong>of</strong>Columbia Public Schools and Public Charters Schools.• Debt Service Adjustments: Projected adjustments were provided by <strong>the</strong> <strong>Office</strong> <strong>of</strong> Finance andTreasury.• O<strong>the</strong>r Adjustments (i.e., Operating Impact to Capital): This category was used to capture adjustmentsthat did not meet <strong>the</strong> criteria for all o<strong>the</strong>r adjustments.This section includes major changes within <strong>the</strong> agency budget by program, fund and full-time equivalentsfrom <strong>the</strong> initial request through <strong>the</strong> policy decisions made by <strong>the</strong> Mayor. The FY 2013 Proposed <strong>Budget</strong>Changes section uses <strong>the</strong> following terms to describe budgetary or programmatic changes:I. Actions with an impact on services:• Create: New funding for new programs that previously didn’t exist (e.g., Establish PermanentSupportive Housing program to transition vulnerable individuals from homeless to stable housing).• Enhance: More funding to improve <strong>the</strong> quality or quantity <strong>of</strong> an existing service (e.g., IncreaseSummer Youth Employment Program to connect 21,000 youth with jobs).• Eliminate: Total elimination <strong>of</strong> an existing services, with no anticipation <strong>of</strong> <strong>the</strong> service being providedby ano<strong>the</strong>r entity (e.g. Eliminate funding for Motor Vehicle Theft Prevention Commission).• Reduce: Reduction, but not elimination, <strong>of</strong> an existing service (e.g., Close Brentwood Service Centerand provide services at o<strong>the</strong>r DMV locations; Realign staffing in <strong>the</strong> Fleet Management division.• Optimize: Increase service while decreasing cost (e.g., Transition service provision from CSA to contractedproviders).II. Actions with no service impact:• Cost Increase: Additional funds necessary to continue service at current levels (e.g., Fund annual contractescalator in Police/Fire Clinic contract).• Cost Decrease: Reduction in cost without a service impact (e.g., Align energy budget with revisedDGS estimate).How to Read <strong>the</strong> <strong>Budget</strong> and <strong>Financial</strong> PlanivFY 2013 Proposed <strong>Budget</strong> and <strong>Financial</strong> Plan
• Transfer In: Shift <strong>of</strong> an existing program or operation from ano<strong>the</strong>r District agency (e.g., Transfer videomonitoring personnel from o<strong>the</strong>r agencies to VIPS center).• Transfer Out: Shift <strong>of</strong> an existing program or operation to ano<strong>the</strong>r District agency (e.g., Transfer 911call center to OUC).• Shift: Shift an existing program or operation from one Fund type to ano<strong>the</strong>r (e.g., Shift eligible administrativeexpenses to CDBG grant).• Correct: Make a change with no dollar impact, such as eliminating unfunded FTE positions.• No Change: The agency has no changes in funding and/or budget structures from FY 2012 to FY2013.• Technical Adjustments: An increase or decrease to <strong>the</strong> budget that is required because <strong>of</strong> a legislativemandate and/or to correct an error/omission.Please see an example <strong>of</strong> an agency narrative at <strong>the</strong> end <strong>of</strong> this chapter to help <strong>the</strong> reader navigate <strong>the</strong> <strong>Agency</strong> <strong>Budget</strong>Chapter volume. The example shows an agency with a performance plan. Callout boxes highlight <strong>the</strong> features discussedabove.Volumes 4 and 5: Operating Appendices - Part I and IIThese two volumes provide supporting tables to each agency's proposed operating budget. The tables generallyinclude FY 2011 actual expenditures, <strong>the</strong> FY 2012 approved budget, <strong>the</strong> FY 2013 proposed budget, and <strong>the</strong> changefrom FY 2012 to FY 2013 (unless noted). The following tables are provided:Schedule 30-PBB - dollars summarized by program, activity, and governmental fund (governmental fund breakoutis for FY 2013 only and includes general fund detail);Schedule 40-PBB - dollars summarized by program, comptroller source group and governmental fund;Schedule 40G-PBB - dollars summarized by program, comptroller source group and appropriated fund within <strong>the</strong>General Fund;Schedule 41 - dollars and FTEs summarized by comptroller source group and governmental fund;Schedule 41G - dollars and FTEs summarized by comptroller source group and appropriated fund within <strong>the</strong>General Fund; andSchedule 80 - dollars and FTEs summarized by revenue type, appropriated fund, and revenue source (for <strong>the</strong> FY2013 Proposed <strong>Budget</strong> only).Volume 6: Capital Improvements Plan (Including Highway Trust Fund)This volume covers <strong>the</strong> District's FY 2013 - FY 2018 Capital Improvements Plan (CIP) and <strong>the</strong> Highway TrustFund. The Capital Appendices chapter includes:• An Introduction chapter that describes <strong>the</strong> overall CIP, including <strong>the</strong> sources and uses <strong>of</strong> capital funds, <strong>the</strong>District's policies and procedures for its capital budget and debt, and <strong>the</strong> FY 2013 planning process;• Project Description Forms that comprise <strong>the</strong> major portion <strong>of</strong> <strong>the</strong> capital appendices volume. The projectdescription forms provide details on capital projects funded by general obligation bonds, pay-as-you-go(PAYGO) capital, <strong>the</strong> Master Equipment Lease program, and <strong>the</strong> Local Street Maintenance Fund. Each pageshows one subproject's planned allotments for FY 2013 through FY 2018, including a description, its annualoperating impact, milestone data, and its location; andFY 2013 Proposed <strong>Budget</strong> and <strong>Financial</strong> PlanHow to Read <strong>the</strong> <strong>Budget</strong> and <strong>Financial</strong> Planv
• Appendices that provide supporting tables and a glossary about <strong>the</strong> District's capital budget, including:- The FY 2013 Appropriated <strong>Budget</strong> Authority Request table that summarizes proposed new projects andchanges (increase or decrease) for ongoing projects by agency, subproject, and funding source;- The FY 2013 - FY 2018 Planned Expenditures from New Allotments table that summarizes <strong>the</strong> newallotments' planned FY 2013-FY 2018 expenditures by agency, project, and subproject;- The FY 2013 - FY 2018 Planned Funding table that summarizes <strong>the</strong> FY 2013 and six-year fundingsources for all new allotments by agency, subproject, and funding source;- The Balance <strong>of</strong> Capital <strong>Budget</strong> Authority, All Projects table that summarizes <strong>the</strong> lifetime budget authority, life-to-date expenditures, total commitments, and balance <strong>of</strong> budget authority for all ongoing capitalprojects by agency, project, and authority (District versus federal);- The Capital Project Cost Estimate Variance table displays changes to project costs since <strong>the</strong> FY 2013<strong>Budget</strong>;- Rescissions, Redirections, and Reprogrammings; and- An overview <strong>of</strong> <strong>the</strong> District <strong>of</strong> Columbia's Water and Sewer Authority's FY 2011 - FY 2020 capitalimprovements plan.Highway Trust FundThis chapter covers <strong>the</strong> District's FY 2013 through FY 2018 proposed Highway Trust Fund expenditures, including:• An Introduction chapter, which describes <strong>the</strong> Highway Trust Fund program, including <strong>the</strong> sources and uses <strong>of</strong><strong>the</strong> funds, <strong>the</strong> District's policies and procedures for <strong>the</strong> trust fund, and <strong>the</strong> FY 2013 planning process;• The Project Description Forms, which comprise <strong>the</strong> majority <strong>of</strong> <strong>the</strong> Highway Trust Fund volume. Each pageshows planned allotments for FY 2013 through FY 2018, description, annual operating impact, milestone data,and location for two sub-projects; and• Appendices that provide supporting tables for <strong>the</strong> District's Highway Trust Fund program.How to Read <strong>the</strong> <strong>Budget</strong> and <strong>Financial</strong> PlanviFY 2013 Proposed <strong>Budget</strong> and <strong>Financial</strong> Plan
<strong>Agency</strong> budget code<strong>Agency</strong> nameThis shows <strong>the</strong> agency’s FY 2011 actual expenditures, FY 2012approved budget, <strong>the</strong> FY 2013 proposed budget, and <strong>the</strong> percentvariance from FY 2013 to FY 2012. This includes <strong>the</strong> agency’soperating budget and FTEs.<strong>Agency</strong> Website address and Telephone numberThis section describes <strong>the</strong> agency’smission and purpose.A Summary <strong>of</strong> Services is a conciseexplanation <strong>of</strong> <strong>the</strong> agency’s keyfunctions.FY 2013 Proposed <strong>Budget</strong> and <strong>Financial</strong> PlanHow to Read <strong>the</strong> <strong>Budget</strong> and <strong>Financial</strong> Planvii
This table presents <strong>the</strong> agency's total operating budget from each fundingsource (Local, Dedicated Taxes, Special Purpose Revenue, FederalPayments, Federal Grants, Medicaid, Private Grants, or Intra-Districtsources). It shows a comparison <strong>of</strong> <strong>the</strong> FY 2010 actual, FY 2011 actual, FY2012 approved, and FY 2013 proposed budgets.How to Read <strong>the</strong> <strong>Budget</strong> and <strong>Financial</strong> PlanviiiFY 2013 Proposed <strong>Budget</strong> and <strong>Financial</strong> Plan
This table lists <strong>the</strong> agency’s FTEs fortwo prior years, <strong>the</strong> current year, andupcoming fiscal year by revenue type.This table lists <strong>the</strong> agency's totaloperating expenditures for FY 2010,FY 2011, FY 2012 approved budget,and FY 2013 proposed budget at <strong>the</strong>Comptroller Source Group level.FY 2013 Proposed <strong>Budget</strong> and <strong>Financial</strong> PlanHow to Read <strong>the</strong> <strong>Budget</strong> and <strong>Financial</strong> Planix
This indicates <strong>the</strong> specific programs (or divisions) andactivities within an agency. It contains detaileddescriptions <strong>of</strong> <strong>the</strong>ir purpose and how <strong>the</strong>y contributeto <strong>the</strong> lives <strong>of</strong> District residents and visitors.How to Read <strong>the</strong> <strong>Budget</strong> and <strong>Financial</strong> PlanxFY 2013 Proposed <strong>Budget</strong> and <strong>Financial</strong> Plan
This table provides an overall budgeted funding level andnumber <strong>of</strong> approved FTEs for FY 2011 actuals, FY 2012approved budget and FY 2013 proposed budget for specificprograms (or divisions) and activities.FY 2013 Proposed <strong>Budget</strong> and <strong>Financial</strong> PlanHow to Read <strong>the</strong> <strong>Budget</strong> and <strong>Financial</strong> Planxi
The FY 2013 Proposed <strong>Budget</strong> Changes sectionprovides a comprehensive explanation<strong>of</strong> Table 5; it includes major internalchanges within <strong>the</strong> budget including CSFLchanges, changes to <strong>the</strong> inital adjustedbudget ,and policy initiatives.New for FY 2013, an explanation <strong>of</strong> Current ServicesFunding Level (CSFL) changes is represented separatelyfor within <strong>the</strong> budget. For more detail on <strong>the</strong>CSFL, please see <strong>the</strong> appendix in this volume.This table describes <strong>the</strong> changes made to anagency during <strong>the</strong> overall budget formulationprocess by fund and by program (or divisions).Describes policy changes that are <strong>the</strong> result<strong>of</strong> proposed cost-saving initiatives, transfers<strong>of</strong> funding or function from one agency toano<strong>the</strong>r, and o<strong>the</strong>r budget changes.How to Read <strong>the</strong> <strong>Budget</strong> and <strong>Financial</strong> PlanxiiFY 2013 Proposed <strong>Budget</strong> and <strong>Financial</strong> Plan
Typically called Table 5, <strong>the</strong> FY 2012Approved <strong>Budget</strong> to FY 2013 Proposed<strong>Budget</strong>, by Revenue Type tabledescribes <strong>the</strong> changes made to anagency from <strong>the</strong> CFSL to <strong>the</strong> policydecisions by fund and by program.FY 2013 Proposed <strong>Budget</strong> and <strong>Financial</strong> PlanHow to Read <strong>the</strong> <strong>Budget</strong> and <strong>Financial</strong> Planxiii
<strong>Agency</strong> performance measuresdescribe specific agency performanceobjectives or goals from <strong>the</strong> FY 2010actual through <strong>the</strong> FY 2014 projectedresult.How to Read <strong>the</strong> <strong>Budget</strong> and <strong>Financial</strong> PlanxivFY 2013 Proposed <strong>Budget</strong> and <strong>Financial</strong> Plan
<strong>Agency</strong> <strong>Budget</strong><strong>Chapters</strong>A - Governmental Direction and SupportB - Economic Development and RegulationC - Public Safety and Justice
AGovernmental Directionand SupportCouncil <strong>of</strong> <strong>the</strong> District <strong>of</strong> Columbia (AB)..............................................................A-1<strong>Office</strong> <strong>of</strong> <strong>the</strong> District <strong>of</strong> Columbia Auditor (AC)..................................................A-9Advisory Neighborhood Commissions (DX).......................................................A-17<strong>Office</strong> <strong>of</strong> <strong>the</strong> Mayor (AA)......................................................................................A-23<strong>Office</strong> <strong>of</strong> Community Affairs (RP) .......................................................................A-33Serve DC (RS)........................................................................................................A-37<strong>Office</strong> <strong>of</strong> <strong>the</strong> Secretary (BA) ..................................................................................A-41<strong>Office</strong> <strong>of</strong> <strong>the</strong> City Administrator (AE) .................................................................A-49D.C. <strong>Office</strong> <strong>of</strong> Risk Management (RK) ...............................................................A-57D.C. Department <strong>of</strong> Human Resources (BE)......................................................A-67<strong>Office</strong> <strong>of</strong> Disability Rights (JR).............................................................................A-81Medical Liability Captive Insurance <strong>Agency</strong> (RJ)................................................A-89<strong>Office</strong> <strong>of</strong> Finance and Resource Management (AS)............................................A-93<strong>Office</strong> <strong>of</strong> Contracting and Procurement (PO)....................................................A-101<strong>Office</strong> <strong>of</strong> <strong>the</strong> <strong>Chief</strong> Technology <strong>Office</strong>r (TO)....................................................A-115Department <strong>of</strong> General Services (AM) ..............................................................A-129Contract Appeals Board (AF)..............................................................................A-147Board <strong>of</strong> Elections (DL) ......................................................................................A-153<strong>Office</strong> <strong>of</strong> Campaign Finance (CJ) .......................................................................A-161Public Employee Relations Board (CG).............................................................A-171<strong>Office</strong> <strong>of</strong> Employee Appeals (CH)......................................................................A-177Metropolitan Washington Council <strong>of</strong> Governments (EA)...............................A-185Municipal Facilities: Non-Capital (ZX)..............................................................A-191<strong>Office</strong> <strong>of</strong> <strong>the</strong> Attorney General for <strong>the</strong> District <strong>of</strong> Columbia (CB) .................A-195D.C. Board <strong>of</strong> Ethics and Government Accountability (AG)..........................A-217Access to Justice (AJ)............................................................................................A-223<strong>Office</strong> <strong>of</strong> <strong>the</strong> Inspector General (AD) ................................................................A-227<strong>Office</strong> <strong>of</strong> <strong>the</strong> <strong>Chief</strong> <strong>Financial</strong> <strong>Office</strong>r (AT).........................................................A-235
Council <strong>of</strong> <strong>the</strong> District <strong>of</strong> Columbia(AB0)www.dccouncil.usTelephone: 202-724-8000% ChangeFY 2011 FY 2012 FY 2013 fromDescription Actual Approved Proposed FY 2012Operating <strong>Budget</strong> $18,265,162 $19,026,085 $21,095,559 10.9FTEs 187.2 189.0 195.5 3.4The Council <strong>of</strong> <strong>the</strong> District <strong>of</strong> Columbia is <strong>the</strong> legislative branch <strong>of</strong><strong>the</strong> District <strong>of</strong> Columbia government. The Council enacts laws;reviews and approves <strong>the</strong> government’s annual operating and capitalbudgets; and conducts oversight <strong>of</strong> <strong>the</strong> performance <strong>of</strong> agencies,boards and commissions to demand efficiency and accountability inservice delivery and appropriate use <strong>of</strong> government resources.Statistics for January 2011 through December 2011 from Council Period 19Bills IntroducedPermanent: 697Emergency: 210Temporary: 97Acts AdoptedPermanent: 298Emergency: 174Temporary: 54Proposed Resolutions Introduced: 234Resolutions Adopted: 148Laws Adopted: 81The agency’s FY 2013 proposed budget is presented in <strong>the</strong> following tables:FY 2013 Proposed <strong>Budget</strong> and <strong>Financial</strong> PlanCouncil <strong>of</strong> <strong>the</strong> District <strong>of</strong> ColumbiaA-1
FY 2013 Proposed Gross Funds Operating <strong>Budget</strong>, by Revenue TypeTable AB0-1 contains <strong>the</strong> proposed FY 2013 agency budget compared to <strong>the</strong> FY 2012 approved budget. It alsoprovides FY 2010 and FY 2011 actual expenditures.Table AB0-1(dollars in thousands)ChangeAppropriated FundActual Actual Approved Proposed from PercentFY 2010 FY 2011 FY 2012 FY 2013 FY 2012 Change*General FundLocal Funds 18,768 18,265 19,026 21,007 1,980 10.4Total for General Fund 18,768 18,265 19,026 21,007 1,980 10.4Intra-District FundsIntra-District Funds 0 0 0 89 89 N/ATotal for Intra-District Funds 0 0 0 89 89 N/AGross Funds 18,768 18,265 19,026 21,096 2,069 10.9*Percent change is based on whole dollars.Note: If applicable, for a breakdown <strong>of</strong> each Grant (Federal and Private), Special Purpose Revenue type and Intra-District agreement,please refer to Schedule 80 <strong>Agency</strong> Summary by Revenue Source in <strong>the</strong> FY 2013 Operating Appendices located on <strong>the</strong> <strong>Office</strong> <strong>of</strong> <strong>the</strong><strong>Chief</strong> <strong>Financial</strong> <strong>Office</strong>r’s website.FY 2013 Proposed Full-Time Equivalents, by Revenue TypeTable AB0-2 contains <strong>the</strong> proposed FY 2013 FTE level compared to <strong>the</strong> FY 2012 approved FTE level by revenuetype. It also provides FY 2010 and FY 2011 actual data.Table AB0-2ChangeActual Actual Approved Proposed from PercentAppropriated Fund FY 2010 FY 2011 FY 2012 FY 2013 FY 2012 ChangeGeneral FundLocal Funds 187.7 187.2 189.0 195.5 6.5 3.4Total for General Fund 187.7 187.2 189.0 195.5 6.5 3.4Total Proposed FTEs 187.7 187.2 189.0 195.5 6.5 3.4Council <strong>of</strong> <strong>the</strong> District <strong>of</strong> ColumbiaA-2FY 2013 Proposed <strong>Budget</strong> and <strong>Financial</strong> Plan
FY 2013 Proposed Operating <strong>Budget</strong>, by Comptroller Source GroupTable AB0-3 contains <strong>the</strong> proposed FY 2013 budget at <strong>the</strong> Comptroller Source Group (object class) level comparedto <strong>the</strong> FY 2012 approved budget. It also provides FY 2010 and FY 2011 actual expenditures.Table AB0-3(dollars in thousands)ChangeActual Actual Approved Proposed from PercentComptroller Source Group FY 2010 FY 2011 FY 2012 FY 2013 FY 2012 Change*11 - Regular Pay - Continuing Full Time 12,584 9,769 13,529 14,919 1,390 10.312 - Regular Pay - O<strong>the</strong>r 1,778 3,702 537 0 -537 -100.013 - Additional Gross Pay 160 618 0 0 0 N/A14 - Fringe Benefits - Current Personnel 2,540 2,479 2,808 3,248 440 15.715 - Overtime Pay 4 2 0 0 0 N/ASubtotal Personal Services (PS) 17,065 16,570 16,874 18,167 1,293 7.720 - Supplies and Materials 108 126 134 223 89 66.531 - Telephone, Telegraph, Telegram, Etc. 115 127 147 147 0 0.040 - O<strong>the</strong>r Services and Charges 1,342 1,351 1,771 2,458 688 38.870 - Equipment and Equipment Rental 138 91 100 100 0 0.0Subtotal Nonpersonal Services (NPS) 1,703 1,695 2,152 2,929 777 36.1Gross Funds 18,768 18,265 19,026 21,096 2,069 10.9*Percent change is based on whole dollars.FY 2013 Proposed <strong>Budget</strong> and <strong>Financial</strong> PlanCouncil <strong>of</strong> <strong>the</strong> District <strong>of</strong> ColumbiaA-3
Program DescriptionThe Council <strong>of</strong> <strong>the</strong> District <strong>of</strong> Columbia operates through <strong>the</strong> following 4 programs:Council Administration – provides administrative support and technical expertise to <strong>the</strong> Council <strong>of</strong> <strong>the</strong> District <strong>of</strong>Columbia through <strong>the</strong> Council Fixed Costs Account and Council Benefits activities, which provide funding for allCouncil-wide fixed costs and Fringe Benefits, respectively.Council Central <strong>Office</strong>s – provides administrative support and technical expertise to <strong>the</strong> Council <strong>of</strong> <strong>the</strong> District <strong>of</strong>Columbia.This program contains <strong>the</strong> following 4 activities:■ Secretary to <strong>the</strong> Council – provides records <strong>of</strong> Council actions including <strong>the</strong> filing <strong>of</strong> bills and proposed resolutions,amendments to bills and resolutions, and requests for hearings, committee reports, and o<strong>the</strong>r recordsand reports assigned by <strong>the</strong> Rules, <strong>the</strong> Council, or <strong>the</strong> Chairman; and is responsible for proposing and administering<strong>the</strong> fiscal year budget <strong>of</strong> <strong>the</strong> Council;■ General Counsel – provides advice to <strong>the</strong> Council on matters <strong>of</strong> parliamentary procedure, identifies legislativeproblems, provides members with alternatives in terms <strong>of</strong> policy options to solve those problems, represents <strong>the</strong>Council in any legal action to which it is a party, supervises <strong>the</strong> publication <strong>of</strong> <strong>the</strong> District <strong>of</strong> Columbia OfficialCode, makes legislative drafting assistance available to all members, engrosses and enrolls measures, and makesnecessary technical and conforming changes in measures during enrollment;■ <strong>Office</strong> <strong>of</strong> <strong>the</strong> <strong>Budget</strong> Director – provides advice to Councilmembers on matters related to <strong>the</strong> budget including<strong>the</strong> development <strong>of</strong> annual and multi-year budgets and financial plans, reviews contracts and reprogrammingactions, and analyzes <strong>the</strong> fiscal impact <strong>of</strong> legislation. The <strong>of</strong>fice coordinates <strong>the</strong> submission <strong>of</strong> budgetreports and <strong>the</strong> annual <strong>Budget</strong> Support Act and provides <strong>the</strong> support needed for an efficient Council budgetprocess; and■ <strong>Office</strong> <strong>of</strong> Information Technology – provides planning, acquisition, and maintenance support <strong>of</strong> informationtechnology hardware and s<strong>of</strong>tware for Council staff.Councilmembers – provides for <strong>the</strong> budgets <strong>of</strong> <strong>the</strong> 13 elected Councilmembers <strong>of</strong> <strong>the</strong> District <strong>of</strong> Columbia. Eight<strong>of</strong> <strong>the</strong> elected Councilmembers represent identified Wards in <strong>the</strong> District, and <strong>the</strong> remaining five members, including<strong>the</strong> Chairman <strong>of</strong> <strong>the</strong> Council, are elected at-large.This program contains <strong>the</strong> following 13 activities:■ The Chairman is <strong>the</strong> presiding and chief executive <strong>of</strong>ficer <strong>of</strong> <strong>the</strong> Council; and■ Each <strong>of</strong> <strong>the</strong> o<strong>the</strong>r 12 elected <strong>of</strong>ficials is under an activity defining <strong>the</strong> Ward represented or <strong>the</strong>ir position as anat-large representative.Council Committees – includes <strong>the</strong> 13 standing committees <strong>of</strong> <strong>the</strong> Council <strong>of</strong> <strong>the</strong> District <strong>of</strong> Columbia. Much<strong>of</strong> <strong>the</strong> work <strong>of</strong> <strong>the</strong> Council <strong>of</strong> <strong>the</strong> District <strong>of</strong> Columbia is conducted by 12 standing committees and <strong>the</strong>Committee <strong>of</strong> <strong>the</strong> Whole, which is chaired by <strong>the</strong> Chairman <strong>of</strong> <strong>the</strong> Council. Every Councilmember is a member<strong>of</strong> <strong>the</strong> Committee <strong>of</strong> <strong>the</strong> Whole. Committees are responsible for conducting hearings on proposed legislation andfor oversight matters.This program contains <strong>the</strong> following 13 activities:■ Committee <strong>of</strong> <strong>the</strong> Whole, which includes all Councilmembers;■ Committee on Aging and Community Affairs;■ Committee on Jobs and Workforce Development;■ Committee on Finance and Revenue;Council <strong>of</strong> <strong>the</strong> District <strong>of</strong> ColumbiaA-4FY 2013 Proposed <strong>Budget</strong> and <strong>Financial</strong> Plan
■■■■■■■■■Committee on Government Operations and <strong>the</strong> Environment;Committee on Health;Committee on Economic Development and Housing;Committee on Human Services;Committee on Libraries, Parks and Recreation;Committee on Public Safety and <strong>the</strong> Judiciary;Committee on Public Services and Consumer Affairs;Committee on Public Works and Transportation; andCommittee on Small and Local Business Development.Program Structure ChangeThe Council <strong>of</strong> <strong>the</strong> District <strong>of</strong> Columbia has no program structure changes in <strong>the</strong> FY 2013 proposed budget.FY 2013 Proposed Operating <strong>Budget</strong> and FTEs, by Program and ActivityTable AB0-4 contains <strong>the</strong> proposed FY 2013 budget by program and activity compared to <strong>the</strong> FY 2012 approved budget.It also provides <strong>the</strong> FY 2011 actual data.Table AB0-4(dollars in thousands)Dollars in ThousandsFull-Time EquivalentsChangeChangeActual Approved Proposed from Actual Approved Proposed fromProgram/Activity FY 2011 FY 2012 FY 2013 FY 2012 FY 2011 FY 2012 FY 2013 FY 2012(1000) Council Administration(1100) Council Administration 12 0 0 0 0.0 0.0 0.0 0.0(1101) Council Benefits 0 2,808 3,248 440 0.0 0.0 0.0 0.0(1102) Council Fixed Cost 127 147 147 0 0.0 0.0 0.0 0.0Subtotal (1000) Council Administration 139 2,955 3,395 440 0.0 0.0 0.0 0.0(2000) Council Central <strong>Office</strong>s(0025) Secretary to <strong>the</strong> Council 3,099 2,506 2,885 379 30.2 23.0 23.0 0.0(0026) General Counsel 985 1,020 1,234 214 9.4 10.0 11.5 1.5(0027) <strong>Office</strong> <strong>of</strong> <strong>the</strong> <strong>Budget</strong> Director 791 641 641 0 6.6 7.0 7.0 0.0(0028) Policy <strong>Office</strong> 168 0 0 0 5.7 0.0 0.0 0.0(0029) <strong>Office</strong> <strong>of</strong> Communications 65 0 0 0 0.0 0.0 0.0 0.0(0031) <strong>Office</strong> <strong>of</strong> Information Technology 475 1,010 1,413 403 0.0 6.0 6.0 0.0Subtotal (2000) Council Central <strong>Office</strong>s 5,582 5,176 6,173 996 52.0 46.0 47.5 1.5(3000) Councilmembers(0100) Councilmember Ward 1 617 429 429 0 5.7 6.0 6.0 0.0(0200) Councilmember Ward 2 566 429 429 0 5.7 6.0 6.0 0.0(0300) Councilmember Ward 3 598 429 429 0 5.7 6.0 6.0 0.0(0400) Councilmember Ward 4 593 429 429 0 5.7 6.0 6.0 0.0(0500) Councilmember Ward 5 671 429 429 0 5.7 6.0 6.0 0.0(0600) Councilmember Ward 6 592 429 429 0 5.7 6.0 6.0 0.0(0700) Councilmember Ward 7 622 429 429 0 5.7 6.0 6.0 0.0(0800) Councilmember Ward 8 596 429 429 0 5.7 6.0 6.0 0.0(Continued on next page)FY 2013 Proposed <strong>Budget</strong> and <strong>Financial</strong> PlanCouncil <strong>of</strong> <strong>the</strong> District <strong>of</strong> ColumbiaA-5
Table AB0-4 (Continued)(dollars in thousands)Dollars in ThousandsFull-Time EquivalentsChangeChangeActual Approved Proposed from Actual Approved Proposed fromProgram/Activity FY 2011 FY 2012 FY 2013 FY 2012 FY 2011 FY 2012 FY 2013 FY 2012(3000) Councilmembers (continued)(0900) Councilmember At-Large A 686 429 429 0 5.7 6.0 6.0 0.0(1010) Councilmember At-Large B 825 429 429 0 5.7 6.0 6.0 0.0(1011) Councilmember At-Large C 611 429 429 0 5.7 6.0 6.0 0.0(1012) Councilmember At-Large D 513 429 429 0 5.7 6.0 6.0 0.0(1300) Chairman 13 902 780 780 0 9.5 10.0 6.0 -4.0Subtotal (3000) Councilmembers 8,392 5,925 5,925 0 77.6 82.0 78.0 -4.0(4000) Committee(4020) Committee <strong>of</strong> <strong>the</strong> Whole (COW) 577 618 700 82 7.6 8.0 10.0 2.0(4025) Committee on Finance and Revenue 462 409 409 0 4.7 5.0 5.0 0.0(4030) Committee on Economic Development 267 409 0 -409 4.7 5.0 0.0 -5.0(4031) Committee on Small and Local Business Development 42 0 409 409 0.0 0.0 5.0 5.0(4035) Committee on Health 293 409 409 0 4.7 5.0 5.0 0.0(4040) Committee on Public Works and Transportation 332 409 409 0 4.7 5.0 5.0 0.0(4041) Committee on Jobs and Workforce Development 0 0 409 409 0.0 0.0 5.0 5.0(4045) Committee on Human Services 376 409 409 0 4.7 5.0 5.0 0.0(4050) Committee on Libraries, Parks and Recreation 239 337 409 71 3.8 4.0 5.0 1.0(4055) Committee on Public Services and Consumer Affairs 386 409 409 0 4.7 5.0 5.0 0.0(4060) Committee on Government Operations and <strong>the</strong> Environment 292 409 409 0 4.7 5.0 5.0 0.0(4065) Committee on Public Safety and Judiciary 359 409 409 0 4.7 5.0 5.0 0.0(4070) Committee on Economic Development and Housing 366 409 409 0 4.7 5.0 5.0 0.0(4090) Committee on Aging and Community Affairs 162 337 409 71 3.8 4.0 5.0 1.0Subtotal (4000) Committee 4,152 4,970 5,603 633 57.7 61.0 70.0 9.0Total Proposed Operating <strong>Budget</strong> 18,265 19,026 21,096 2,069 187.2 189.0 195.5 6.5(Change is calculated by whole numbers and numbers may not add up due to rounding)Note: For more detailed information regarding <strong>the</strong> proposed funding for <strong>the</strong> activities within this agency’s programs, please see Schedule 30-PBBProgram Summary by Activity in <strong>the</strong> FY 2013 Operating Appendices located on <strong>the</strong> <strong>Office</strong> <strong>of</strong> <strong>the</strong> <strong>Chief</strong> <strong>Financial</strong> <strong>Office</strong>r’s website.Council <strong>of</strong> <strong>the</strong> District <strong>of</strong> ColumbiaA-6FY 2013 Proposed <strong>Budget</strong> and <strong>Financial</strong> Plan
FY 2013 Proposed <strong>Budget</strong> ChangesThe Council <strong>of</strong> <strong>the</strong> District <strong>of</strong> Columbia’s proposed FY 2013 gross budget is $21,095,559, which represents a 10.9percent increase over <strong>the</strong> FY 2012 approved gross budget <strong>of</strong> $19,026,085. The budget is comprised <strong>of</strong> $21,006,559<strong>of</strong> Local funds and $89,000 <strong>of</strong> Intra-District funds.The Council <strong>of</strong> <strong>the</strong> District <strong>of</strong> Columbia’s budget reflects changes necessary to effectively serve <strong>the</strong> needs <strong>of</strong> Districtresident and <strong>the</strong> communities. The Council will continue to invest in technology, specifically, <strong>the</strong> Council website,so that <strong>the</strong> public can readily and effectively communicate with members <strong>of</strong> <strong>the</strong> Council.Current Services Funding LevelThe Current Services Funding Level (CSFL) is a Local funds ONLY representation <strong>of</strong> <strong>the</strong> true cost <strong>of</strong> operatingDistrict agencies, before consideration <strong>of</strong> policy decisions. The CSFL reflects changes from <strong>the</strong> FY 2012 approvedbudget across multiple programs, and it estimates how much it would cost an agency to continue its current programsand operations into <strong>the</strong> following fiscal year. The initial adjustments in <strong>the</strong> budget proposal representchanges that should be compared to <strong>the</strong> FY 2013 CSFL budget and not necessarily changes made to <strong>the</strong> FY 2012Local funds budget. The FY 2013 CSFL adjustments to <strong>the</strong> FY 2012 Local funds budget are described in table 5<strong>of</strong> this agency's budget chapter. Please see <strong>the</strong> CSFL Development section within Volume 1: Executive Summaryfor more information regarding <strong>the</strong> methodology used and components that comprise <strong>the</strong> CSFL.The Council’s FY 2013 CSFL budget is $19,334,832, which represents a $308,747, or 1.6 percent, increaseover <strong>the</strong> FY 2012 approved Local funds budget <strong>of</strong> $19,026,085.Initial Adjusted <strong>Budget</strong>Create: A total <strong>of</strong> $408,570 and 5.0 FTEs in Local funds support <strong>the</strong> establishment <strong>of</strong> <strong>the</strong> Committee on Jobs andWorkforce Development.Cost Increase: To support continued technology improvements, <strong>the</strong> Council budget includes $403,000 to establisha non-lapsing Information Technology Replacement fund within <strong>the</strong> Council Central <strong>Office</strong>s program (onetime).In <strong>the</strong> Council Administration program, <strong>the</strong> agency’s budget increased by $335,886 in Local funds andreflects certain Fringe Benefits adjustments. Also in this program, an increase <strong>of</strong> $250,000 reflects costs related to<strong>the</strong> planning and implementing <strong>of</strong> Emancipation Day events. In <strong>the</strong> Council Central <strong>Office</strong>s program, <strong>the</strong> budgetincludes $160,000 and 1.5 FTEs to support certain functions within <strong>the</strong> Council’s General Counsel <strong>Office</strong>,which includes <strong>the</strong> publishing <strong>of</strong> District statutes. A net increase <strong>of</strong> $45,313 in Local funds reflects operationalchanges within <strong>the</strong> agency including <strong>the</strong> conversion <strong>of</strong> term positions to full time, and modest increases in FixedCosts, Pr<strong>of</strong>essional Services, and salary costs within <strong>the</strong> Council Central <strong>Office</strong>s and Committee programs.In Intra-District funds, <strong>the</strong> agency budget reflects <strong>the</strong> establishment <strong>of</strong> an $89,000 agreement with <strong>the</strong> <strong>Office</strong><strong>of</strong> <strong>the</strong> Attorney General to support <strong>the</strong> publishing and purchase <strong>of</strong> <strong>the</strong> several volumes <strong>of</strong> <strong>the</strong> District <strong>of</strong> ColumbiaCode.Additionally Adjusted <strong>Budget</strong>Technical Adjustment: Adjustments <strong>of</strong> Fringe Benefits to restore <strong>the</strong> District Government contribution foremployee health insurance from 72 percent, implemented in <strong>the</strong> FY 2011 budget, to 75 percent in FY 2013, resultingin an increase <strong>of</strong> $69,262 in Local funds.FY 2013 Proposed <strong>Budget</strong> and <strong>Financial</strong> PlanCouncil <strong>of</strong> <strong>the</strong> District <strong>of</strong> ColumbiaA-7
FY 2012 Approved <strong>Budget</strong> to FY 2013 Proposed <strong>Budget</strong>, by Revenue TypeTable AB0-5 itemizes <strong>the</strong> changes by revenue type between <strong>the</strong> FY 2012 approved budget and <strong>the</strong> FY 2013proposed budget.Table AB0-5(dollars in thousands)PROGRAM BUDGET FTELOCAL FUNDS: FY 2012 Approved <strong>Budget</strong> and FTE 19,026 189.0Fringe Benefit Rate Adjustment Multiple Programs 197 0.0Consumer Price Index Multiple Programs 40 0.0Fixed Cost Inflation Factor Multiple Programs 2 0.0Personal Services Growth Factor Multiple Programs 70 0.0FY 2013 Current Services Funding Level <strong>Budget</strong> (CSFL) 19,335 189.0Create: Establishment <strong>of</strong> a new Council Committee Committee 409 5.0Cost Increase: IT Replacement fund (One-time) Council Central <strong>Office</strong>s 403 0.0Cost Increase: Higher estimated Fringe Benefits costs Council Administration 336 0.0Cost Increase: Emancipation Day Celebration Council Administration 250 0.0Cost Increase: Staff within <strong>the</strong> General Counsel Multiple Programs 160 1.5Cost Increase: Supports changes in staff salaries Multiple Programs 45 0.0and operational needsFY 2013 Initial Adjusted <strong>Budget</strong> 20,938 195.5Technical Adjustment: Health insurance contribution Multiple Programs 69 0.0FY 2013 Additionally Adjusted <strong>Budget</strong> 21,007 195.5LOCAL FUNDS: FY 2013 Proposed <strong>Budget</strong> and FTE 21,007 195.5INTRADISTRICT FUNDS: FY 2012 Approved <strong>Budget</strong> and FTE 0 0.0Cost Increase: Purchase <strong>of</strong> D.C. Code volumes Council Administration 89 0.0INTRADISTRICT FUNDS: FY 2013 Proposed <strong>Budget</strong> and FTE 89 0.0Gross for AB0 - Council <strong>of</strong> <strong>the</strong> District <strong>of</strong> Columbia 21,096 195.5(Change is calculated by whole numbers and numbers may not add up due to rounding)Council <strong>of</strong> <strong>the</strong> District <strong>of</strong> ColumbiaA-8FY 2013 Proposed <strong>Budget</strong> and <strong>Financial</strong> Plan
<strong>Office</strong> <strong>of</strong> <strong>the</strong> District <strong>of</strong> ColumbiaAuditorwww.dcauditor.orgTelephone: 202-727-3600(AC0)% ChangeFY 2011 FY 2012 FY 2013 fromDescription Actual Approved Proposed FY 2012Operating <strong>Budget</strong> $3,613,754 $4,261,233 $4,275,981 0.3FTEs 30.9 32.0 34.0 6.2The mission <strong>of</strong> <strong>the</strong> <strong>Office</strong> <strong>of</strong> <strong>the</strong> District <strong>of</strong> Columbia Auditor(ODCA) is to conduct thorough audits <strong>of</strong> <strong>the</strong> accounts and operations<strong>of</strong> <strong>the</strong> District government with <strong>the</strong> goal <strong>of</strong> promoting economy,efficiency, and accountability.Summary <strong>of</strong> ServicesThe ODCA assists <strong>the</strong> Council <strong>of</strong> <strong>the</strong> District <strong>of</strong> Columbia in performing its oversight responsibilities; annuallyauditing <strong>the</strong> accounts, operations, and programs <strong>of</strong> <strong>the</strong> District <strong>of</strong> Columbia Government; and certifying revenueestimates in support <strong>of</strong> municipal bond issuances. In addition, <strong>the</strong> ODCA provides oversight and conductsaudits <strong>of</strong> <strong>the</strong> financial activities <strong>of</strong> <strong>the</strong> District’s 37 Advisory Neighborhood Commissions. The ODCA also performsaudits <strong>of</strong> specific programs, funds, and organizational entities at intervals as required by law.The agency’s FY 2013 proposed budget is presented in <strong>the</strong> following tables:FY 2013 Proposed <strong>Budget</strong> and <strong>Financial</strong> Plan<strong>Office</strong> <strong>of</strong> <strong>the</strong> District <strong>of</strong> Columbia AuditorA-9
FY 2013 Proposed Gross Funds Operating <strong>Budget</strong>, by Revenue TypeTable AC0-1 contains <strong>the</strong> proposed FY 2013 agency budget compared to <strong>the</strong> FY 2012 approved budget. It alsoprovides FY 2010 and FY 2011 actual expenditures.Table AC0-1(dollars in thousands)ChangeActual Actual Approved Proposed from PercentAppropriated Fund FY 2010 FY 2011 FY 2012 FY 2013 FY 2012 Change*General FundLocal Funds 3,858 3,436 3,686 3,951 265 7.2Total for General Fund 3,858 3,436 3,686 3,951 265 7.2Intra-District FundsIntra-District Funds 293 178 575 325 -250 -43.5Total for Intra-District Funds 293 178 575 325 -250 -43.5Gross Funds 4,151 3,614 4,261 4,276 15 0.3*Percent change is based on whole dollars.Note: If applicable, for a breakdown <strong>of</strong> each Grant (Federal and Private), Special Purpose Revenue type and Intra-District agreement,please refer to Schedule 80 <strong>Agency</strong> Summary by Revenue Source in <strong>the</strong> FY 2013 Operating Appendices located on <strong>the</strong> <strong>Office</strong> <strong>of</strong> <strong>the</strong><strong>Chief</strong> <strong>Financial</strong> <strong>Office</strong>r’s website.FY 2013 Proposed Full-Time Equivalents, by Revenue TypeTable AC0-2 contains <strong>the</strong> proposed FY 2013 FTE level compared to <strong>the</strong> FY 2012 approved FTE level by revenuetype. It also provides FY 2010 and FY 2011 actual data.Table AC0-2ChangeActual Actual Approved Proposed from PercentAppropriated Fund FY 2010 FY 2011 FY 2012 FY 2013 FY 2012 ChangeGeneral FundLocal Funds 31.5 30.9 32.0 34.0 2.0 6.2Total for General Fund 31.5 30.9 32.0 34.0 2.0 6.2Total Proposed FTEs 31.5 30.9 32.0 34.0 2.0 6.2<strong>Office</strong> <strong>of</strong> <strong>the</strong> District <strong>of</strong> Columbia AuditorA-10FY 2013 Proposed <strong>Budget</strong> and <strong>Financial</strong> Plan
FY 2013 Proposed Operating <strong>Budget</strong>, by Comptroller Source GroupTable AC0-3 contains <strong>the</strong> proposed FY 2013 budget at <strong>the</strong> Comptroller Source Group (object class) level comparedto <strong>the</strong> FY 2012 approved budget. It also provides FY 2010 and FY 2011 actual expenditures.Table AC0-3(dollars in thousands)ChangeActual Actual Approved Proposed from PercentComptroller Source Group FY 2010 FY 2011 FY 2012 FY 2013 FY 2012 Change*11 - Regular Pay - Continuing Full Time 2,515 2,342 2,396 2,604 208 8.712 - Regular Pay - O<strong>the</strong>r 169 118 168 75 -93 -55.413 - Additional Gross Pay 27 32 0 0 0 N/A14 - Fringe Benefits - Current Personnel 473 448 540 623 83 15.415 - Overtime Pay 1 0 0 0 0 N/ASubtotal Personal Services (PS) 3,184 2,939 3,104 3,303 198 6.420 - Supplies and Materials 11 16 9 9 0 0.031 - Telephone, Telegraph, Telegram, Etc. 4 15 15 17 2 11.532 - Rentals - Land and Structures 360 307 496 569 74 14.934 - Security Services 0 32 0 0 0 N/A35 - Occupancy Fixed Costs 2 0 0 0 0 N/A40 - O<strong>the</strong>r Services and Charges 116 60 32 32 1 2.141 - Contractual Services - O<strong>the</strong>r 371 214 592 332 -260 -43.970 - Equipment and Equipment Rental 101 31 14 14 0 0.0Subtotal Nonpersonal Services (NPS) 966 675 1,157 973 -184 -15.9Gross Funds 4,151 3,614 4,261 4,276 15 0.3*Percent change is based on whole dollars.Program DescriptionThe <strong>Office</strong> <strong>of</strong> District <strong>of</strong> Columbia Auditor operates through <strong>the</strong> following 2 programs:Audit, <strong>Financial</strong> Oversight and Investigations – provides assistance to <strong>the</strong> Council <strong>of</strong> <strong>the</strong> District <strong>of</strong> Columbia inperforming its oversight responsibilities; annually audits <strong>the</strong> accounts, operations, and programs <strong>of</strong> <strong>the</strong> District <strong>of</strong>Columbia government, pursuant to Section 455 <strong>of</strong> Public Law 93-198; and certifies revenue estimates in support<strong>of</strong> municipal bond issuances, pursuant to Section 603 <strong>of</strong> Public Law 93-198. Through this program, <strong>the</strong> agencyis required by <strong>the</strong> Advisory Neighborhood Commissions Act <strong>of</strong> 1975, as amended, to provide financial oversightand management to <strong>the</strong> District government's 37 Advisory Neighborhood Commissions (ANCs) and to manageand administer <strong>the</strong> ANC Security Fund. The <strong>Office</strong> <strong>of</strong> <strong>the</strong> District <strong>of</strong> Columbia Auditor is also required (by variouslaws) to conduct 17 additional audits.FY 2013 Proposed <strong>Budget</strong> and <strong>Financial</strong> Plan<strong>Office</strong> <strong>of</strong> <strong>the</strong> District <strong>of</strong> Columbia AuditorA-11
This program contains <strong>the</strong> following 2 activities:■ Performance Compliance and <strong>Financial</strong> Audits – conducts audits <strong>of</strong> <strong>the</strong> accounts, operations, and programs<strong>of</strong> <strong>the</strong> District <strong>of</strong> Columbia on a rotating basis and certifies revenue estimates in support <strong>of</strong> municipal bondissuances; and■ Advisory Neighborhood Commissions <strong>Financial</strong> Oversight and Management – provides financial oversightand conducts audits <strong>of</strong> <strong>the</strong> financial activities <strong>of</strong> <strong>the</strong> District government's 37 ANCs.<strong>Agency</strong> Management – provides for administrative support and <strong>the</strong> required tools to achieve operational and programmaticresults. This program is standard for all agencies using performance-based budgeting.Program Structure ChangeThe <strong>Office</strong> <strong>of</strong> District <strong>of</strong> Columbia Auditor has no program structure changes in <strong>the</strong> FY 2013 proposed budget.FY 2013 Proposed Operating <strong>Budget</strong> and FTEs, by Program and ActivityTable AC0-4 contains <strong>the</strong> proposed FY 2013 budget by program and activity compared to <strong>the</strong> FY 2012 approved budget. Italso provides <strong>the</strong> FY 2011 actual data.Table AC0-4(dollars in thousands)Dollars in ThousandsFull-Time EquivalentsActual Approved ProposedChangefrom Actual Approved ProposedChangefromProgram/Activity FY 2011 FY 2012 FY 2013 FY 2012 FY 2011 FY 2012 FY 2013 FY 2012(1000) <strong>Agency</strong> Management Program(1040) Information Technology 233 235 244 9 1.8 2.0 2.0 0.0(1050) <strong>Financial</strong> Management 354 511 587 76 0.0 0.0 0.0 0.0Subtotal (1000) <strong>Agency</strong> Management Program 587 746 831 85 1.8 2.0 2.0 0.0(2000) Audit, <strong>Financial</strong> Oversight and Investigations(2010) Performance Compliance and <strong>Financial</strong> Audit 2,875 3,350 3,289 -61 27.4 28.0 30.0 2.0(2020) ANC Audit and <strong>Financial</strong> Oversight 152 165 156 -9 1.8 2.0 2.0 0.0Subtotal (2000) Audit, Fin. Oversight and Investigations 3,027 3,515 3,445 -70 29.1 30.0 32.0 2.0Total Proposed Operating <strong>Budget</strong> 3,614 4,261 4,276 15 30.9 32.0 34.0 2.0(Change is calculated by whole numbers and numbers may not add up due to rounding)Note: For more detailed information regarding <strong>the</strong> proposed funding for <strong>the</strong> activities within this agency’s programs, please see Schedule 30-PBBProgram Summary By Activity in <strong>the</strong> FY 2013 Operating Appendices located on <strong>the</strong> <strong>Office</strong> <strong>of</strong> <strong>the</strong> <strong>Chief</strong> <strong>Financial</strong> <strong>Office</strong>r’s website.<strong>Office</strong> <strong>of</strong> <strong>the</strong> District <strong>of</strong> Columbia AuditorA-12FY 2013 Proposed <strong>Budget</strong> and <strong>Financial</strong> Plan
FY 2013 Proposed <strong>Budget</strong> ChangesThe <strong>Office</strong> <strong>of</strong> <strong>the</strong> District <strong>of</strong> Columbia Auditor’s (ODCA) proposed FY 2013 gross budget is $4,275,981, whichrepresents a 0.3 percent decrease from its FY 2012 approved gross budget <strong>of</strong> $4,261,233. The budget is comprised<strong>of</strong> $3,950,981 in Local funds and $325,000 in Intra-District funds.Current Services Funding LevelThe Current Services Funding Level (CSFL) is a Local funds ONLY representation <strong>of</strong> <strong>the</strong> true cost <strong>of</strong> operatingDistrict agencies, before consideration <strong>of</strong> policy decisions. The CSFL reflects changes from <strong>the</strong> FY 2012 approvedbudget across multiple programs, and it estimates how much it would cost an agency to continue its current programsand operations into <strong>the</strong> following fiscal year. The initial adjustments in <strong>the</strong> budget proposal represent changesthat should be compared to <strong>the</strong> FY 2013 CSFL budget and not necessarily changes made to <strong>the</strong> FY 2012 Localfunds budget. The FY 2013 CSFL adjustments to <strong>the</strong> FY 2012 Local funds budget are described in table 5 <strong>of</strong> thisagency's budget chapter. Please see <strong>the</strong> CSFL Development section within Volume 1: Executive Summary for moreinformation regarding <strong>the</strong> methodology used and components that comprise <strong>the</strong> CSFL.ODCA's FY 2013 CSFL budget is $3,738,272, which represents a $52,039, or 1.4 percent, increase over <strong>the</strong>FY 2012 approved Local funds budget <strong>of</strong> $3,686,233.Initial Adjusted <strong>Budget</strong>Cost Increase: $64,932 in Local funds to support Rental - Land and Structure estimates from <strong>the</strong> Department <strong>of</strong>General Services.Cost Decrease: $64,933 in Local funds reflects changes in Regular Pay - O<strong>the</strong>r and Regular Pay - Continuing fulltime salaries for certain agency position adjustments, and $250,000 in Intra-District funds reflects <strong>the</strong> discontinuation<strong>of</strong> an audit engagement for an independent evaluation <strong>of</strong> <strong>the</strong> District <strong>of</strong> Columbia Public Schools (DCPS).Additional Adjusted <strong>Budget</strong>Technical Adjustment: Adjustment <strong>of</strong> Fringe Benefits to restore <strong>the</strong> District Government contribution for employeehealth insurance from 72 percent, implemented in <strong>the</strong> FY 2011 budget, to 75 percent in FY 2013, resulting inan increase <strong>of</strong> $12,709 in Local funds.Policy InitiativeCost Increase: $200,000 in Local funds to support an additional 2.0 FTEs to perform audit services.FY 2013 Proposed <strong>Budget</strong> and <strong>Financial</strong> Plan<strong>Office</strong> <strong>of</strong> <strong>the</strong> District <strong>of</strong> Columbia AuditorA-13
FY 2012 Approved <strong>Budget</strong> to FY 2013 Proposed <strong>Budget</strong>, by Revenue TypeTable AC0-5 itemizes <strong>the</strong> changes by revenue type between <strong>the</strong> FY 2012 approved budget and <strong>the</strong> FY 2013 proposedbudget.Table AC0-5(dollars in thousands)PROGRAM BUDGET FTELOCAL FUNDS: FY 2012 Approved <strong>Budget</strong> and FTE 3,686 32.0Fringe Benefit Rate Adjustment Multiple Programs 38 0.0Consumer Price Index Multiple Programs 1 0.0Personal Services Growth Factor Multiple Programs 13 0.0FY 2013 Current Services Funding Level <strong>Budget</strong> (CSFL) 3,738 32.0Cost Increase: In nonpersonal services due to increase Multiple Programs 65 0.0in Rental estimatesCost Decrease: In personal services to absorb <strong>the</strong> Multiple Programs -65 0.0increase in nonpersonal services - Rentals estimatesFY 2013 Initial Adjusted <strong>Budget</strong> 3,738 32.0Technical Adjustment: Health insurance contribution Multiple Programs 13 0.0FY 2013 Additionally Adjusted <strong>Budget</strong> 3,751 32.0FY 2013 Policy InitiativeCost Increase: For additional staffing needed to perform audit services Audit, <strong>Financial</strong> Oversight 200 2.0and InvestigationsLOCAL FUNDS: FY 2013 Proposed <strong>Budget</strong> and FTE 3,951 34.0INTRA-DISTRICT FUNDS: FY 2012 Approved <strong>Budget</strong> and FTE 575 0.0Cost Decrease: In Intra-District arrangement for Audit, <strong>Financial</strong> Oversight -250 0.0independent evaluation <strong>of</strong> DCPSand InvestigationsFY 2013 Initial Adjusted <strong>Budget</strong> 325 0.0INTRA-DISTRICT FUNDS: FY 2013 Proposed <strong>Budget</strong> and FTE 325 0.0Gross for AC0 - <strong>Office</strong> <strong>of</strong> <strong>the</strong> District <strong>of</strong> Columbia Auditor 4,276 34.0(Change is calculated by whole numbers and numbers may not add up due to rounding)<strong>Office</strong> <strong>of</strong> <strong>the</strong> District <strong>of</strong> Columbia AuditorA-14FY 2013 Proposed <strong>Budget</strong> and <strong>Financial</strong> Plan
<strong>Agency</strong> Performance PlansThe agency’s performance plan has <strong>the</strong> following objectives for FY 2013:Objective 1: Conduct thorough audits <strong>of</strong> <strong>the</strong> accounts and operations <strong>of</strong> <strong>the</strong> District Government.Performance MeasuresFY 2010 FY 2011 FY 2011 FY 2012 FY 2013 FY 2014Measure Actual Target Actual Projection Projection ProjectionDollar value <strong>of</strong> potential savings or increased revenues,and/or unsupported costs identified from audits 1 $23 Million $13 Million $33.5 Million $14 Million $15 Million $15 MillionPercentage <strong>of</strong> financial, performance and mandatoryand compliance audits completed within requiredtime frame 100% 100% 100% 100% 100% 100%Number <strong>of</strong> financial, performance, andrecommendation compliance audit reports issued 2 16 30 25 45 45 45Number <strong>of</strong> Advisory Neighborhood Commissions thatreceive financial oversight and ministerial duties from<strong>the</strong> <strong>Office</strong> <strong>of</strong> <strong>the</strong> D.C. Auditor each quarter 37 37 37 37 37 37Performance Plan Endnotes:1. Dollar value <strong>of</strong> potential savings or increased revenues, and questioned or unsupported costs identified from audits, are quantified in publishedaudit reports.2. This includes 24 performance audits, 9 financial reviews, 7 reports on compliance with Certified Business Enterprise Goals, 3 reports on <strong>the</strong>implementation <strong>of</strong> recommendations presented in previous audit reports, and 2 reports on <strong>the</strong> financial activities <strong>of</strong> Advisory NeighborhoodCommissions.FY 2013 Proposed <strong>Budget</strong> and <strong>Financial</strong> Plan<strong>Office</strong> <strong>of</strong> <strong>the</strong> District <strong>of</strong> Columbia AuditorA-15
Advisory Neighborhood Commissionswww.anc.dc.govTelephone: 202-727-9945(DX0)% ChangeFY 2011 FY 2012 FY 2013 fromDescription Actual Approved Proposed FY 2012Operating <strong>Budget</strong> $833,010 $889,414 $893,680 0.5FTEs 2.4 2.5 2.5 0.0The mission <strong>of</strong> <strong>the</strong> Advisory Neighborhood Commissions (ANC) isto advise <strong>the</strong> District government on matters <strong>of</strong> public policy, includingdecisions regarding planning, streets, recreation, social service programs,health, safety, and sanitation in respective neighborhood areas.This mission, supported by <strong>the</strong> <strong>Office</strong> <strong>of</strong> ANC, <strong>the</strong> <strong>Agency</strong>Management program, includes reviewing and making recommendationson zoning changes, variances, public improvements, licenses, andpermits <strong>of</strong> significance for neighborhood planning and development.The agency’s FY 2013 proposed budget is presented in <strong>the</strong> following tables:FY 2013 Proposed <strong>Budget</strong> and <strong>Financial</strong> PlanAdvisory Neighborhood CommissionsA-17
FY 2013 Proposed Gross Funds Operating <strong>Budget</strong>, by Revenue TypeTable DX0-1 contains <strong>the</strong> proposed FY 2013 agency budget compared to <strong>the</strong> FY 2012 approved budget. It alsoprovides FY 2010 and FY 2011 actual expenditures.Table DX0-1(dollars in thousands)ChangeActual Actual Approved Proposed from PercentAppropriated Fund FY 2010 FY 2011 FY 2012 FY 2013 FY 2012 Change*General FundLocal Funds 920 833 889 894 4 0.5Total for General Fund 920 833 889 894 4 0.5Gross Funds 920 833 889 894 4 0.5*Percent change is based on whole dollars.Note: If applicable, for a breakdown <strong>of</strong> each Grant (Federal and Private), Special Purpose Revenue type and Intra-District agreement,please refer to Schedule 80 <strong>Agency</strong> Summary by Revenue Source in <strong>the</strong> FY 2013 Operating Appendices located on <strong>the</strong> <strong>Office</strong> <strong>of</strong> <strong>the</strong><strong>Chief</strong> <strong>Financial</strong> <strong>Office</strong>r’s website.FY 2013 Proposed Full-time Equivalents, by Revenue TypeTable DX0-2 contains <strong>the</strong> proposed FY 2013 FTE level compared to <strong>the</strong> FY 2012 approved FTE level by revenuetype. It also provides FY 2010 and FY 2011 actual data.Table DX0-2ChangeActual Actual Approved Proposed from PercentAppropriated Fund FY 2010 FY 2011 FY 2012 FY 2013 FY 2012 ChangeGeneral FundLocal Funds 2.0 2.4 2.5 2.5 0.0 0.0Total for General Fund 2.0 2.4 2.5 2.5 0.0 0.0Total Proposed FTEs 2.0 2.4 2.5 2.5 0.0 0.0Advisory Neighborhood CommissionsA-18FY 2013 Proposed <strong>Budget</strong> and <strong>Financial</strong> Plan
FY 2013 Proposed Operating <strong>Budget</strong>, by Comptroller Source GroupTable DX0-3 contains <strong>the</strong> proposed FY 2013 budget at <strong>the</strong> Comptroller Source Group (object class) level comparedto <strong>the</strong> FY 2012 approved budget. It also provides FY 2010 and FY 2011 actual expenditures.Table DX0-3(dollars in thousands)ChangeActual Actual Approved Proposed from PercentComptroller Source Group FY 2010 FY 2011 FY 2012 FY 2013 FY 2012 Change*11 - Regular Pay - Continuing Full Time 78 148 145 148 3 2.112 - Regular Pay - O<strong>the</strong>r 50 14 27 27 -1 -3.013 - Additional Gross Pay 1 0 0 0 0 N/A14 - Fringe Benefits - Current Personnel 29 25 35 39 4 10.2Subtotal Personal Services (PS) 159 188 208 214 6 2.820 - Supplies and Materials 2 1 3 2 0 -9.440 - O<strong>the</strong>r Services and Charges 2 0 1 0 -1 -100.050 - Subsidies and Transfers 757 645 678 678 0 0.0Subtotal Nonpersonal Services (NPS) 761 645 682 680 -2 -0.2Gross Funds 920 833 889 894 4 0.5*Percent change is based on whole dollars.Program DescriptionThe Advisory Neighborhood Commissions operates through <strong>the</strong> following 2 programs:Advisory Neighborhood Commissions – consists <strong>of</strong> 37 independent commissions that provide advice and recommendationsto <strong>the</strong> Council, <strong>the</strong> Mayor, and various agencies, boards, and commissions <strong>of</strong> government so thateach neighborhood’s needs and concerns receive full consideration in <strong>the</strong> formulation and implementation <strong>of</strong> governmentaldecision-making and in <strong>the</strong> delivery <strong>of</strong> public services.<strong>Agency</strong> Management – provides for administrative support and <strong>the</strong> required tools to achieve operational and programmaticresults. This program is standard for all agencies using performance-based budgeting.Program Structure ChangesThe Advisory Neighborhood Commissions has no program structure changes in <strong>the</strong> FY 2013 proposed budget.FY 2013 Proposed <strong>Budget</strong> and <strong>Financial</strong> PlanAdvisory Neighborhood CommissionsA-19
FY 2013 Proposed Operating <strong>Budget</strong> and FTEs, by Program and ActivityTable DX0-4 contains <strong>the</strong> proposed FY 2013 budget by program and activity compared to <strong>the</strong> FY 2012 approved budget.It also provides <strong>the</strong> FY 2011 actual data.Table DX0-4(dollars in thousands)Dollars in ThousandsFull-Time EquivalentsChangeChangeActual Approved Proposed from Actual Approved Proposed fromProgram/Activity FY 2011 FY 2012 FY 2013 FY 2012 FY 2011 FY 2012 FY 2013 FY 2012(1000) <strong>Agency</strong> Management Program(1085) Customer Services 188 212 216 4 2.4 2.5 2.5 0.0Subtotal (1000) <strong>Agency</strong> Management Program 188 212 216 4 2.4 2.5 2.5 0.0(2000) Advisory Neighborhood Commissions(0200) Advisory Neighborhood Commissions 645 678 678 0 0.0 0.0 0.0 0.0Subtotal (2000) Advisory Neighborhood Commissions 645 678 678 0 0.0 0.0 0.0 0.0Total Proposed Operating <strong>Budget</strong> 833 889 894 4 2.4 2.5 2.5 0.0(Change is calculated by whole numbers and numbers may not add up due to rounding)Note: For more detailed information regarding <strong>the</strong> proposed funding for <strong>the</strong> activities within this agency’s programs, please see Schedule 30-PBB Program Summary by Activity in <strong>the</strong> FY 2013 Operating Appendices located on <strong>the</strong> <strong>Office</strong> <strong>of</strong> <strong>the</strong> <strong>Chief</strong> <strong>Financial</strong> <strong>Office</strong>r’s website.FY 2013 Proposed <strong>Budget</strong> ChangesThe Advisory Neighborhood Commissions’ (ANC) proposed FY 2013 gross budget is $893,680, which representsa 0.5 percent increase over its FY 2012 approved gross budget <strong>of</strong> $889,414. The budget is comprised entirely <strong>of</strong>Local funds.Current Services Funding LevelThe Current Services Funding Level (CSFL) is a Local funds ONLY representation <strong>of</strong> <strong>the</strong> true cost <strong>of</strong> operatingDistrict agencies, before consideration <strong>of</strong> policy decisions. The CSFL reflects changes from <strong>the</strong> FY 2012 approvedbudget across multiple programs, and it estimates how much it would cost an agency to continue its current programsand operations into <strong>the</strong> following fiscal year. The initial adjustments in <strong>the</strong> budget proposal representchanges that should be compared to <strong>the</strong> FY 2013 CSFL budget and not necessarily changes made to <strong>the</strong> FY 2012Local funds budget. The FY 2013 CSFL adjustments to <strong>the</strong> FY 2012 Local funds budget are described in table 5<strong>of</strong> this agency's budget chapter. Please see <strong>the</strong> CSFL Development section within Volume 1: Executive Summaryfor more information regarding <strong>the</strong> methodology used and components that comprise <strong>the</strong> CSFL.ANC's FY 2013 CSFL budget is $892,837, which represents a $3,423, or 0.4 percent, increase over <strong>the</strong> FY2012 approved Local funds budget <strong>of</strong> $889,414.Advisory Neighborhood CommissionsA-20FY 2013 Proposed <strong>Budget</strong> and <strong>Financial</strong> Plan
Initial Adjusted <strong>Budget</strong>Cost Increase: $1,698 in Local funds to support salary step increases in FY 2013.Cost Decrease: $1,698 in Local funds from O<strong>the</strong>r Services and Charges and Supplies to <strong>of</strong>fset projected salary stepincreases in personal services.Additionally Adjusted <strong>Budget</strong>Technical Adjustment: Adjustment <strong>of</strong> Fringe Benefits to restore <strong>the</strong> District Government contribution for employeehealth insurance from 72 percent, implemented in <strong>the</strong> FY 2011 budget, to 75 percent in FY 2013, resulting inan increase <strong>of</strong> $843 in Local funds.FY 2012 Approved <strong>Budget</strong> to FY 2013 Proposed <strong>Budget</strong>, by Revenue TypeTable DX0-5 itemizes <strong>the</strong> changes by revenue type between <strong>the</strong> FY 2012 approved budget and <strong>the</strong> FY 2013 proposedbudget.Table DX0-5(dollars in thousands)PROGRAM BUDGET FTELOCAL FUNDS: FY 2012 Approved <strong>Budget</strong> and FTE 889 2.5Fringe Benefit Rate Adjustment Multiple Programs 2 0.0Consumer Price Index (less than $500) Multiple Programs 0 0.0Personal Services Growth Factor Multiple Programs 1 0.0FY 2013 Current Services Funding Level <strong>Budget</strong> (CSFL) 893 2.5Cost Increase: In personal services to fund projected Multiple Programs 2 0.0salary step increasesCost Decrease: In nonpersonal services to <strong>of</strong>fset projected Multiple Programs -2 0.0cost <strong>of</strong> salary step increasesFY 2013 Initial Adjusted <strong>Budget</strong> 893 2.5Technical Adjustment: Health insurance contribution Multiple Programs 1 0.0FY 2013 Additionally Adjusted <strong>Budget</strong> 894 2.5LOCAL FUNDS: FY 2013 Proposed <strong>Budget</strong> and FTE 894 2.5Gross for DX0 - Advisory Neighborhood Commissions 894 2.5(Change is calculated by whole numbers and numbers may not add up due to rounding)FY 2013 Proposed <strong>Budget</strong> and <strong>Financial</strong> PlanAdvisory Neighborhood CommissionsA-21
<strong>Office</strong> <strong>of</strong> <strong>the</strong> Mayor(AA0)www.dc.govTelephone: 202-727-1000% ChangeFY 2011 FY 2012 FY 2013 fromDescription Actual Approved Proposed FY 2012Operating <strong>Budget</strong> $46,061,256 $12,788,389 $12,352,118 -3.4FTEs 85.8 87.5 87.5 0.0Note: FY 2011 Actual figure includes a transfer <strong>of</strong> $34,080,000 to <strong>the</strong> General Fund that is not part <strong>of</strong> <strong>the</strong> operations <strong>of</strong> <strong>the</strong> <strong>Office</strong> <strong>of</strong> <strong>the</strong> Mayor.The mission <strong>of</strong> <strong>the</strong> <strong>Office</strong> <strong>of</strong> <strong>the</strong> Mayor is to serve <strong>the</strong> public by leading<strong>the</strong> District government and ensuring residents are served wi<strong>the</strong>fficiency, accountability, and transparency.Summary <strong>of</strong> ServicesThe Executive <strong>Office</strong> <strong>of</strong> <strong>the</strong> Mayor (EOM) provides District agencies with vision and policy direction, and providesagencies with <strong>the</strong> leadership, support, and oversight to implement specific policy goals and objectives. To discharge<strong>the</strong>se duties, <strong>the</strong> EOM is divided into five core <strong>of</strong>fices: <strong>the</strong> <strong>Office</strong> <strong>of</strong> Boards and Commissions, <strong>the</strong> <strong>Office</strong><strong>of</strong> Communications, <strong>the</strong> <strong>Office</strong> <strong>of</strong> Policy and Legislative Affairs, <strong>the</strong> <strong>Office</strong> <strong>of</strong> <strong>Budget</strong> and Finance, and <strong>the</strong> <strong>Office</strong><strong>of</strong> Community Affairs.The agency’s FY 2013 proposed budget is presented in <strong>the</strong> following tables:FY 2013 Proposed <strong>Budget</strong> and <strong>Financial</strong> Plan<strong>Office</strong> <strong>of</strong> <strong>the</strong> MayorA-23
FY 2013 Proposed Gross Funds Operating <strong>Budget</strong>, by Revenue TypeTable AA0-1 contains <strong>the</strong> proposed FY 2013 agency budget compared to <strong>the</strong> FY 2012 approved budget. It alsoprovides FY 2010 and FY 2011 actual expenditures.Table AA0-1(dollars in thousands)ChangeActual Actual Approved Proposed from PercentAppropriated Funds FY 2010 FY 2011 FY 2012 FY 2013 FY 2012 Change*General FundLocal Funds 4,333 42,090 8,259 8,435 176 2.1Total for General Fund 4,333 42,090 8,259 8,435 176 2.1Federal ResourcesFederal Grant Funds 0 3,487 4,093 3,556 -537 -13.1Total for Federal Resources 0 3,487 4,093 3,556 -537 -13.1Private FundsPrivate Donations 0 10 0 0 0 N/ATotal for Private Funds 0 10 0 0 0 N/AIntra-District FundsIntra-District Funds 5 474 436 360 -76 -17.4Total for Intra-District Funds 5 474 436 360 -76 -17.4Gross Funds 4,338 46,061 12,788 12,352 -436 -3.4*Percent change is based on whole dollars.Note: If applicable, for a breakdown <strong>of</strong> each Grant (Federal and Private), Special Purpose Revenue type and Intra-District agreement,please refer to Schedule 80 <strong>Agency</strong> Summary by Revenue Source in <strong>the</strong> FY 2013 Operating Appendices located on <strong>the</strong> <strong>Office</strong> <strong>of</strong> <strong>the</strong><strong>Chief</strong> <strong>Financial</strong> <strong>Office</strong>r’s website.<strong>Office</strong> <strong>of</strong> <strong>the</strong> MayorA-24FY 2013 Proposed <strong>Budget</strong> and <strong>Financial</strong> Plan
FY 2013 Proposed Full-Time Equivalents, by Revenue TypeTable AA0-2 contains <strong>the</strong> proposed FY 2013 FTE level compared to <strong>the</strong> FY 2012 approved FTE level by revenuetype. It also provides FY 2010 and FY 2011 actual data.Table AA0-2ChangeActual Actual Approved Proposed from PercentAppropriated Funds FY 2010 FY 2011 FY 2012 FY 2013 FY 2012 ChangeGeneral FundLocal Funds 49.9 77.4 77.9 78.3 0.4 0.5Total for General Fund 49.9 77.4 77.9 78.3 0.4 0.5Federal ResourcesFederal Grant Funds 0.0 4.1 4.1 4.8 0.7 17.1Total for Federal Resources 0.0 4.1 4.1 4.8 0.7 17.1Intra-District FundsIntra-District Funds 0.0 4.2 5.5 4.4 -1.0 -19.2Total for Intra-District Funds 0.0 4.2 5.5 4.4 -1.0 -19.2Total Proposed FTEs 49.9 85.8 87.5 87.5 0.0 0.0FY 2013 Proposed Operating <strong>Budget</strong>, by Comptroller Source GroupTable AA0-3 contains <strong>the</strong> proposed FY 2013 budget at <strong>the</strong> Comptroller Source Group (object class) level comparedto <strong>the</strong> FY 2012 approved budget. It also provides FY 2010 and FY 2011 actual expenditures.Table AA0-3(dollars in thousands)ChangeActual Actual Approved Proposed from PercentComptroller Source Group FY 2010 FY 2011 FY 2012 FY 2013 FY 2012 Change*11 - Regular Pay - Continuing Full Time 2,834 5,132 6,312 6,322 10 0.212 - Regular Pay - O<strong>the</strong>r 254 975 584 773 189 32.313 - Additional Gross Pay 19 652 0 0 0 N/A14 - Fringe Benefits - Current Personnel 522 1,138 1,570 1,756 186 11.815 - Overtime Pay 0 1 0 0 0 N/ASubtotal Personal Services (PS) 3,629 7,898 8,467 8,851 384 4.520 - Supplies and Materials 27 110 100 64 -36 -35.730 - Energy, Comm. and Building Rentals 38 241 0 0 0 N/A31 - Telephone, Telegraph, Telegram, Etc. 261 9 0 0 0 N/A40 - O<strong>the</strong>r Services and Charges 366 515 788 494 -294 -37.341 - Contractual Services - O<strong>the</strong>r 0 3 0 0 0 N/A50 - Subsidies and Transfers 0 37,244 3,399 2,933 -467 -13.770 - Equipment and Equipment Rental 16 42 34 10 -24 -70.8Subtotal Nonpersonal Services (NPS) 709 38,164 4,322 3,502 -820 -19.0Gross Funds 4,338 46,061 12,788 12,352 -436 -3.4*Percent change is based on whole dollars.FY 2013 Proposed <strong>Budget</strong> and <strong>Financial</strong> Plan<strong>Office</strong> <strong>of</strong> <strong>the</strong> MayorA-25
Program DescriptionThe <strong>Office</strong> <strong>of</strong> <strong>the</strong> Mayor operates through <strong>the</strong> following 7 programs:Executive <strong>Office</strong> <strong>of</strong> <strong>the</strong> Mayor – provides staff support to <strong>the</strong> Mayor in leading <strong>the</strong> government and community.This program contains <strong>the</strong> following 6 activities:■ <strong>Office</strong> <strong>of</strong> <strong>the</strong> Mayor – provides leadership, strategic direction, and policy guidance to EOM, Deputy Mayors,and agencies;■ Scheduling and Advance Unit – processes scheduling requests and correspondence for <strong>the</strong> Mayor and providesoversight <strong>of</strong> <strong>the</strong> Mayor’s public engagements;■ <strong>Office</strong> <strong>of</strong> Communications – provides strategic communication directions, media relations, public informationdissemination, agency communications review and coordination, government–wide communication standards,and guidance to and training opportunities for agency public information <strong>of</strong>ficers;■ Mayor’s Correspondence Unit – responds to written correspondence sent to <strong>the</strong> Mayor in a timely, thoughtful,and helpful manner;■ <strong>Office</strong> <strong>of</strong> <strong>the</strong> General Counsel – advises <strong>the</strong> Mayor, and o<strong>the</strong>r activities <strong>of</strong> <strong>the</strong> EOM without legal counsel, onlegal matters; and■ <strong>Office</strong> <strong>of</strong> Support Services – provides operational support to <strong>the</strong> EOM, Deputy Mayors, <strong>the</strong> <strong>Office</strong> <strong>of</strong> <strong>the</strong> CityAdministrator, Criminal Justice Coordinating Council, <strong>Office</strong> on Latino Affairs, <strong>Office</strong> <strong>of</strong> Veterans Affairs,<strong>Office</strong> <strong>of</strong> Asian and Pacific Islander Affairs, <strong>Office</strong> <strong>of</strong> <strong>the</strong> Secretary, and <strong>Office</strong> <strong>of</strong> Risk Management.<strong>Office</strong> <strong>of</strong> Policy and Legislative Affairs – coordinates <strong>the</strong> policy decision-making process by <strong>of</strong>fering policy analysisand advice to inform <strong>the</strong> implementation <strong>of</strong> <strong>the</strong> Mayor’s legislative and policy agenda. Responsibilities includeCouncil relations, policy development, federal relations, and legislative support.<strong>Office</strong> <strong>of</strong> Boards and Commissions – provides assistance to <strong>the</strong> Mayor in appointing citizens to boards and commissionsby recruiting quality candidates, ensuring timely processing <strong>of</strong> appointments, and providing excellent customerservice and support to each participant in <strong>the</strong> mayoral appointment process.Mayor’s <strong>Office</strong> <strong>of</strong> <strong>Budget</strong> and Finance – advises <strong>the</strong> Mayor on financial and budgetary operations <strong>of</strong> <strong>the</strong> Districtgovernment, assists <strong>the</strong> Mayor in <strong>the</strong> formulation <strong>of</strong> <strong>the</strong> annual operating and capital budgets for <strong>the</strong> District government,and monitors agency budget performance during <strong>the</strong> fiscal year.<strong>Office</strong> <strong>of</strong> Community Affairs – provides coordinated leadership and administrative support.This program contains <strong>the</strong> following 8 activities:■ <strong>Office</strong> <strong>of</strong> Community Relations and Services (Neighborhood Engagement) – provides constituent supportthrough accessibility and coordination by resolving neighborhood obstacles and complaints, improving delivery<strong>of</strong> scheduled services, distributing educational materials, and attending community meetings;■ <strong>Office</strong> <strong>of</strong> African Affairs – provides constituent services and information to <strong>the</strong> African communities throughprogrammatic activities and outreach material; serves as a liaison between <strong>the</strong> Mayor, African communities, andDistrict government agencies; and briefs <strong>the</strong> Mayor and District government agencies about needs and interests<strong>of</strong> <strong>the</strong> African residents <strong>of</strong> <strong>the</strong> District <strong>of</strong> Columbia;■ <strong>Office</strong> <strong>of</strong> Women’s Policy and Initiatives (Commission for Women) – provides constituent services and informationto women through programmatic activities and outreach materials; serves as a liaison between <strong>the</strong>Mayor, women, and District government agencies; and briefs <strong>the</strong> Mayor and District government agenciesabout <strong>the</strong> needs and interests <strong>of</strong> <strong>the</strong> women <strong>of</strong> <strong>the</strong> District <strong>of</strong> Columbia;<strong>Office</strong> <strong>of</strong> <strong>the</strong> MayorA-26FY 2013 Proposed <strong>Budget</strong> and <strong>Financial</strong> Plan
■■■■■<strong>Office</strong> <strong>of</strong> Lesbian, Gay, Bi-sexual and Transgender Affairs (LGBT) – provides constituent services and informationto <strong>the</strong> LGBT communities through programmatic activities and outreach materials; serves as a liaisonbetween <strong>the</strong> Mayor, LGBT communities, and District government agencies; and briefs <strong>the</strong> Mayor and Districtgovernment agencies about <strong>the</strong> needs and interests <strong>of</strong> <strong>the</strong> LGBT residents <strong>of</strong> <strong>the</strong> District <strong>of</strong> Columbia;Youth Advisory Council – provides influence surrounding changes in legislation and policies that impact youthand develops youth and adult partnerships. D.C. Youth Advisory Council (YAC) advises <strong>the</strong> Mayor, <strong>the</strong>District Council, <strong>the</strong> District <strong>of</strong> Columbia Public Schools, and o<strong>the</strong>r key District government decision makers;<strong>Office</strong> on Returning Citizen Affairs – provides constituent services and information to <strong>the</strong> returning citizencommunity through programmatic activities and outreach materials; serves as a liaison between <strong>the</strong> Mayor, <strong>the</strong>returning citizen community, and District government agencies; and briefs <strong>the</strong> Mayor and District governmentagencies about <strong>the</strong> needs and interests <strong>of</strong> returning citizens <strong>of</strong> <strong>the</strong> District <strong>of</strong> Columbia;<strong>Office</strong> <strong>of</strong> Partnership and Grants – enhances <strong>the</strong> capacity <strong>of</strong> <strong>the</strong> District government and non-pr<strong>of</strong>it organizationsto obtain and manage diverse resources through effective management and oversight <strong>of</strong> <strong>the</strong> government’sdonation solicitation, grant development and grant-making process; and<strong>Office</strong> <strong>of</strong> Religious Affairs – provides constituent services and information to religious community throughprogrammatic activities and outreach materials; serves as a liaison between <strong>the</strong> Mayor, <strong>the</strong> religious community,and District government agencies; and briefs <strong>the</strong> Mayor.Serve DC – The Mayor’s <strong>Office</strong> on Volunteerism – serves as <strong>the</strong> District <strong>of</strong> Columbia’s Commission on Nationaland Community Service. The mission <strong>of</strong> <strong>the</strong> organization is to streng<strong>the</strong>n and promote <strong>the</strong> spirit <strong>of</strong> service throughpartnerships, national service, and volunteerism by coordinating regular and episodic volunteer opportunities, aswell as serving as <strong>the</strong> nexus for all volunteer partnerships and related councils, coalitions, and commissions.This program contains <strong>the</strong> following 3 activities:■ AmeriCorps – provides AmeriCorps programs to <strong>the</strong> District <strong>of</strong> Columbia and facilitates collaboration amongall national service programs including AmeriCorps, National Civilian Community Corps, and DisabilityInclusion.■ Outreach – leads <strong>the</strong> community outreach components <strong>of</strong> <strong>the</strong> DC Citizen Corps initiative; and■ Administration – provides support for staff and initiatives <strong>of</strong> State Service Commissions to fulfill <strong>the</strong> agencymission and goals to expand volunterrism service in <strong>the</strong> District, which includes but not limited to management<strong>of</strong> federal Corporation for National and Community Service grants;<strong>Agency</strong> Management Program – provides for administrative support and <strong>the</strong> required tools to achieve operationaland programmatic results. This program is standard for all agencies using performance-based budgeting.Program Structure ChangeThe <strong>Office</strong> <strong>of</strong> <strong>the</strong> Mayor has no program structure changes in <strong>the</strong> FY 2013 proposed budget.FY 2013 Proposed <strong>Budget</strong> and <strong>Financial</strong> Plan<strong>Office</strong> <strong>of</strong> <strong>the</strong> MayorA-27
FY 2013 Proposed Operating <strong>Budget</strong> and FTEs, by Program and ActivityTable AA0-4 contains <strong>the</strong> proposed FY 2013 budget by program and activity compared to <strong>the</strong> FY 2012 approved budget.It also provides <strong>the</strong> FY 2011 actual data.Table AA0-4(dollars in thousands)Dollars in ThousandsFull-Time EquivalentsChangeChangeActual Approved Proposed from Actual Approved Proposed fromProgram/Activity FY 2011 FY 2012 FY 2013 FY 2012 FY 2011 FY 2012 FY 2013 FY 2012(1000) <strong>Agency</strong> Management Program(1030) Property Management 4 0 0 0 0.0 0.0 0.0 0.0(1040) Information Technology 77 0 0 0 0.0 0.0 0.0 0.0(1070) Fleet Management 254 141 142 1 0.0 0.0 0.0 0.0(1085) Customer Service -18 0 0 0 0.0 0.0 0.0 0.0(1090) Performance Management 16 0 0 0 0.0 0.0 0.0 0.0Subtotal (1000) <strong>Agency</strong> Management Program 334 141 142 1 0.0 0.0 0.0 0.0(2000) <strong>Office</strong> <strong>of</strong> <strong>the</strong> Mayor(2001) <strong>Office</strong> <strong>of</strong> <strong>the</strong> Mayor 1,281 764 858 95 3.8 4.0 5.0 1.0(2002) Scheduling Unit 121 372 379 8 3.8 4.0 4.0 0.0(2003) <strong>Office</strong> <strong>of</strong> Communications 508 626 643 17 6.7 6.0 6.0 0.0(2004) <strong>Office</strong> <strong>of</strong> Support Services 509 412 332 -80 5.3 4.5 4.5 0.0(2005) Mayor's Correspondence Unit 424 356 354 -2 4.8 5.0 5.0 0.0(2006) <strong>Office</strong> <strong>of</strong> <strong>the</strong> General Counsel 426 455 459 4 2.9 3.0 3.0 0.0(2008) <strong>Office</strong> <strong>of</strong> Communications 50 0 0 0 0.0 0.0 0.0 0.0(2010) <strong>Office</strong> <strong>of</strong> Support Services 2 0 0 0 0.0 0.0 0.0 0.0(2018) Mayor's Correspondence Unit 8 0 0 0 0.0 0.0 0.0 0.0Subtotal (2000) <strong>Office</strong> <strong>of</strong> <strong>the</strong> Mayor 3,330 2,984 3,026 41 27.3 26.5 27.5 1.0(3000) <strong>Office</strong> <strong>of</strong> Policy and Legislative Affairs(3001) <strong>Office</strong> <strong>of</strong> Policy and Legislative Affairs 742 819 843 24 8.6 9.0 8.0 -1.0Subtotal (3000) <strong>Office</strong> <strong>of</strong> Policy and Legislative Affairs 742 819 843 24 8.6 9.0 8.0 -1.0(4000) <strong>Office</strong> <strong>of</strong> Boards and Commissions(4001) <strong>Office</strong> <strong>of</strong> Boards and Commissions 227 308 333 25 2.9 3.0 3.0 0.0Subtotal (4000) <strong>Office</strong> <strong>of</strong> Boards & Commissions 227 308 333 25 2.9 3.0 3.0 0.0(5000) <strong>Office</strong> <strong>of</strong> Community Affairs(5001) <strong>Office</strong> <strong>of</strong> Neighborhood Engagement, D.C. 1,006 1,037 1,051 14 12.4 13.0 13.0 0.0(5003) <strong>Office</strong> <strong>of</strong> Partnerships and Grant Services 203 327 332 5 2.9 3.0 3.0 0.0(5004) <strong>Office</strong> <strong>of</strong> African Affairs 221 198 200 1 1.9 2.0 2.0 0.0(5005) Commission on Women 182 189 191 2 1.9 2.0 2.0 0.0(5006) <strong>Office</strong> <strong>of</strong> LGBT Affairs 187 204 194 -10 1.9 2.0 2.0 0.0(5007) Youth Advisory Council 190 189 194 4 1.9 2.0 2.0 0.0(5008) <strong>Office</strong> on Returning Citizens Affairs 263 264 266 2 2.9 3.0 3.0 0.0(5009) <strong>Office</strong> <strong>of</strong> Religious Affairs 0 113 115 2 1.0 1.0 1.0 0.0Subtotal (5000) <strong>Office</strong> <strong>of</strong> Community Affairs 2,251 2,522 2,543 20 26.8 28.0 28.0 0.0(Continued on next page)<strong>Office</strong> <strong>of</strong> <strong>the</strong> MayorA-28FY 2013 Proposed <strong>Budget</strong> and <strong>Financial</strong> Plan
Table AA0-4 (Continued)(dollars in thousands)Dollars in ThousandsFull-Time EquivalentsChangeChangeActual Approved Proposed from Actual Approved Proposed fromDivision/Activity FY 2011 FY 2012 FY 2013 FY 2012 FY 2011 FY 2012 FY 2013 FY 2012(6000) Mayor's <strong>Office</strong> <strong>of</strong> <strong>Budget</strong> and Finance(6001) <strong>Office</strong> <strong>of</strong> <strong>Budget</strong> and Finance 749 1,219 1,236 17 9.6 9.0 9.0 0.0Subtotal (6000) Mayor's <strong>Office</strong> <strong>of</strong> <strong>Budget</strong> and Finance 749 1,219 1,236 17 9.6 9.0 9.0 0.0(7000) Serve DC(7001) Administration 300 417 750 333 3.1 3.2 6.6 3.4(7002) Americorps 3,077 3,202 3,119 -83 1.9 1.9 1.0 -1.0(7003) Learn and Serve 568 735 0 -735 1.4 1.4 0.0 -1.4(7004) Training 0 30 0 -30 0.4 0.4 0.0 -0.4(7005) Outreach 403 407 360 -46 3.9 5.0 4.4 -0.6(7008) Mayor's Community Service Award 0 4 0 -4 0.0 0.0 0.0 0.0Subtotal (7000) Serve DC 4,349 4,794 4,230 -565 10.6 12.0 12.0 0.0(9960) Year End CloseNo Activity Assigned 34,080 0 0 0 0.0 0.0 0.0 0.0Subtotal (9960) Year End Close 34,080 0 0 0 0.0 0.0 0.0 0.0Total Proposed Operating <strong>Budget</strong> 46,061 12,788 12,352 -436 85.8 87.5 87.5 0.0(Change is calculated by whole numbers and numbers may not add up due to rounding)Note: For more detailed information regarding <strong>the</strong> proposed funding for <strong>the</strong> activities within this agency’s programs, please see Schedule 30-PBBProgram Summary by Activity in <strong>the</strong> FY 2013 Operating Appendices located on <strong>the</strong> <strong>Office</strong> <strong>of</strong> <strong>the</strong> <strong>Chief</strong> <strong>Financial</strong> <strong>Office</strong>r’s website.FY 2013 Proposed <strong>Budget</strong> ChangesThe Executive <strong>Office</strong> <strong>of</strong> <strong>the</strong> Mayor’s (EOM) proposed FY 2013 gross budget is $12,352,118, which represents a3.4 percent decrease from its FY 2012 approved gross budget <strong>of</strong> $12,788,389. The budget is comprised <strong>of</strong>$8,435,479 in Local funds, $3,556,300 in Federal Grant funds, and $360,338 in Intra-District funds.Current Services Funding LevelThe Current Services Funding Level (CSFL) is a Local funds ONLY representation <strong>of</strong> <strong>the</strong> true cost <strong>of</strong> operatingDistrict agencies, before consideration <strong>of</strong> policy decisions. The CSFL reflects changes from <strong>the</strong> FY 2012 approvedbudget across multiple programs, and it estimates how much it would cost an agency to continue its current programsand operations into <strong>the</strong> following fiscal year. The initial adjustments in <strong>the</strong> budget proposal representchanges that should be compared to <strong>the</strong> FY 2013 CSFL budget and not necessarily changes made to <strong>the</strong> FY 2012Local funds budget. The FY 2013 CSFL adjustments to <strong>the</strong> FY 2012 Local funds budget are described in table 5<strong>of</strong> this agency's budget chapter. Please see <strong>the</strong> CSFL Development section within Volume 1: Executive Summaryfor more information regarding <strong>the</strong> methodology used and components that comprise <strong>the</strong> CSFL.EOM’s FY 2013 CSFL Local budget is $8,401,430, which represents a $142,386, or 1.7 percent, increase over<strong>the</strong> FY 2012 approved Local funds budget <strong>of</strong> $8,259,044.FY 2013 Proposed <strong>Budget</strong> and <strong>Financial</strong> Plan<strong>Office</strong> <strong>of</strong> <strong>the</strong> MayorA-29
Initial Adjusted <strong>Budget</strong>Cost Increase: EOM increased personal services in Local funds by $47,457 and in Federal Grant funds by$131,463 due to projected increases in salary, steps, and Fringe Benefits.Cost Decrease: In Local funds, <strong>the</strong> agency made reductions <strong>of</strong> $23,494 in O<strong>the</strong>r Services and Charges, $19,935in Equipment, and $4,028 in Supplies to <strong>of</strong>fset for increased costs in personal services. Intra-District funds weredecreased by $76,815 in personal services due to <strong>the</strong> decrease in funding from <strong>the</strong> Homeland Security andManagement <strong>Agency</strong>.Eliminate: Federal Grant funds decreased by $669,659 ($466,647 in Subsidies and Transfers, $191,893 in O<strong>the</strong>rServices and Charges, and $11,120 in Supplies) due to <strong>the</strong> expiration <strong>of</strong> <strong>the</strong> Learn and Serve American HigherEducation/School Based LSAHED grant award.Additionally Adjusted <strong>Budget</strong>Technical Adjustments: Adjustment <strong>of</strong> Fringe Benefits to restore <strong>the</strong> District Government contribution foremployee health insurance from 72 percent, implemented in <strong>the</strong> FY 2011 budget, to 75 percent in FY 2013, resultingin an increase <strong>of</strong> $34,048 to EOM’s Local Funds, $1,439 to Federal Grant funds, and $866 to Intra-Districtfunds.Policy Initiatives: EOM’s Local fund personal services increased $113,449 in salaries and Fringe Benefits for adjustmentsto staffing. To <strong>of</strong>fset <strong>the</strong> policy increases, O<strong>the</strong>r Services and Charges were reduced by $86,449, <strong>Office</strong>Supplies were reduced by $22,000, and Equipment by $5,000. The policy decisions had a net zero change to <strong>the</strong>budget and total FTE count.<strong>Office</strong> <strong>of</strong> <strong>the</strong> MayorA-30FY 2013 Proposed <strong>Budget</strong> and <strong>Financial</strong> Plan
FY 2012 Approved <strong>Budget</strong> to FY 2013 Proposed <strong>Budget</strong>, by Revenue TypeTable AA0-5 itemizes <strong>the</strong> changes by revenue type between <strong>the</strong> FY 2012 approved budget and <strong>the</strong> FY 2013 proposedbudget.Table AA0-5(dollars in thousands)PROGRAM BUDGET FTELOCAL FUNDS: FY 2012 Approved <strong>Budget</strong> and FTE 8,259 77.9Fringe Benefit Rate Adjustment Multiple Programs 101 0.0Consumer Price Index Multiple Programs 10 0.0Personal Services Growth Factor Multiple Programs 32 0.0FY 2013 Current Services Funding Level <strong>Budget</strong> (CSFL) 8,401 77.9Cost Increase: Adjustment for salary, step and Fringe Benefits costs Multiple Programs 47 0.4Cost Decrease: Adjustment to O<strong>the</strong>r Services and Charges Multiple Programs -23 0.0Cost Decrease: Equipment Multiple Programs -20 0.0Cost Decrease: Adjustment to Supplies Multiple Programs -4 0.0FY 2013 Initial Adjusted <strong>Budget</strong> 8,401 78.3Technical Adjustment: Health insurance contribution Multiple Programs 34 0.0FY 2013 Additionally Adjusted <strong>Budget</strong> 8,435 78.3FY 2013 Policy InitiativesCost Increase: Adjustments in salaries and Fringe Multiple Programs 113 0.0Benefits to staffingCost Decrease: Adjustments to O<strong>the</strong>r Services and Charges Multiple Programs -86 0.0Cost Decrease: Adjustments to <strong>Office</strong> Supplies Multiple Programs -22 0.0Cost Decrease: Adjustment to Equipment <strong>Office</strong> <strong>of</strong> <strong>the</strong> Mayor -5 0.0LOCAL FUNDS: FY 2013 Proposed <strong>Budget</strong> and FTE 8,435 78.3FEDERAL GRANT FUNDS: FY 2012 Approved <strong>Budget</strong> and FTE 4,093 4.1Cost Increase: Adjustment to salary, step and Fringe Benefits costs Serve DC 131 0.7Eliminate: Subsidies reduction from end <strong>of</strong> Learn and Serve DC -467 0.0Serve grantEliminate: O<strong>the</strong>r Services and Charges reduction from Serve DC -192 0.0end <strong>of</strong> Learn and Serve grantEliminate: Supplies reduction from end <strong>of</strong> Learn and Serve grant Serve DC -11 0.0FY 2013 Initial Adjusted <strong>Budget</strong> 3,555 4.8Technical Adjustment: Health insurance contribution Serve DC 1 0.0FY 2013 Additionally Adjusted <strong>Budget</strong> 3,556 4.8FEDERAL GRANT FUNDS: FY 2013 Proposed <strong>Budget</strong> and FTE 3,556 4.8INTRA-DISTRICT FUNDS: FY 2012 Approved <strong>Budget</strong> and FTE 436 5.5Cost Decrease: Adjustment to salary, step and Fringe Benefits costs Serve DC -77 -1.1FY 2013 Initial Adjusted <strong>Budget</strong> 359 4.4Technical Adjustment: Health insurance contribution Serve DC 1 0.0FY 2013 Additionally Adjusted <strong>Budget</strong> 360 4.4INTRA-DISTRICT FUNDS: FY 2013 Proposed <strong>Budget</strong> and FTE 360 4.4Gross for AA0 - <strong>Office</strong> <strong>of</strong> <strong>the</strong> Mayor 12,352 87.5(Change is calculated by whle numbers and numbers may not add up due to rounding)FY 2013 Proposed <strong>Budget</strong> and <strong>Financial</strong> Plan<strong>Office</strong> <strong>of</strong> <strong>the</strong> MayorA-31
<strong>Agency</strong> Performance PlanThe agency’s performance plan has <strong>the</strong> following objectives for FY 2013:1. <strong>Office</strong> <strong>of</strong> Boards and CommissionsObjective 1: Recruit highly qualified, diverse, ethically sound candidates who serve <strong>the</strong> District through appointmentto various boards and commissions.<strong>Office</strong> <strong>of</strong> Boards and CommissionsFY 2010 FY 2011 FY 2012 FY 2013 FY 2014Measure Actual Actual Projection Projection ProjectionNotNumber <strong>of</strong> appointments to Boards and Commissions Available 179 200 200 2002. <strong>Office</strong> <strong>of</strong> CommunicationsObjective 1: Effectively communicate information, updates, goals, and accomplishments <strong>of</strong> <strong>the</strong> EOM through avariety <strong>of</strong> relevant communication vehicles in an effort to provide quality public affairs services to residents andstakeholders.<strong>Office</strong> <strong>of</strong> CommunicationsFY 2010 FY 2011 FY 2012 FY 2013 FY 2014Measure Actual Actual Projection Projection ProjectionNot NotNumber <strong>of</strong> communications issued Available Available Baseline Baseline BaselineNotNumber <strong>of</strong> Twitter Followers Available 6,000 7,000 7,500 7,700<strong>Office</strong> <strong>of</strong> <strong>the</strong> MayorA-32FY 2013 Proposed <strong>Budget</strong> and <strong>Financial</strong> Plan
<strong>Office</strong> <strong>of</strong> Community Affairs(RP0)www.oco.eom.dc.govTelephone: 202-442-8150% ChangeFY 2011 FY 2012 FY 2013 fromDescription Actual Approved Proposed FY 2012Operating <strong>Budget</strong> $0 $0 $0 N/AThe <strong>Office</strong> <strong>of</strong> Community Affairs has been absorbed into <strong>the</strong> <strong>Office</strong><strong>of</strong> <strong>the</strong> Mayor.Summary <strong>of</strong> ServicesIn FY 2011, <strong>the</strong> <strong>Office</strong> <strong>of</strong> Community Affairs was absorbed into <strong>the</strong> <strong>Office</strong> <strong>of</strong> <strong>the</strong> Mayor as part <strong>of</strong> <strong>the</strong> Fiscal Year2011 Supplemental <strong>Budget</strong> Support Act <strong>of</strong> 2010, which represents <strong>the</strong> amended version <strong>of</strong> <strong>the</strong> FY 2011 Proposed<strong>Budget</strong> and <strong>Financial</strong> Plan published July 1, 2010. All property, records, unexpended balances, and o<strong>the</strong>r fundsavailable to <strong>the</strong> agency were transferred to <strong>the</strong> <strong>Office</strong> <strong>of</strong> <strong>the</strong> Mayor. No appropriation for <strong>the</strong> <strong>Office</strong> <strong>of</strong> CommunityAffairs is included in <strong>the</strong> FY 2013 Proposed <strong>Budget</strong>. The proposed programs and services for FY 2013 are shownin <strong>the</strong> <strong>Office</strong> <strong>of</strong> <strong>the</strong> Mayor’s budget chapter within <strong>the</strong> Governmental Direction and Support appropriation title.The agency’s FY 2013 proposed budget is presented in <strong>the</strong> following tables:FY 2013 Proposed <strong>Budget</strong> and <strong>Financial</strong> Plan<strong>Office</strong> <strong>of</strong> Community AffairsA-33
FY 2013 Proposed Gross Funds Operating <strong>Budget</strong>, by Revenue TypeTable RP0-1 contains <strong>the</strong> proposed FY 2013 agency budget compared to <strong>the</strong> FY 2012 approved budget. It alsoprovides FY 2010 and FY 2011 actual expenditures.Table RP0-1(dollars in thousands)ChangeActual Actual Approved Proposed from PercentAppropriated Fund FY 2010 FY 2011 FY 2012 FY 2013 FY 2012 Change*General FundLocal Funds 2,678 0 0 0 0 N/ATotal for General Fund 2,678 0 0 0 0 N/AGross Funds 2,678 0 0 0 0 N/A*Percent change is based on whole dollars.Note: If applicable, for a breakdown <strong>of</strong> each Grant (Federal and Private), Special Purpose Revenue type and Intra-District agreement,please refer to Schedule 80 <strong>Agency</strong> Summary by Revenue Source in <strong>the</strong> FY 2013 Operating Appendices located on <strong>the</strong> <strong>Office</strong> <strong>of</strong> <strong>the</strong><strong>Chief</strong> <strong>Financial</strong> <strong>Office</strong>r’s website.FY 2013 Proposed Full-Time Equivalents, by Revenue TypeTable RP0-2 contains <strong>the</strong> proposed FY 2013 FTE level compared to <strong>the</strong> FY 2012 approved FTE level by revenuetype. It also provides FY 2010 and FY 2011 actual data.Table RP0-2ChangeActual Actual Approved Proposed from PercentAppropriated Fund FY 2010 FY 2011 FY 2012 FY 2013 FY 2012 ChangeGeneral FundLocal Funds 27.1 0.0 0.0 0.0 0.0 N/ATotal for General Fund 27.1 0.0 0.0 0.0 0.0 N/ATotal Proposed FTEs 27.1 0.0 0.0 0.0 0.0 N/A<strong>Office</strong> <strong>of</strong> Community AffairsA-34FY 2013 Proposed <strong>Budget</strong> and <strong>Financial</strong> Plan
FY 2013 Proposed Operating <strong>Budget</strong>, by Comptroller Source GroupTable RP0-3 contains <strong>the</strong> proposed FY 2013 budget at <strong>the</strong> Comptroller Source Group (object class) level comparedto <strong>the</strong> FY 2012 approved budget. It also provides FY 2010 and FY 2011 actual expenditures.Table RP0-3(dollars in thousands)ChangeActual Actual Approved Proposed from PercentComptroller Source Group FY 2010 FY 2011 FY 2012 FY 2013 FY 2012 Change*11 - Regular Pay - Continuing Full Time 1,580 0 0 0 0 N/A12 - Regular Pay - O<strong>the</strong>r 168 0 0 0 0 N/A13 - Additional Gross Pay 34 0 0 0 0 N/A14 - Fringe Benefits - Current Personnel 340 0 0 0 0 N/A15 - Overtime Pay 1 0 0 0 0 N/ASubtotal Personal Services (PS) 2,123 0 0 0 0 N/A20 - Supplies and Materials 40 0 0 0 0 N/A30 - Energy, Comm. and Building Rentals 180 0 0 0 0 N/A31 - Telephone, Telegraph, Telegram, Etc. 45 0 0 0 0 N/A33 - Janitorial Services 13 0 0 0 0 N/A34 - Security Services 5 0 0 0 0 N/A35 - Occupancy Fixed Costs 7 0 0 0 0 N/A40 - O<strong>the</strong>r Services and Charges 165 0 0 0 0 N/A41 - Contractual Services - O<strong>the</strong>r 91 0 0 0 0 N/A70 - Equipment and Equipment Rental 7 0 0 0 0 N/ASubtotal Nonpersonal Services (NPS) 555 0 0 0 0 N/AGross Funds 2,678 0 0 0 0 N/A*Percent change is based on whole dollars.Program DescriptionPlease see <strong>the</strong> <strong>Office</strong> <strong>of</strong> <strong>the</strong> Mayor’s budget chapter for a description <strong>of</strong> activities related to <strong>the</strong> functions <strong>of</strong> <strong>the</strong><strong>Office</strong> <strong>of</strong> Community Affairs.Program Structure ChangeThe <strong>Office</strong> <strong>of</strong> Community Affairs has no program structure changes in <strong>the</strong> FY 2013 proposed budget.FY 2013 Proposed <strong>Budget</strong> ChangesIn FY 2011, <strong>the</strong> programs, activities, funding and functions <strong>of</strong> <strong>the</strong> <strong>Office</strong> <strong>of</strong> Community Affairs were transferredto <strong>the</strong> <strong>Office</strong> <strong>of</strong> <strong>the</strong> Mayor pursuant to <strong>the</strong> amended version <strong>of</strong> <strong>the</strong> FY 2011 proposed budget.FY 2013 Proposed <strong>Budget</strong> and <strong>Financial</strong> Plan<strong>Office</strong> <strong>of</strong> Community AffairsA-35
(RS0)Serve DCwww.serve.dc.govTelephone: 202-727-7925% ChangeFY 2011 FY 2012 FY 2013 fromDescription Actual Approved Proposed FY 2012Operating <strong>Budget</strong> $0 $0 $0 N/AServe DC, <strong>the</strong> Mayor’s <strong>Office</strong> on Volunteerism and <strong>the</strong> District <strong>of</strong>Columbia’s Commission on National and Community Service, hasbeen absorbed into <strong>the</strong> <strong>Office</strong> <strong>of</strong> <strong>the</strong> Mayor.In FY 2011, Serve DC was absorbed into <strong>the</strong> <strong>Office</strong> <strong>of</strong> <strong>the</strong> Mayor as part <strong>of</strong> <strong>the</strong> Fiscal Year 2011 Supplemental<strong>Budget</strong> Support Act <strong>of</strong> 2010, which represents <strong>the</strong> amended version <strong>of</strong> <strong>the</strong> FY 2011 Proposed <strong>Budget</strong> and <strong>Financial</strong>Plan published July 1, 2010. All property, records, unexpended balances, and o<strong>the</strong>r funds available to <strong>the</strong> agencywere transferred to <strong>the</strong> <strong>Office</strong> <strong>of</strong> <strong>the</strong> Mayor. No appropriation for Serve DC is included in <strong>the</strong> FY 2013 Proposed<strong>Budget</strong>. The proposed programs and services for FY 2013 are shown in <strong>the</strong> <strong>Office</strong> <strong>of</strong> <strong>the</strong> Mayor’s budget chapterwithin <strong>the</strong> Governmental Direction and Support appropriation title.The agency’s FY 2013 proposed budget is presented in <strong>the</strong> following tables:FY 2013 Proposed <strong>Budget</strong> and <strong>Financial</strong> PlanServe DCA-37
FY 2013 Proposed Gross Funds Operating <strong>Budget</strong>, by Revenue TypeTable RS0-1 contains <strong>the</strong> proposed FY 2013 agency budget compared to <strong>the</strong> FY 2012 approved budget. It alsoprovides FY 2010 and FY 2011 actual expenditures.Table RS0-1(dollars in thousands)ChangeActual Actual Approved Proposed from PercentAppropriated Fund FY 2010 FY 2011 FY 2012 FY 2013 FY 2012 Change*General FundLocal Funds 355 0 0 0 0 N/ATotal for General Fund 355 0 0 0 0 N/AFederal ResourcesFederal Grant Funds 3,087 0 0 0 0 N/ATotal for Federal Resources 3,087 0 0 0 0 N/APrivate FundsPrivate Donations 5 0 0 0 0 N/ATotal for Private Funds 5 0 0 0 0 N/AIntra-District FundsIntra-District Funds 453 0 0 0 0 N/ATotal for Intra-District Funds 453 0 0 0 0 N/AGross Funds 3,900 0 0 0 0 N/A*Percent change is based on whole dollars.Note: If applicable, for a breakdown <strong>of</strong> each Grant (Federal and Private), Special Purpose Revenue type and Intra-District agreement,please refer to Schedule 80 <strong>Agency</strong> Summary by Revenue Source in <strong>the</strong> FY 2013 Operating Appendices located on <strong>the</strong> <strong>Office</strong> <strong>of</strong> <strong>the</strong><strong>Chief</strong> <strong>Financial</strong> <strong>Office</strong>r’s website.Serve DCA-38FY 2013 Proposed <strong>Budget</strong> and <strong>Financial</strong> Plan
FY 2013 Proposed Full-Time Equivalents, by Revenue TypeTable RS0-2 contains <strong>the</strong> proposed FY 2013 FTE level compared to <strong>the</strong> FY 2012 approved FTE level by revenuetype. It also provides FY 2010 and FY 2011 actual data.Table RS0-2ChangeActual Actual Approved Proposed from PercentAppropriated Fund FY 2010 FY 2011 FY 2012 FY 2013 FY 2012 ChangeGeneral FundLocal Funds 2.4 0.0 0.0 0.0 0.0 N/ATotal for General Fund 2.4 0.0 0.0 0.0 0.0 N/AFederal ResourcesFederal Grant Funds 6.0 0.0 0.0 0.0 0.0 N/ATotal for Federal Resources 6.0 0.0 0.0 0.0 0.0 N/AIntra-District FundsIntra-District Funds 0.8 0.0 0.0 0.0 0.0 N/ATotal for Intra-District Funds 0.8 0.0 0.0 0.0 0.0 N/ATotal Proposed FTEs 9.2 0.0 0.0 0.0 0.0 N/AFY 2013 Proposed <strong>Budget</strong> and <strong>Financial</strong> PlanServe DCA-39
FY 2013 Proposed Operating <strong>Budget</strong>, by Comptroller Source GroupTable RS0-3 contains <strong>the</strong> proposed FY 2013 budget at <strong>the</strong> Comptroller Source Group (object class) level comparedto <strong>the</strong> FY 2012 approved budget. It also provides FY 2010 and FY 2011 actual expenditures.Table RS0-3(dollars in thousands)ChangeActual Actual Approved Proposed from PercentComptroller Source Group FY 2010 FY 2011 FY 2012 FY 2013 FY 2012 Change*11 - Regular Pay - Continuing Full Time 319 0 0 0 0 N/A12 - Regular Pay - O<strong>the</strong>r 499 0 0 0 0 N/A13 - Additional Gross Pay 7 0 0 0 0 N/A14 - Fringe Benefits - Current Personnel 154 0 0 0 0 N/ASubtotal Personal Services (PS) 979 0 0 0 0 N/A20 - Supplies and Materials 20 0 0 0 0 N/A30 - Energy, Comm. and Building Rentals 3 0 0 0 0 N/A31 - Telephone, Telegraph, Telegram, Etc. 26 0 0 0 0 N/A33 - Janitorial Services 11 0 0 0 0 N/A34 - Security Services 12 0 0 0 0 N/A35 - Occupancy Fixed Costs 18 0 0 0 0 N/A40 - O<strong>the</strong>r Services and Charges 186 0 0 0 0 N/A50 - Subsidies and Transfers 2,627 0 0 0 0 N/A70 - Equipment and Equipment Rental 17 0 0 0 0 N/ASubtotal Nonpersonal Services (NPS) 2,921 0 0 0 0 N/AGross Funds 3,900 0 0 0 0 N/A*Percent change is based on whole dollars.Program DescriptionPlease see <strong>the</strong> <strong>Office</strong> <strong>of</strong> <strong>the</strong> Mayor’s budget chapter for a description <strong>of</strong> activities related to <strong>the</strong> functions <strong>of</strong> ServeDC.Program Structure ChangeServe DC has no program structure changes in <strong>the</strong> FY 2013 proposed budget.FY 2013 Proposed <strong>Budget</strong> ChangesFor FY 2011, <strong>the</strong> programs, activities, funding, and functions <strong>of</strong> Serve DC were transferred to <strong>the</strong> <strong>Office</strong> <strong>of</strong> <strong>the</strong>Mayor pursuant to <strong>the</strong> amended version <strong>of</strong> <strong>the</strong> FY 2011 proposed budget.Serve DCA-40FY 2013 Proposed <strong>Budget</strong> and <strong>Financial</strong> Plan
<strong>Office</strong> <strong>of</strong> <strong>the</strong> Secretary(BA0)www.os.dc.govTelephone: 202-727-6306% ChangeFY 2011 FY 2012 FY 2013 fromDescription Actual Approved Proposed FY 2012Operating <strong>Budget</strong> $2,871,082 $2,905,017 $3,245,931 11.7FTEs 21.2 21.0 24.0 14.3The mission <strong>of</strong> <strong>the</strong> <strong>Office</strong> <strong>of</strong> <strong>the</strong> Secretary <strong>of</strong> <strong>the</strong> District <strong>of</strong> Columbiais to provide protocol, au<strong>the</strong>ntication, ceremonial, and records managementservices on behalf <strong>of</strong> <strong>the</strong> Mayor and District governmentagencies in a manner that is efficient, accountable, and customerfriendly.Summary <strong>of</strong> ServicesThe <strong>Office</strong> <strong>of</strong> <strong>the</strong> Secretary <strong>of</strong> <strong>the</strong> District <strong>of</strong> Columbia provides document management through <strong>the</strong> <strong>Office</strong> <strong>of</strong>Notary Commissions and Au<strong>the</strong>ntications, <strong>the</strong> <strong>Office</strong> <strong>of</strong> Documents and Administrative Issuances (publishers <strong>of</strong><strong>the</strong> D.C. Register and <strong>the</strong> D.C. Municipal Regulations), and <strong>the</strong> <strong>Office</strong> <strong>of</strong> Public Records (managers <strong>of</strong> <strong>the</strong> D.C.Records Center and <strong>the</strong> District <strong>of</strong> Columbia Archives). The Ceremonial Services Unit is responsible for allMayoral proclamations and ceremonial documents, and <strong>the</strong> <strong>Office</strong> <strong>of</strong> Protocol and International Affairs managessister city relationships and communication between <strong>the</strong> executive branch and foreign government representatives.The agency’s FY 2013 proposed budget is presented in <strong>the</strong> following tables:FY 2013 Proposed <strong>Budget</strong> and <strong>Financial</strong> Plan<strong>Office</strong> <strong>of</strong> <strong>the</strong> SecretaryA-41
FY 2013 Proposed Gross Funds Operating <strong>Budget</strong>, by Revenue TypeTable BA0-1 contains <strong>the</strong> proposed FY 2013 agency budget compared to <strong>the</strong> FY 2012 approved budget. It alsoprovides FY 2010 and FY 2011 actual expenditures.Table BA0-1(dollars in thousands)ChangeActual Actual Approved Proposed from PercentAppropriated Fund FY 2010 FY 2011 FY 2012 FY 2013 FY 2012 Change*General FundLocal Funds 2,520 2,013 2,206 2,246 40 1.8Special Purpose Revenue Funds 427 858 699 1,000 301 43.1Total for General Fund 2,947 2,871 2,905 3,246 341 11.7Private FundsPrivate Donations 8 0 0 0 0 N/ATotal for Private Funds 8 0 0 0 0 N/AGross Funds 2,955 2,871 2,905 3,246 341 11.7*Percent change is based on whole dollars.Note: If applicable, for a breakdown <strong>of</strong> each Grant (Federal and Private), Special Purpose Revenue type and Intra-District agreement,please refer to Schedule 80 <strong>Agency</strong> Summary by Revenue Source in <strong>the</strong> FY 2013 Operating Appendices located on <strong>the</strong> <strong>Office</strong> <strong>of</strong> <strong>the</strong><strong>Chief</strong> <strong>Financial</strong> <strong>Office</strong>r’s website.FY 2013 Proposed Full-Time Equivalents, by Revenue TypeTable BA0-2 contains <strong>the</strong> proposed FY 2013 FTE level compared to <strong>the</strong> FY 2012 approved FTE level by revenuetype. It also provides FY 2010 and FY 2011 actual data.Table BA0-2ChangeActual Actual Approved Proposed from PercentAppropriated Fund FY 2010 FY 2011 FY 2012 FY 2013 FY 2012 ChangeGeneral FundLocal Funds 19.7 18.0 17.0 18.0 1.0 5.9Special Purpose Revenue Funds 3.6 3.2 4.0 6.0 2.0 50.0Total for General Fund 23.3 21.2 21.0 24.0 3.0 14.3Total Proposed FTEs 23.3 21.2 21.0 24.0 3.0 14.3<strong>Office</strong> <strong>of</strong> SecretaryA-42FY 2013 Proposed <strong>Budget</strong> and <strong>Financial</strong> Plan
FY 2013 Proposed Operating <strong>Budget</strong>, by Comptroller Source GroupTable BA0-3 contains <strong>the</strong> proposed FY 2013 budget at <strong>the</strong> Comptroller Source Group (object class) level comparedto <strong>the</strong> FY 2012 approved budget. It also provides FY 2010 and FY 2011 actual expenditures.Table BA0-3(dollars in thousands)ChangeActual Actual Approved Proposed from PercentComptroller Source Group FY 2010 FY 2011 FY 2012 FY 2013 FY 2012 Change*11 - Regular Pay - Continuing Full Time 1,522 1,558 1,640 1,833 192 11.712 - Regular Pay - O<strong>the</strong>r 12 0 0 0 0 N/A13 - Additional Gross Pay 34 43 0 0 0 N/A14 - Fringe Benefits - Current Personnel 262 278 322 391 69 21.5Subtotal Personal Services (PS) 1,829 1,880 1,963 2,224 261 13.320 - Supplies and Materials 6 28 40 29 -11 -27.530 - Energy, Comm. and Building Rentals 133 0 0 0 0 N/A31 - Telephone, Telegraph, Telegram, Etc. 35 0 0 0 0 N/A33 - Janitorial Services 54 0 0 0 0 N/A34 - Security Services 8 0 0 0 0 N/A35 - Occupancy Fixed Costs 109 0 0 0 0 N/A40 - O<strong>the</strong>r Services and Charges 137 163 251 183 -68 -27.041 - Contractual Services - O<strong>the</strong>r 486 598 439 597 158 36.050 - Subsidies and Transfers 158 200 200 200 0 0.070 - Equipment and Equipment Rental 0 2 13 13 0 0.0Subtotal Nonpersonal Services (NPS) 1,126 992 942 1,022 79 8.4Gross Funds 2,955 2,871 2,905 3,246 341 11.7*Percent change is based on whole dollars.Program DescriptionThe <strong>Office</strong> <strong>of</strong> <strong>the</strong> Secretary operates through <strong>the</strong> following 7 programs:International Relations and Protocol – provides liaison and outreach services to <strong>the</strong> diplomatic and internationalcommunities on behalf <strong>of</strong> <strong>the</strong> Mayor and local residents. This program is responsible for all international visitorsto <strong>the</strong> District government, sister city relationships, and relations between embassies and <strong>the</strong>ir neighbors.Ceremonial Services – provides ceremonial document services to individuals, businesses, organizations, and governmentagencies so that <strong>the</strong>y can have <strong>the</strong>ir activities and events recognized by <strong>the</strong> Mayor. Proclamations, greetingletters, and condolence letters are among <strong>the</strong> most requested documents.FY 2013 Proposed <strong>Budget</strong> and <strong>Financial</strong> Plan<strong>Office</strong> <strong>of</strong> <strong>the</strong> SecretaryA-43
<strong>Office</strong> <strong>of</strong> Documents and Administrative Issuances – provides technical, pr<strong>of</strong>essional and o<strong>the</strong>r legal services to<strong>the</strong> Mayor, District agencies, and <strong>the</strong> general public so that <strong>the</strong>y can give and/or have <strong>of</strong>ficial notice <strong>of</strong> all proposedand adopted legal mandates.This program contains <strong>the</strong> following 2 activities:■ D.C. Register – provides review and technical assistance services to District executive and independent agenciesso that <strong>the</strong>y can comply with editorial standards and legal requirements <strong>of</strong> <strong>the</strong> District <strong>of</strong> Columbia’sAdministrative Procedures Act, implementing regulations, and District <strong>of</strong> Columbia Documents Act <strong>of</strong> 1978;and■ Administrative Issuances – provides pr<strong>of</strong>essional and technical assistance services to <strong>the</strong> Mayor and executiveagencies so that <strong>the</strong>y can implement major policies and programs and make appointments in a timely mannerto foster <strong>the</strong> activities <strong>of</strong> government.Notary Commissions and Au<strong>the</strong>ntications – provides commissions for all notaries public in <strong>the</strong> District <strong>of</strong>Columbia and au<strong>the</strong>nticates documents signed by District notaries public for domestic and foreign use. The <strong>of</strong>ficealso serves as an <strong>of</strong>ficial passport application acceptance facility for <strong>the</strong> U.S. Department <strong>of</strong> State.<strong>Office</strong> <strong>of</strong> Public Records – provides archives and records management services to District government agencies and<strong>the</strong> public so that <strong>the</strong>y can gain access to <strong>of</strong>ficial government documents.This program contains <strong>the</strong> following 3 activities:■ Records Management – provides temporary records management services to District government agencies and<strong>the</strong> public so that <strong>the</strong>y can have access to public records stored in <strong>the</strong> District <strong>of</strong> Columbia Records Center;■ Archival Administration – provides historical records management services to District government agenciesand <strong>the</strong> public so that <strong>the</strong>y can have access to historical public records stored in <strong>the</strong> District <strong>of</strong> ColumbiaArchives; and■ Library <strong>of</strong> Government Information – provides publication management services to District governmentagencies and <strong>the</strong> public so that <strong>the</strong>y can have access to publications created by <strong>the</strong> District government agencies.Executive Management – manages <strong>the</strong> work <strong>of</strong> several commissions, provides <strong>of</strong>ficial signatory services for <strong>the</strong>Mayor <strong>of</strong> <strong>the</strong> District <strong>of</strong> Columbia, takes on special projects at <strong>the</strong> request <strong>of</strong> <strong>the</strong> Mayor, and provides support for<strong>the</strong> Emancipation Day celebration and related activities to commemorate District <strong>of</strong> Columbia Emancipation Day.<strong>Agency</strong> Management Program – provides for administrative support and <strong>the</strong> required tools to achieve operationaland programmatic results. This program is standard for all agencies using performance-based budgeting.Program Structure ChangesThe <strong>Office</strong> <strong>of</strong> <strong>the</strong> Secretary has no program structure changes in <strong>the</strong> FY 2013 proposed budget.<strong>Office</strong> <strong>of</strong> SecretaryA-44FY 2013 Proposed <strong>Budget</strong> and <strong>Financial</strong> Plan
FY 2013 Proposed Operating <strong>Budget</strong> and FTEs, by Program and ActivityTable BA0-4 contains <strong>the</strong> proposed FY 2013 budget by program and activity compared to <strong>the</strong> FY 2012 approved budget.It also provides <strong>the</strong> FY 2011 actual data.Table BA0-4(dollars in thousands)Dollars in ThousandsFull-Time EquivalentsChangeChangeActual Approved Proposed from Actual Approved Proposed fromProgram/Activity FY 2011 FY 2012 FY 2013 FY 2012 FY 2011 FY 2012 FY 2013 FY 2012(1000) <strong>Agency</strong> Management Program(1020) Contracting and Procurement 152 160 162 2 1.0 1.0 1.0 0.0(1030) Property Management 0 9 4 -5 0.0 0.0 0.0 0.0(1040) Info Tech 32 0 0 0 0.0 0.0 0.0 0.0(1070) Fleet Management 71 2 76 74 1.0 0.0 1.0 1.0(1080) Communication 125 137 141 4 2.0 2.0 2.0 0.0(1085) Customer Service 72 82 83 1 0.5 1.0 1.0 0.0(1090) Performance Management 262 373 366 -7 2.0 2.0 2.0 0.0Subtotal (1000) <strong>Agency</strong> Management Program 714 763 833 70 6.5 6.0 7.0 1.0(1002) International Relations and Protocol(1200) International Relations and Protocol 141 113 181 68 1.0 1.0 2.0 1.0Subtotal (1002) International Relations and Protocol 141 113 181 68 1.0 1.0 2.0 1.0(1003) Ceremonial Services(1300) Ceremonial Services 199 222 253 30 2.0 2.0 2.0 0.0Subtotal (1003) Ceremonial Services 199 222 253 30 2.0 2.0 2.0 0.0(1004) <strong>Office</strong> <strong>of</strong> Documents and Administrative Issuances(1400) Regulations 20 108 0 -108 1.0 1.0 0.0 -1.0(1401) D.C. Register 173 192 191 -1 2.0 2.0 2.0 0.0(1402) Administrative Issuances 77 76 79 3 1.0 1.0 1.0 0.0Subtotal (1004) <strong>Office</strong> <strong>of</strong> Documents and Administrative Issuances 270 375 271 -105 4.0 4.0 3.0 -1.0(1005) Notary Commissions and Au<strong>the</strong>ntications(1501) Notary Au<strong>the</strong>ntications 354 317 474 157 3.2 4.0 6.0 2.0Subtotal (1005) Notary Commissions and Au<strong>the</strong>ntications 354 317 474 157 3.2 4.0 6.0 2.0(1006) <strong>Office</strong> <strong>of</strong> Public Records(1600) Records Management 846 749 867 118 2.0 2.0 2.0 0.0(1601) Archival Administration 76 97 98 2 1.0 1.0 1.0 0.0(1602) Library <strong>of</strong> Government Information 71 68 69 1 1.0 1.0 1.0 0.0Subtotal (1006) <strong>Office</strong> <strong>of</strong> Public Records 993 914 1,035 121 4.0 4.0 4.0 0.0(Continued on next page)FY 2013 Proposed <strong>Budget</strong> and <strong>Financial</strong> Plan<strong>Office</strong> <strong>of</strong> <strong>the</strong> SecretaryA-45
Table BA0-4 (Continued)(dollars in thousands)Dollars in ThousandsFull-Time EquivalentsChangeChangeActual Approved Proposed from Actual Approved Proposed fromProgram/Activity FY 2011 FY 2012 FY 2013 FY 2012 FY 2011 FY 2012 FY 2013 FY 2012(1007) Executive Management(1700) Executive Management 0 1 0 -1 0.0 0.0 0.0 0.0(1701) Emancipation Day Activities 200 200 200 0 0.5 0.0 0.0 0.0Subtotal (1007) Executive Management 200 201 200 -1 0.5 0.0 0.0 0.0Total Proposed Operating <strong>Budget</strong> 2,871 2,905 3,246 341 21.2 21.0 24.0 3.0(Change is calculated by whole numbers and numbers may not add up due to rounding)Note: For more detailed information regarding <strong>the</strong> proposed funding for <strong>the</strong> activities within this agency’s programs, please see Schedule 30-PBBProgram Summary by Activity in <strong>the</strong> FY 2013 Operating Appendices located on <strong>the</strong> <strong>Office</strong> <strong>of</strong> <strong>the</strong> <strong>Chief</strong> <strong>Financial</strong> <strong>Office</strong>r’s website.FY 2013 Proposed <strong>Budget</strong> ChangesThe <strong>Office</strong> <strong>of</strong> <strong>the</strong> Secretary’s (OS) proposed FY 2013 gross budget is $3,245,931, which represents an 11.7 percentincrease over its FY 2012 approved gross budget <strong>of</strong> $2,905,017. The budget is comprised <strong>of</strong> $2,245,931 inLocal funds and $1,000,000 in Special Purpose Revenue.Current Services Funding LevelThe Current Services Funding Level (CSFL) is a Local funds ONLY representation <strong>of</strong> <strong>the</strong> true cost <strong>of</strong> operatingDistrict agencies, before consideration <strong>of</strong> policy decisions. The CSFL reflects changes from <strong>the</strong> FY 2012 approvedbudget across multiple programs, and it estimates how much it would cost an agency to continue its current programsand operations into <strong>the</strong> following fiscal year. The initial adjustments in <strong>the</strong> budget proposal representchanges that should be compared to <strong>the</strong> FY 2013 CSFL budget and not necessarily changes made to <strong>the</strong> FY 2012Local funds budget. The FY 2013 CSFL adjustments to <strong>the</strong> FY 2012 Local funds budget are described in table 5<strong>of</strong> this agency's budget chapter. Please see <strong>the</strong> CSFL Development section within Volume 1: Executive Summaryfor more information regarding <strong>the</strong> methodology used and components that comprise <strong>the</strong> CSFL.OS’ FY 2013 CSFL budget is $2,239,273, which represents a $32,984, or 1.5 percent, increase over <strong>the</strong> FY2012 approved Local funds budget <strong>of</strong> $2,206,289.Initial Adjusted <strong>Budget</strong>Cost Increase: Local funds – OS increased salaries by $60,000 and Fringe Benefits by $12,000 in support <strong>of</strong> projectedstep increases. Special Purpose Revenue - OS increased Contractual Services by $210,759 for projected costsfor <strong>the</strong> National Archives and Records Administration (NARA) contract. In addition, salary and Fringe Benefitswere increased by $4,231.Cost Decrease: Local funds – O<strong>the</strong>r Services and Charges were reduced by $56,000 and Supplies and Materials by$12,000 to <strong>of</strong>fset step increases and Fringe Benefits. Contractual Services were reduced by $4,000 and Equipmentand Equipment Rental by $260. Special Purpose Revenue - O<strong>the</strong>r Services and Charges for pr<strong>of</strong>essional servicefees were decreased by $13,718.<strong>Office</strong> <strong>of</strong> SecretaryA-46FY 2013 Proposed <strong>Budget</strong> and <strong>Financial</strong> Plan
Additionally Adjusted <strong>Budget</strong>Technical Adjustments: Adjustment <strong>of</strong> Fringe Benefits to restore <strong>the</strong> District Government contribution foremployee health insurance from 72 percent, implemented in <strong>the</strong> FY 2011 budget, to 75 percent in FY 2013, resultingin an increase <strong>of</strong> $6,658 to OS’ Local funds and $960 to Special Purpose Revenue.Additional Adjustments: Special Purpose Revenue - OS increased Contractual Services – O<strong>the</strong>r by $99,040 basedupon revenue collection projections for public records services.Policy InitiativesEnhance: Special Purpose Revenue – OS’ personal services budget was increased by $151,685 and 2.0 FTEs for<strong>the</strong> Notary Commissions and Au<strong>the</strong>ntications program.Reduce: Special Purpose Revenue – Contractual Services in OS’ <strong>Office</strong> <strong>of</strong> Public Records program was reduced by$151,685 to <strong>of</strong>fset <strong>the</strong> cost <strong>of</strong> 2.0 FTEs added for notary and au<strong>the</strong>ntication services.FY 2012 Approved <strong>Budget</strong> to FY 2013 Proposed <strong>Budget</strong>, by Revenue TypeTable BA0-5 itemizes <strong>the</strong> changes by revenue type between <strong>the</strong> FY 2012 approved budget and <strong>the</strong> FY 2013 proposedbudget.Table BA0-5(dollars in thousands)PROGRAM BUDGET FTELOCAL FUNDS: FY 2012 Approved <strong>Budget</strong> and FTE 2,206 17.0Fringe Benefit Rate Adjustment Multiple Programs 19 0.0Consumer Price Index Multiple Programs 7 0.0Personal Services Growth Factor Multiple Programs 7 0.0FY 2013 Current Services Funding Level <strong>Budget</strong> (CSFL) 2,239 17.0Cost Increase: Adjust salary to projected step increases Multiple Programs 60 1.0Cost Increase: Align Fringe Benefits with projected costs Multiple Programs 12 0.0Cost Decrease: Reduce O<strong>the</strong>r Services and Charges Multiple Programs -56 0.0Cost Decrease: Reduce Supplies and Materials <strong>Agency</strong> Management Program -12 0.0Cost Decrease: Reduce Contractual Services - O<strong>the</strong>r <strong>Office</strong> <strong>of</strong> Public Records -4 0.0Cost Decrease: Reduce Equipment and Equipment Rental (less than $500) <strong>Office</strong> <strong>of</strong> Public Records 0 0.0FY 2013 Initial Adjusted <strong>Budget</strong> 2,239 18.0Technical Adjustment: Health insurance contribution Multiple Programs 7 0.0FY 2013 Additionally Adjusted <strong>Budget</strong> 2,246 18.0LOCAL FUNDS: FY 2013 Proposed <strong>Budget</strong> and FTE 2,246 18.0SPECIAL PURPOSE REVENUE FUNDS: FY 2012 Approved <strong>Budget</strong> and FTE 699 4.0Cost Increase: Adjust Contractual Services with projected <strong>Office</strong> <strong>of</strong> Public Records 211 0.0costs for <strong>the</strong> National Archives and RecordsAdministration (NARA) contractCost Increase: Align salary and Fringe Benefits with Notary Commissions and Au<strong>the</strong>ntications 4 0.0projected costsCost Decrease: Reduce O<strong>the</strong>r Services and Charges Ceremonial Services -14 0.0FY 2013 Initial Adjusted <strong>Budget</strong> 900 4.0(Continued on next page)FY 2013 Proposed <strong>Budget</strong> and <strong>Financial</strong> Plan<strong>Office</strong> <strong>of</strong> <strong>the</strong> SecretaryA-47
Table BA0-5 (continued)(dollars in thousands)PROGRAM BUDGET FTEAdditional Adjustments: Increased Contractual Services - O<strong>the</strong>r <strong>Office</strong> <strong>of</strong> Public Records 99 0.0based upon revenue projectionsTechnical Adjustment: Health insurance contribution Multiple Programs 1 0.0FY 2013 Additionally Adjusted <strong>Budget</strong> 1,000 4.0FY 2013 Policy InitiativesEnhance: Add FTEs for notary and au<strong>the</strong>ntication services Notary Commission 152 2.0and Au<strong>the</strong>nticationsReduce: Decreased Contractual Services to <strong>of</strong>fset salaries <strong>Office</strong> <strong>of</strong> Public Records -152 0.0for new FTEsSPECIAL PURPOSE REVENUE FUNDS: FY 2013 Proposal <strong>Budget</strong> and FTE 1,000 6.0Gross for BA0 - <strong>Office</strong> <strong>of</strong> <strong>the</strong> Secretary 3,246 24.0(Change is calculated by whole numbers and numbers may not add up due to rounding)<strong>Office</strong> <strong>of</strong> SecretaryA-48FY 2013 Proposed <strong>Budget</strong> and <strong>Financial</strong> Plan
<strong>Office</strong> <strong>of</strong> <strong>the</strong> City Administrator(AE0)www.oca.dc.govTelephone: 202-478-9200% ChangeFY 2011 FY 2012 FY 2013 fromDescription Actual Approved Proposed FY 2012Operating <strong>Budget</strong> $4,105,213 $3,283,292 $3,689,056 12.4FTEs 34.1 35.0 26.0 -25.7The mission <strong>of</strong> <strong>the</strong> <strong>Office</strong> <strong>of</strong> <strong>the</strong> City Administrator (OCA) is to facilitate<strong>the</strong> effective and efficient implementation <strong>of</strong> <strong>the</strong> Mayor’s policiesby providing leadership, support, and oversight <strong>of</strong> District agencies.Summary <strong>of</strong> ServicesThe <strong>Office</strong> <strong>of</strong> <strong>the</strong> City Administrator provides oversight and support to <strong>the</strong> Deputy Mayors and increases governmenteffectiveness with cross-agency and targeted improvement initiatives, including <strong>the</strong> integration <strong>of</strong> strategicpolicy priorities, budgetary constraints, and operational directives.The agency’s FY 2013 proposed budget is presented in <strong>the</strong> following tables:FY 2013 Proposed <strong>Budget</strong> and <strong>Financial</strong> Plan<strong>Office</strong> <strong>of</strong> <strong>the</strong> City AdministratorA-49
FY 2013 Proposed Gross Funds Operating <strong>Budget</strong>, by Revenue TypeTable AE0-1 contains <strong>the</strong> proposed FY 2013 agency budget compared to <strong>the</strong> FY 2012 approved budget. It alsoprovides FY 2010 and FY 2011 actual expenditures.Table AE0-1(dollars in thousands)ChangeActual Actual Approved Proposed from PercentAppropriated Fund FY 2010 FY 2011 FY 2012 FY 2013 FY 2012 Change*General FundLocal Funds 5,017 4,012 3,283 3,401 118 3.6Total for General Fund 5,017 4,012 3,283 3,401 118 3.6Private FundsPrivate Donations 15 63 0 0 0 N/ATotal for Private Funds 15 63 0 0 0 N/AIntra-District FundsIntra-District Funds 52 30 0 288 288 N/ATotal for Intra-District Funds 52 30 0 288 288 N/AGross Funds 5,085 4,105 3,283 3,689 406 12.4*Percent change is based on whole dollars.Note: If applicable, for a breakdown <strong>of</strong> each Grant (Federal and Private), Special Purpose Revenue type and Intra-District agreement,please refer to Schedule 80 <strong>Agency</strong> Summary by Revenue Source in <strong>the</strong> FY 2013 Operating Appendices located on <strong>the</strong> <strong>Office</strong> <strong>of</strong> <strong>the</strong><strong>Chief</strong> <strong>Financial</strong> <strong>Office</strong>r’s website.FY 2013 Proposed Full-Time Equivalents, by Revenue TypeTable AE0-2 contains <strong>the</strong> proposed FY 2013 FTE level compared to <strong>the</strong> FY 2012 approved FTE level by revenuetype. It also provides FY 2010 and FY 2011 actual data.Table AE0-2ChangeActual Actual Approved Proposed from PercentAppropriated Fund FY 2010 FY 2011 FY 2012 FY 2013 FY 2012 ChangeGeneral FundLocal Funds 45.5 34.1 35.0 22.4 -12.6 -36.1Total for General Fund 45.5 34.1 35.0 22.4 -12.6 -36.1Intra-District FundsIntra-District Funds 0.0 0.0 0.0 3.6 3.6 N/ATotal for Intra-District Funds 0.0 0.0 0.0 3.6 3.6 N/ATotal Proposed FTEs 45.5 34.1 35.0 26.0 -9.0 -25.7<strong>Office</strong> <strong>of</strong> <strong>the</strong> City AdministratorA-50FY 2013 Proposed <strong>Budget</strong> and <strong>Financial</strong> Plan
FY 2013 Proposed Operating <strong>Budget</strong>, by Comptroller Source GroupTable AE0-3 contains <strong>the</strong> proposed FY 2013 budget at <strong>the</strong> Comptroller Source Group (object class) level comparedto <strong>the</strong> FY 2012 approved budget. It also provides FY 2010 and FY 2011 actual expenditures.Table AE0-3(dollars in thousands)ChangeActual Actual Approved Proposed from PercentComptroller Source Group FY 2010 FY 2011 FY 2012 FY 2013 FY 2012 Change*11 - Regular Pay - Continuing Full Time 3,517 2,830 2,039 2,604 564 27.712 - Regular Pay - O<strong>the</strong>r 348 160 276 110 -166 -60.313 - Additional Gross Pay 43 207 0 0 0 N/A14 - Fringe Benefits - Current Personnel 677 530 498 635 137 27.415 - Overtime Pay 0 0 0 0 0 N/ASubtotal Personal Services (PS) 4,585 3,727 2,814 3,349 535 19.020 - Supplies and Materials 27 26 22 23 0 2.230 - Energy, Comm. and Building Rentals 65 6 0 0 0 N/A31 - Telephone, Telegraph, Telegram, Etc. 146 5 0 0 0 N/A33 - Janitorial Services 21 0 0 0 0 N/A34 - Security Services 12 0 0 0 0 N/A35 - Occupancy Fixed Costs 26 0 0 0 0 N/A40 - O<strong>the</strong>r Services and Charges 203 208 147 162 15 10.541 - Contractual Services - O<strong>the</strong>r 0 134 300 150 -150 -50.070 - Equipment and Equipment Rental 0 0 0 5 5 N/ASubtotal Nonpersonal Services (NPS) 500 378 469 341 -129 -27.5Gross Funds 5,085 4,105 3,283 3,689 406 12.4*Percent change is based on whole dollars.FY 2013 Proposed <strong>Budget</strong> and <strong>Financial</strong> Plan<strong>Office</strong> <strong>of</strong> <strong>the</strong> City AdministratorA-51
Division DescriptionThe <strong>Office</strong> <strong>of</strong> <strong>the</strong> City Administrator operates through <strong>the</strong> following 3 divisions:City Administrator – provides support to <strong>the</strong> City Administrator and District agencies in <strong>the</strong> areas <strong>of</strong> budget, management,and policy; organizes accountability sessions with <strong>the</strong> Mayor and City Administrator; and manages <strong>the</strong>city’s Performance Management activity.This division contains <strong>the</strong> following 2 activities:■ Resource and Program Management – provides support to <strong>the</strong> City Administrator and District agencies in <strong>the</strong>areas <strong>of</strong> budget, management, and policy implementation; and■ DCStat – organizes accountability sessions with <strong>the</strong> Mayor and City Administrator and manages <strong>the</strong> city’sPerformance Management activity.Labor Relations and Collective Bargaining – represents <strong>the</strong> District <strong>of</strong> Columbia as <strong>the</strong> principal managementadvocate during labor negotiations and in administering <strong>the</strong> District’s Labor Relations activity.<strong>Agency</strong> Management – provides for administrative support and <strong>the</strong> required tools to achieve operational and programmaticresults. This division is standard for all agencies using performance-based budgeting.Division Structure ChangeThe <strong>Office</strong> <strong>of</strong> <strong>the</strong> City Administrator is reinstating <strong>the</strong> <strong>Agency</strong> Management division in <strong>the</strong> FY 2013 proposedbudget.<strong>Office</strong> <strong>of</strong> <strong>the</strong> City AdministratorA-52FY 2013 Proposed <strong>Budget</strong> and <strong>Financial</strong> Plan
FY 2013 Proposed Operating <strong>Budget</strong> and FTEs, by Division and ActivityTable AE0-4 contains <strong>the</strong> proposed FY 2013 budget by division and activity compared to <strong>the</strong> FY 2012 approved budget.It also provides <strong>the</strong> FY 2011 actual data.Table AE0-4(dollars in thousands)Dollars in ThousandsFull-Time EquivalentsChangeChangeActual Approved Proposed from Actual Approved Proposed fromDivision/Activity FY 2011 FY 2012 FY 2013 FY 2012 FY 2011 FY 2012 FY 2013 FY 2012(1000) <strong>Agency</strong> Management Program(1090) Performance Management 142 0 364 364 1.9 0.0 1.0 1.0Subtotal (1000) <strong>Agency</strong> Management Program 142 0 364 364 1.9 0.0 1.0 1.0(2000) City Administrator(2005) Resource and Program Management Division 2,222 1,527 1,484 -43 14.9 19.0 9.0 -10.0(2010) CapStat Division 183 169 183 14 2.9 2.0 2.0 0.0(2020) Labor Relations/Collective Bargaining 16 10 0 -10 0.0 0.0 0.0 0.0Subtotal (2000) City Administrator 2,422 1,706 1,667 -39 17.8 21.0 11.0 -10.0(3000) Labor Relations and Collective Bargaining(3005) Labor Relations/Collective Bargaining 1,541 1,578 1,658 81 14.4 14.0 14.0 0.0Subtotal (3000) Labor Relations and Collective Bargaining 1,541 1,578 1,658 81 14.4 14.0 14.0 0.0Total Proposed Operating <strong>Budget</strong> 4,105 3,283 3,689 406 34.1 35.0 26.0 -9.0(Change is calculated by whole numbers and numbers may not add up due to rounding)Note: For more detailed information regarding <strong>the</strong> proposed funding for <strong>the</strong> activities within this agency’s divisions, please see Schedule 30-PBBProgram Summary by Activity in <strong>the</strong> FY 2013 Operating Appendices located on <strong>the</strong> <strong>Office</strong> <strong>of</strong> <strong>the</strong> <strong>Chief</strong> <strong>Financial</strong> <strong>Office</strong>r’s website.FY 2013 Proposed <strong>Budget</strong> ChangesThe <strong>Office</strong> <strong>of</strong> <strong>the</strong> City Administrator’s (OCA) proposed FY 2013 gross budget is $3,689,056, which represents a12.4 percent increase over its FY 2012 approved gross budget <strong>of</strong> $3,283,292. The budget is comprised <strong>of</strong>$3,401,249 in Local funds and $287,806 in Intra-District funds.Current Services Funding LevelThe Current Services Funding Level (CSFL) is a Local funds ONLY representation <strong>of</strong> <strong>the</strong> true cost <strong>of</strong> operatingDistrict agencies, before consideration <strong>of</strong> policy decisions. The CSFL reflects changes from <strong>the</strong> FY 2012 approvedbudget across multiple programs, and it estimates how much it would cost an agency to continue its current programsand operations into <strong>the</strong> following fiscal year. The initial adjustments in <strong>the</strong> budget proposal representchanges that should be compared to <strong>the</strong> FY 2013 CSFL budget and not necessarily changes made to <strong>the</strong> FY 2012Local funds budget. The FY 2013 CSFL adjustments to <strong>the</strong> FY 2012 Local funds budget are described in table 5<strong>of</strong> this agency's budget chapter. Please see <strong>the</strong> CSFL Development section within Volume 1: Executive Summaryfor more information regarding <strong>the</strong> methodology used and components that comprise <strong>the</strong> CSFL.OCA’s FY 2013 CSFL budget is $3,339,130, which represents a $55,838, or 1.7 percent, increase over <strong>the</strong> FY2012 approved Local funds budget <strong>of</strong> $3,283,292.FY 2013 Proposed <strong>Budget</strong> and <strong>Financial</strong> Plan<strong>Office</strong> <strong>of</strong> <strong>the</strong> City AdministratorA-53
Initial Adjusted <strong>Budget</strong>Cost Increase: The proposed Local funds budget reflects an increase <strong>of</strong> $950,936 in Local funds as a result <strong>of</strong>changes in salaries and Fringe Benefit costs within <strong>the</strong> agency, which include organizational changes associated with<strong>the</strong> FY 2012 reorganization <strong>of</strong> <strong>the</strong> agency. OCA also reallocated $362,555 and 1.0 FTE in Local funds to its<strong>Agency</strong> Management division from <strong>the</strong> City Administrator division to support increased salary and benefits costs.The <strong>Agency</strong> Management division was eliminated in <strong>the</strong> FY 2012 approved budget pursuant to <strong>the</strong> Fiscal Year2011 Supplemental <strong>Budget</strong> Support Act <strong>of</strong> 2010 and <strong>the</strong> agency’s subsequent reorganization, and <strong>the</strong> agency reinstated<strong>the</strong> division in FY 2013 to enhance transparency. Additionally, <strong>the</strong> agency’s Supplies and O<strong>the</strong>r Services andCharges costs increased by $49,820 to cover planned spending in <strong>the</strong> Labor Relations and Collective Bargainingdivision.Cost Decrease: The agency eliminated 8.0 FTEs totaling $573,370 in Local funds as a result <strong>of</strong> efficiencies fromOCA’s FY 2012 reorganization. OCA moved $362,555 and 1.0 FTE from <strong>the</strong> City Administrator division to <strong>the</strong><strong>Agency</strong> Management division. OCA reduced its Contractual Services budget by $82,613 in Local funds within<strong>the</strong> City Administrator program to reflect a reduction in costs for certain consulting contracts.Shift: The agency shifted a total <strong>of</strong> $294,769 and 3.0 FTEs from Local funds to Intra-District funds in <strong>the</strong> LaborRelations and Collective Bargaining division to support services provided to District agencies that require collectivebargaining assistance.Additionally Adjusted <strong>Budget</strong>Technical Adjustment: Adjustments <strong>of</strong> Fringe Benefits to restore <strong>the</strong> District Government contribution for employeehealth insurance from 72 percent, implemented in <strong>the</strong> FY 2011 budget, to 75 percent in FY 2013, resulting inincreases <strong>of</strong> $12,118 in Local funds and $678 in Intra-District funds.Policy InitiativesTo ensure that <strong>the</strong> agency complies with its mission, <strong>the</strong> OCA realigned its budget by adjusting salaries and FringeBenefits costs and creating efficiencies across its programmatic areas.Cost Increase: A net increase <strong>of</strong> $161,700 in Local funds supports <strong>the</strong> realignment <strong>of</strong> salary, Fringe Benefit andstep increases across programs and $5,760 in <strong>the</strong> City Administrator program to support modest changes in agencyfunctions. An increase <strong>of</strong> $50,000 in Local one-time funds supports a study <strong>of</strong> food services in schools.Cost Decrease: A decrease <strong>of</strong> $117,387 in Local funds reflects realignment cost savings associated with ContractualServices spending and a net cost savings <strong>of</strong> $34,302 in supplies and O<strong>the</strong>r Services and Charges adjustments alsoappear within <strong>the</strong> City Administrator program. In Intra-District funds, a decrease <strong>of</strong> $73,658 reflects adjustmentsto Salary and Fringe Benefits costs.Shift: The agency reallocated $65,685 <strong>of</strong> funding and 0.6 FTE from Local to Intra-District funds to cover a portion<strong>of</strong> a position in <strong>the</strong> Labor Relations and Collective Bargaining program.Correct: The OCA eliminated a vacant position, a reduction <strong>of</strong> 1.0 FTE.<strong>Office</strong> <strong>of</strong> <strong>the</strong> City AdministratorA-54FY 2013 Proposed <strong>Budget</strong> and <strong>Financial</strong> Plan
FY 2012 Approved <strong>Budget</strong> to FY 2013 Proposed <strong>Budget</strong>, by Revenue TypeTable AE0-5 itemizes <strong>the</strong> changes by revenue type between <strong>the</strong> FY 2012 approved budget and <strong>the</strong> FY 2013 proposedbudget.Table AE0-5(dollars in thousands)DIVISION BUDGET FTELOCAL FUNDS: FY 2012 Approved <strong>Budget</strong> and FTE 3,283 35.0Fringe Benefit Rate Adjustment Multiple Programs 35 0.0Consumer Price Index Multiple Programs 9 0.0Personal Services Growth Factor Multiple Programs 12 0.0FY 2013 Current Services Funding Level <strong>Budget</strong> (CSFL) 3,339 35.0Cost Increase: Adjustments to Supplies and O<strong>the</strong>r Labor Relations and 50 0.0Services and ChargesCollective BargainingCost Increase: Miscellaneous salary and Fringe Benefits Multiple Programs 951 0.0adjustmentsCost Increase: Aligns personal services costs with <strong>Agency</strong> Management Program 363 1.0agency's staffing needsCost Decrease: Reduction in positions City Administrator -573 -8.0Cost Decrease: Moves certain personal services costs Multiple Programs -363 -1.0to <strong>the</strong> <strong>Agency</strong> Management divisionCost Decrease: Reduction in contractual spending City Administrator -83 0.0Shift: Salary and Fringe Benefits costs to Intra-District Labor Relations and -295 -3.0Collective BargainingFY 2013 Initial Adjusted <strong>Budget</strong> 3,389 24.0Technical Adjustment: Health insurance contribution Multiple Programs 12 0.0FY 2013 Additionally Adjusted <strong>Budget</strong> 3,401 24.0FY 2013 Policy InitiativesCost Increase: Salaries and Fringe Benefits adjustments Multiple Programs 162 0.0Cost Increase: Equipment purchases City Administrator 6 0.0Cost Increase: Food services in schools study (One-Time) City Administrator 50 0.0Cost Decrease: Contractual Services savings City Administrator -117 0.0Cost Decrease: Adjustments to Supplies and O<strong>the</strong>r Services City Administrator -34 0.0and ChargesShift: Position funding to Intra-District Multiple Programs -66 -0.6Correct: Elimination <strong>of</strong> vacant position City Administrator 0 -1.0LOCAL FUND: FY 2013 Proposed <strong>Budget</strong> and FTE 3,401 22.4INTRA-DISTRICT FUNDS: FY 2012 Approved <strong>Budget</strong> and FTE 0 0.0Shift: Salary and Fringe Benefits costs from Local funds Labor Relations 295 3.0and Collective BargainingFY 2013 Initial Adjusted <strong>Budget</strong>: 295 3.0Technical Adjustment: Health insurance contribution Multiple Programs 1 0.0FY 2013 Additionally Adjusted <strong>Budget</strong>: 295 3.0FY 2013 Policy InitiativesCost Decrease: Adjustments to salaries and Fringe Benefits Multiple Programs -74 0.0Shift: Position funding from Local Multiple Programs 66 0.6INTRA-DISTRICT FUNDS: FY 2013 Proposed <strong>Budget</strong> and FTE 288 3.6Gross for AE0 - <strong>Office</strong> <strong>of</strong> <strong>the</strong> City Administrator 3,689 26.0(Change is calculated by whole numbers and numbers may not add up due to rounding)FY 2013 Proposed <strong>Budget</strong> and <strong>Financial</strong> Plan<strong>Office</strong> <strong>of</strong> <strong>the</strong> City AdministratorA-55
<strong>Agency</strong> Performance PlanThe agency’s performance plan has <strong>the</strong> following objectives for FY 2013:Objective 1: Pursue implementation <strong>of</strong> approved One City Performance Review (OCPR) Initiatives.Objective 2: Examine citywide procurement in an effort to increase efficiency and streamline processes.Objective 3: Enhance performance management across District agencies.Objective 4: Ensure progress on <strong>the</strong> new Department <strong>of</strong> General Services (DGS).<strong>Agency</strong> Performance MeasuresFY 2010 FY 2011 FY 2011 FY 2012 FY 2013 FY 2014Measure Actual Target Actual Projection Projection ProjectionPercentage <strong>of</strong> Fiscal Year agency key performance targets 21.68% 75% 46% 75% 75% 75%fully achievedPercentage <strong>of</strong> Fiscal Year agency key performance targets 83.50% 95% 60% 95% 95% 95%ei<strong>the</strong>r fully or partially achievedPercentage <strong>of</strong> Fiscal Year agency initiatives fully achieved 64.44% 75% 55.79 75% 75% 75%Percentage <strong>of</strong> Fiscal Year agency initiatives ei<strong>the</strong>r fully 86.40% 95% 73.6% 95% 95% 95%or partially achievedPercentage <strong>of</strong> Fiscal Year items assigned to agencies 0% 95% 100% 95% 95% 95%ei<strong>the</strong>r fully or partially achievedPercentage <strong>of</strong> agencies with new Industry Standard Not Not Not Not 50% 75%Benchmarks across District agencies Available Available Available Available (Baseline)Percentage <strong>of</strong> Performance Management Council Not Not Not 75% 95% 95%participated in training Available Available AvailablePercentage <strong>of</strong> District agencies completed Fiscal Year Not Not Not Not 95% 95%Performance Plan Available Available Available Available<strong>Office</strong> <strong>of</strong> <strong>the</strong> City AdministratorA-56FY 2013 Proposed <strong>Budget</strong> and <strong>Financial</strong> Plan
D.C. <strong>Office</strong> <strong>of</strong> Risk Managementwww.orm.dc.govTelephone: 202-727-8600(RK0)% ChangeFY 2011 FY 2012 FY 2013 fromDescription Actual Approved Proposed FY 2012Operating <strong>Budget</strong> $1,520,035 $2,727,602 $2,961,531 8.6FTEs 15.3 22.0 23.0 4.5The mission <strong>of</strong> <strong>the</strong> <strong>Office</strong> <strong>of</strong> Risk Management (ORM) is to reduce<strong>the</strong> probability, occurrence and cost <strong>of</strong> risk to <strong>the</strong> District <strong>of</strong> Columbiagovernment by providing risk identification and insurance analysisand support to District agencies, and by efficiently and fairly administering<strong>the</strong> District’s public sector workers’ compensation, tort liability,and captive insurance programs.Summary <strong>of</strong> ServicesORM’s Risk Identification, Analysis and Control Division conducts risk management assessments <strong>of</strong> District agencies’facilities and operations by identifying gaps in risk management practices and conducting building inspections,making related recommendations and overseeing <strong>the</strong>ir implementation, providing risk management training toDistrict employees, and overseeing <strong>the</strong> formulation <strong>of</strong> agency emergency response plans. The Public SectorWorkers’ Compensation Program (PSWCP) receives workers’ compensation claims from injured District governmentemployees, adjusts and manages those claims through its Third-Party Administrator (TPA), and providescompensation and services to claimants, including medical and return-to-work services. The Tort Liability Programreceives and investigates claims against <strong>the</strong> District government with <strong>the</strong> goal <strong>of</strong> negotiating and preparing claimsfor fair and timely settlement. The Insurance Program oversees <strong>the</strong> District’s Medical Liability Captive Insurance<strong>Agency</strong>, which provides medical malpractice insurance to non-pr<strong>of</strong>it community health centers, and also providesadvice to District agencies on risk and insurance policies and practices.The agency’s FY 2013 proposed budget is presented in <strong>the</strong> following tables:FY 2013 Proposed <strong>Budget</strong> and <strong>Financial</strong> PlanD.C. <strong>Office</strong> <strong>of</strong> Risk ManagementA-57
FY 2013 Proposed Gross Funds Operating <strong>Budget</strong>, by Revenue TypeTable RK0-1 contains <strong>the</strong> proposed FY 2013 agency budget compared to <strong>the</strong> FY 2012 approved budget. It alsoprovides FY 2010 and FY 2011 actual expenditures.Table RK0-1(dollars in thousands)ChangeActual Actual Approved Proposed from PercentAppropriated Fund FY 2010 FY 2011 FY 2012 FY 2013 FY 2012 Change*General FundLocal Funds 1,016 722 2,728 2,962 234 8.6Total for General Fund 1,016 722 2,728 2,962 234 8.6Intra-District FundsIntra-District Funds 814 798 0 0 0 -100.0Total for Intra-District Funds 814 798 0 0 0 -100.0Gross Funds 1,830 1,520 2,728 2,962 234 8.6*Percent change is based on whole dollars.Note: If applicable, for a breakdown <strong>of</strong> each Grant (Federal and Private), Special Purpose Revenue type and Intra-District agreement,please refer to Schedule 80 <strong>Agency</strong> Summary by Revenue Source in <strong>the</strong> FY 2013 Operating Appendices located on <strong>the</strong> <strong>Office</strong> <strong>of</strong> <strong>the</strong><strong>Chief</strong> <strong>Financial</strong> <strong>Office</strong>r’s website.FY 2013 Proposed Full-Time Equivalents, by Revenue TypeTable RK0-2 contains <strong>the</strong> proposed FY 2013 FTE level compared to <strong>the</strong> FY 2012 approved FTE level by revenuetype. It also provides FY 2010 and FY 2011 actual data.Table RK0-2ChangeActual Actual Approved Proposed from PercentAppropriated Fund FY 2010 FY 2011 FY 2012 FY 2013 FY 2012 ChangeGeneral FundLocal Funds 10.7 6.8 22.0 23.0 1.0 4.5Total for General Fund 10.7 6.8 22.0 23.0 1.0 4.5Intra-District FundsIntra-District Funds 11.0 8.5 0.0 0.0 0.0 N/ATotal for Intra-District Funds 11.0 8.5 0.0 0.0 0.0 N/ATotal Proposed FTEs 21.7 15.3 22.0 23.0 1.0 4.5D.C. <strong>Office</strong> <strong>of</strong> Risk ManagementA-58FY 2013 Proposed <strong>Budget</strong> and <strong>Financial</strong> Plan
FY 2013 Proposed Operating <strong>Budget</strong>, by Comptroller Source GroupTable RK0-3 contains <strong>the</strong> proposed FY 2013 budget at <strong>the</strong> Comptroller Source Group (object class) level comparedto <strong>the</strong> FY 2012 approved budget. It also provides FY 2010 and FY 2011 actual expenditures.Table RK0-3(dollars in thousands)ChangeActual Actual Approved Proposed from PercentComptroller Source Group FY 2010 FY 2011 FY 2012 FY 2013 FY 2012 Change*11 - Regular Pay - Continuing Full Time 954 913 1,364 1,433 69 5.012 - Regular Pay - O<strong>the</strong>r 414 275 408 324 -85 -20.813 - Additional Gross Pay 10 53 0 0 0 N/A14 - Fringe Benefits - Current Personnel 266 245 345 372 27 7.815 - Overtime Pay 2 0 0 0 0 N/ASubtotal Personal Services (PS) 1,646 1,486 2,118 2,129 11 0.520 - Supplies and Materials 9 7 17 17 0 0.030 - Energy, Comm. and Building Rentals 46 0 0 0 0 N/A31 - Telephone, Telegraph, Telegram, Etc. 27 0 0 0 0 N/A33 - Janitorial Services 24 0 0 0 0 N/A34 - Security Services 12 0 0 0 0 N/A35 - Occupancy Fixed Costs 30 0 0 0 0 N/A40 - O<strong>the</strong>r Services and Charges 36 27 593 806 213 35.970 - Equipment and Equipment Rental 0 0 0 10 10 N/ASubtotal Nonpersonal Services (NPS) 184 34 610 833 223 36.6Gross Funds 1,830 1,520 2,728 2,962 234 8.6*Percent change is based on whole dollars.Division DescriptionThe <strong>Office</strong> <strong>of</strong> Risk Management operates through <strong>the</strong> following 5 divisions:Risk Identification and Analysis (RIA) – integrates <strong>the</strong> work <strong>of</strong> agency risk management representatives who systematicallyidentify, measure, analyze and document <strong>the</strong> District Government’s exposure to risk. The risk controlmeasures are implemented to reduce <strong>the</strong> District’s liability associated with <strong>the</strong> risk.This division contains <strong>the</strong> following 2 activities:■ Coordination and Integrity <strong>of</strong> ARMRs – coordinates <strong>the</strong> work <strong>of</strong> <strong>the</strong> <strong>Agency</strong> Risk ManagementRepresentatives (ARMRs), including systematic identification, measurement, analysis, and documentation <strong>of</strong>agency exposure to risk; and■ Review and Guide Risk Assessment Control Committees (RACC) – reviews and guides agency RACC activitiesrelative to risk management plans. The purpose <strong>of</strong> <strong>the</strong> RACC is to maintain, in cooperation with ORM,a proactive and comprehensive program <strong>of</strong> risk assessment and control for agencies that minimize <strong>the</strong> frequency,severity, and probability <strong>of</strong> losses to which agencies are exposed.FY 2013 Proposed <strong>Budget</strong> and <strong>Financial</strong> PlanD.C. <strong>Office</strong> <strong>of</strong> Risk ManagementA-59
Risk Control Division – effectively minimizes <strong>the</strong> probability, frequency, and severity <strong>of</strong> pre- and post-loss accidentallosses through a compliance-monitoring program <strong>of</strong> safety, security, and contingency planning <strong>of</strong> emergenciesaffecting District agencies. Also provides training to increase <strong>the</strong> participant's knowledge <strong>of</strong> emergency planningand <strong>the</strong> features <strong>of</strong> good evacuation floor plans, to include guidance on how to incorporate <strong>the</strong> threat <strong>of</strong> terrorism(for example, intentional releases <strong>of</strong> hazardous materials, use <strong>of</strong> explosive devices, or acts <strong>of</strong> arson) into evacuationplanning and preparedness.Risk Financing Division – manages <strong>the</strong> adjudication <strong>of</strong> claims and recoveries, and anticipates and plans for fundingloss payments.This division contains <strong>the</strong> following 2 activities:■ Claims Examination – reviews and manages Public Sector Workers’ Compensation claims filed against <strong>the</strong>District government and <strong>the</strong> adjudication <strong>of</strong> tort liability claims and recoveries, and anticipates and plans forfunding loss payments; and■ Claims Management – provides <strong>the</strong> District government’s oversight <strong>of</strong> <strong>the</strong> claims administration process bythird-party administrators.Return to Work Division – The Return to Work Program will decrease workers’ compensation costs by improvingmanagement <strong>of</strong> <strong>the</strong> program and returning injured workers to <strong>the</strong> workforce. The program is designed to provideinjured employees with <strong>the</strong> best medical treatment as well as avenues by which <strong>the</strong> employees can quicklyreturn to <strong>the</strong> workforce. The District will benefit from <strong>the</strong> program by minimizing <strong>the</strong> cost <strong>of</strong> workers’ compensationand providing agencies with a stronger workforce.<strong>Agency</strong> Management – provides for administrative support and <strong>the</strong> required tools to achieve operational and programmaticresults. This division is standard for all agencies using performance-based budgeting.Division Structure ChangeThe <strong>Office</strong> <strong>of</strong> Risk Management has no division structure changes in <strong>the</strong> FY 2013 proposed budget.D.C. <strong>Office</strong> <strong>of</strong> Risk ManagementA-60FY 2013 Proposed <strong>Budget</strong> and <strong>Financial</strong> Plan
FY 2013 Proposed Operating <strong>Budget</strong> and FTEs, by Division and ActivityTable RK0-4 contains <strong>the</strong> proposed FY 2013 budget by division and activity compared to <strong>the</strong> FY 2012 approved budget.It also provides <strong>the</strong> FY 2011 actual data.Table RK0-4(dollars in thousands)Dollars in ThousandsFull-Time EquivalentsChangeChangeActual Approved Proposed from Actual Approved Proposed fromDivision/Activity FY 2011 FY 2012 FY 2013 FY 2012 FY 2011 FY 2012 FY 2013 FY 2012(1000) <strong>Agency</strong> Management Program(1010) Personnel 49 92 47 -45 0.4 1.0 0.5 -0.5(1030) Property Management -3 0 0 0 0.0 0.0 0.0 0.0(1055) Risk Management 16 4 127 122 0.0 0.0 0.0 0.0(1085) Customer Service 58 116 60 -56 0.9 2.0 1.0 -1.0(1090) Performance Management 301 315 369 55 1.6 2.0 2.8 0.8Subtotal (1000) <strong>Agency</strong> Management Program 421 527 603 76 2.9 5.0 4.3 -0.7(2000) Risk Identification and Analysis(2010) Coordination and Integ. <strong>of</strong> ARMRS 151 184 270 86 1.6 2.0 2.8 0.8(2030) Review and Guide RA Control Commitee 72 69 73 3 0.9 1.0 1.0 0.0(Subtotal (2000) Risk Identification and Analysis 223 253 343 89 2.4 3.0 3.8 0.8(3000) Risk Control Division(3010) Safety, Security Emergency Planning 115 122 124 2 0.9 1.0 1.0 0.0Subtotal (3000) Risk Control Division 115 122 124 2 0.9 1.0 1.0 0.0(4000) Risk Financing Division(4010) Claims Examination 683 695 886 190 6.8 8.0 10.5 2.5(4040) Claims Management 77 247 155 -92 2.3 2.0 1.4 -0.6Subtotal (4000) Risk Financing Division 760 942 1,041 98 9.0 10.0 12.0 2.0(6000) Return to Work Program(6010) Return to Work 0 883 851 -32 0.0 3.0 2.0 -1.0Subtotal (6000) Return to Work Program 0 883 851 -32 0.0 3.0 2.0 -1.0Total Proposed Operating <strong>Budget</strong> 1,520 2,728 2,962 234 15.3 22.0 23.0 1.0(Change is calculated by whole numbers and numbers may not add up due to rounding)Note: For more detailed information regarding <strong>the</strong> proposed funding for <strong>the</strong> activities within this agency’s divisions, please see Schedule 30-PBBProgram Summary By Activity in <strong>the</strong> FY 2013 Operating Appendices located on <strong>the</strong> <strong>Office</strong> <strong>of</strong> <strong>the</strong> <strong>Chief</strong> <strong>Financial</strong> <strong>Office</strong>r’s website.FY 2013 Proposed <strong>Budget</strong> and <strong>Financial</strong> PlanD.C. <strong>Office</strong> <strong>of</strong> Risk ManagementA-61
FY 2013 Proposed <strong>Budget</strong> ChangesThe <strong>Office</strong> <strong>of</strong> Risk Management’s (ORM) proposed FY 2013 gross budget is $2,961,531, which represents an 8.6percent increase over its FY 2012 approved gross budget <strong>of</strong> $2,727,602. The budget is comprised entirely <strong>of</strong> Localfunds.Current Services Funding LevelThe Current Services Funding Level (CSFL) is a Local funds ONLY representation <strong>of</strong> <strong>the</strong> true cost <strong>of</strong> operatingDistrict agencies, before consideration <strong>of</strong> policy decisions. The CSFL reflects changes from <strong>the</strong> FY 2012 approvedbudget across multiple programs, and it estimates how much it would cost an agency to continue its current programsand operations into <strong>the</strong> following fiscal year. The initial adjustments in <strong>the</strong> budget proposal representchanges that should be compared to <strong>the</strong> FY 2013 CSFL budget and not necessarily changes made to <strong>the</strong> FY 2012Local funds budget. The FY 2013 CSFL adjustments to <strong>the</strong> FY 2012 Local funds budget are described in table 5<strong>of</strong> this agency's budget chapter. Please see <strong>the</strong> CSFL Development section within Volume 1: Executive Summaryfor more information regarding <strong>the</strong> methodology used and components that comprise <strong>the</strong> CSFL.ORM’s FY 2013 CSFL budget is $2,772,817, which represents a $45,215, or 1.7 percent, increase over <strong>the</strong> FY2012 approved Local funds budget <strong>of</strong> $2,727,602.Initial Adjusted <strong>Budget</strong>The budget proposal enables <strong>the</strong> agency to continue to maximize support to District agencies and efficiently andfairly administers <strong>the</strong> District’s public sector workers’ compensation and tort liability programs.Cost Increase: The budget proposal includes increases <strong>of</strong> $22,215 <strong>of</strong> Local funds to adjust <strong>the</strong> budget for Suppliesand Materials and Equipment and Equipment Rental, and $111,889 for O<strong>the</strong>r Services and Charges to align withhistorical spending.Cost Decrease: The agency reduced $110,767 <strong>of</strong> Local funds to align <strong>the</strong> budget with personal services cost projections,and $23,337 to align <strong>the</strong> budget with cost projections for Supplies and Materials and O<strong>the</strong>r Services andCharges.Additionally Adjusted <strong>Budget</strong>Technical Adjustment: Adjustments <strong>of</strong> Fringe Benefits to restore <strong>the</strong> District Government contribution for employeehealth insurance from 72 percent, implemented in <strong>the</strong> FY 2011 budget, to 75 percent in FY 2013, resulting inan increase <strong>of</strong> $7,714 in Local funds.Policy InitiativesTechnical Adjustment: Adjustment to nonpersonal services to support <strong>the</strong> Memorandum <strong>of</strong> Understanding(MOU) with <strong>the</strong> <strong>Office</strong> <strong>of</strong> <strong>the</strong> Attorney General to provide legal services in administering <strong>the</strong> Public SectorWorkers’ Compensation Program, resulting in an increase <strong>of</strong> $100,000 in Local funds.Cost Increase: Local funds were increased by $81,000 to provide funding for 1.0 new FTE to support settling tortclaims, as well as pursuing subrogation claims against third parties who have committed negligent acts against <strong>the</strong>District <strong>of</strong> Columbia, its property, or its employees.D.C. <strong>Office</strong> <strong>of</strong> Risk ManagementA-62FY 2013 Proposed <strong>Budget</strong> and <strong>Financial</strong> Plan
FY 2012 Approved <strong>Budget</strong> to FY 2013 Proposed <strong>Budget</strong>, by Revenue TypeTable RK0-5 itemizes <strong>the</strong> changes by revenue type between <strong>the</strong> FY 2012 approved budget and <strong>the</strong> FY 2013 proposedbudget.Table RK0-5(dollars in thousands)PROGRAM BUDGET FTELOCAL FUNDS: FY 2012 Approved <strong>Budget</strong> and FTE 2,728 22.0Fringe Benefit Rate Adjustment Multiple Programs 24 0.0Consumer Price Index Multiple Programs 12 0.0Personal Services Growth Factor Multiple Programs 9 0.0FY 2013 Current Services Funding Level <strong>Budget</strong> (CSFL) 2,773 22.0Cost Increase: Adjust <strong>the</strong> budget for Supplies and Materials and <strong>Agency</strong> Management Program 22 0.0Equipment and Equipment RentalCost Increase: Adjust <strong>the</strong> budget for O<strong>the</strong>r Services and Charges Return To Work Program 112 0.0Cost Decrease: Align <strong>the</strong> budget with personal services Multiple Programs -111 0.0cost projectionsCost Decrease: Align <strong>the</strong> budget with cost projections Multiple Programs -23 0.0for Supplies and Materials and O<strong>the</strong>r Services and ChargesFY 2013 Initial Adjusted <strong>Budget</strong> 2,773 22.0Technical Adjustment: Health insurance contribution Multiple Programs 8 0.0FY 2013 Additionally Adjusted <strong>Budget</strong> 2,781 22.0FY 2013 Policy InitiativesTechnical Adjustment: To support <strong>the</strong> Memorandum <strong>of</strong> Understanding (MOU) <strong>Agency</strong> Management Program 100 0.0with <strong>the</strong> <strong>Office</strong> <strong>of</strong> <strong>the</strong> Attorney General in administering <strong>the</strong> Public SectorWorkers’ Compensation ProgramCost Increase: To provide funding for a new FTE for a claims adjustor Risk Financing Division 81 1.0position to support settling tort claimsLOCAL FUNDS: FY 2013 Proposed <strong>Budget</strong> and FTE 2,962 23.0Gross for RK0 - D. C. <strong>Office</strong> <strong>of</strong> Risk Management 2,962 23.0(Change is calculated by whole numbers and numbers may not add up due to rounding)FY 2013 Proposed <strong>Budget</strong> and <strong>Financial</strong> PlanD.C. <strong>Office</strong> <strong>of</strong> Risk ManagementA-63
<strong>Agency</strong> Performance PlanThe agency’s performance plan has <strong>the</strong> following objectives for FY 2013:Objective 1: Reduce <strong>the</strong> level and cost <strong>of</strong> risk to <strong>the</strong> District government by increasing occupational safety.Objective 2: Improve <strong>the</strong> management and efficiency <strong>of</strong> <strong>the</strong> Public Sector Workers’ Compensation Program.Objective 3: Reduce <strong>the</strong> number <strong>of</strong> lawsuits against <strong>the</strong> District government.Objective 4: Recover money owed to <strong>the</strong> District as a result <strong>of</strong> tortuous acts by third parties.Objective 5: Increase contractual risk management and awareness <strong>of</strong> District agencies.Objective 6: Ensure District residents’ access to affordable health care and wellness education.<strong>Agency</strong> Performance MeasuresFY 2010 FY 2011 FY 2011 FY 2012 FY 2013 FY 2014Measure Actual Target Actual Projection Projection ProjectionPercentage <strong>of</strong> District Government vendors incompliance with ORM minimum insurance Not Notrequirements 1 Available 100% Available 100% 100% 100%Number <strong>of</strong> environmental and safety 508;inspections/re-inspections at District 82;Government buildings 586 615 619 615 615 615Reduce <strong>the</strong> number <strong>of</strong> “How Am I Driving?” 311complaint calls (percent decrease and number <strong>of</strong> -17% -15% -1% -15% -15% -15%complaints) (991) (842) 2 (981) (834) (709) (603)Total Cost <strong>of</strong> Public Sector Workers’ CompensationProgram (<strong>the</strong>se amounts include settlements andadverse awards against PSWCP) $24.8M $21.5M $22.1M $17M $17M $17MAverage number <strong>of</strong> days an FY 2012 claimant Not Notreceives workers’ compensation benefits 3 Available Available 54.14 51.44 48.87 46.43Overall average number <strong>of</strong> days <strong>of</strong>f work 4 Not NotAvailable Available 1,778 1,689 1,520 1,368Average cost per injury per claim per year $11,566 $10,741 $10,490.88 $9,966.34 $9,468.03 $8,994.63Number <strong>of</strong> employees participating in <strong>the</strong>return-to-work and/or District wide Not NotIntranet alternative work job depository Available Available 557 529 505 483Tort claims received to closed ratio 61% 70% 103% 100% 100% 100%D.C. <strong>Office</strong> <strong>of</strong> Risk ManagementA-64FY 2013 Proposed <strong>Budget</strong> and <strong>Financial</strong> Plan
Performance Plan Endnotes:1. ORM started reviewing vendor insurance information in FY 2010, however, complete records <strong>of</strong> <strong>the</strong> total percentage <strong>of</strong> vendors incompliance are not available because it is not known what percentage <strong>of</strong> contracts were submitted by <strong>the</strong> <strong>Office</strong> <strong>of</strong> Contractingand Procurement (OCP) to ORM for review. As <strong>of</strong> <strong>the</strong> end <strong>of</strong> FY 2011, OCP has incorporated ORM’s review system into <strong>the</strong>Procurement Automated Support System (PASS) to ensure that ORM is sent 100 percent <strong>of</strong> eligible contracts to review for compliance.2. This represents a 15 percent reduction from <strong>the</strong> FY 2010 total number <strong>of</strong> calls (973). The FY 2012 target is a 15 percent reductionfrom <strong>the</strong> FY 2011 target; <strong>the</strong> FY 2013 target is a 15 percent reduction from <strong>the</strong> FY 2012 target; and <strong>the</strong> FY 2014 target is a 15 percentreduction from <strong>the</strong> FY 2013 target.3. This number measures <strong>the</strong> average number <strong>of</strong> days a workers’ compensation claimant whose claim was accepted within <strong>the</strong>noted fiscal year was not working and was receiving temporary total disability (TTD) payments.4. This is a new measure added for FY 2012. The number measures <strong>the</strong> average number <strong>of</strong> days <strong>of</strong>f work for <strong>the</strong> entire claimantpopulation beginning from <strong>the</strong> onset <strong>of</strong> <strong>the</strong> claim until <strong>the</strong> present. No reliable data is available for previous fiscal years.5. This measure was previously reported as <strong>the</strong> percentage <strong>of</strong> agencies participating in <strong>the</strong> Return to Work program. In FY 2012, itwill be reported as a whole number to represent <strong>the</strong> number <strong>of</strong> employees returning to work.FY 2013 Proposed <strong>Budget</strong> and <strong>Financial</strong> PlanD.C. <strong>Office</strong> <strong>of</strong> Risk ManagementA-65
(BE0)D.C. Department <strong>of</strong> Human Resourceswww.dcop.dc.govTelephone: 202-442-9700% ChangeFY 2011 FY 2012 FY 2013 fromDescription Actual Approved Proposed FY 2012Operating <strong>Budget</strong> $11,907,490 $9,871,867 $10,318,724 4.5FTEs 102.6 101.4 102.4 1.0The mission <strong>of</strong> <strong>the</strong> D.C. Department <strong>of</strong> Human Resources (DCHR)is to streng<strong>the</strong>n individual and organizational performance and enable<strong>the</strong> District government to attract, develop, and retain a highly qualified,diverse workforce.Summary <strong>of</strong> ServicesDCHR <strong>of</strong>fers executive management to District government <strong>of</strong>ficials and/or agencies by providing personnelrelatedservices to help each agency meet daily mission mandates. Specific services provided include positionclassification and recruitment services, <strong>the</strong> interpretation <strong>of</strong> personnel-related policy, as well as oversight control(such as <strong>the</strong> adherence to regulatory requirements) for effective recruitment and staffing, strategic and financialrestructuring through realignment assistance, and resource management. In addition, <strong>the</strong> agency provides D.C.government employees with a variety <strong>of</strong> services, including employee benefits and compensation guidance,performance management, compliance, audit assessments, legal guidance on personnel matters, andtraining/development.The agency’s FY 2013 proposed budget is presented in <strong>the</strong> following tables:FY 2013 Proposed <strong>Budget</strong> and <strong>Financial</strong> PlanD.C. Department <strong>of</strong> Human ResourcesA-67
FY 2013 Proposed Gross Funds Operating <strong>Budget</strong>, by Revenue TypeTable BE0-1 contains <strong>the</strong> proposed FY 2013 agency budget compared to <strong>the</strong> FY 2012 approved budget. It alsoprovides FY 2010 and FY 2011 actual expenditures.Table BE0-1(dollars in thousands)ChangeActual Actual Approved Proposed from PercentAppropriated Fund FY 2010 FY 2011 FY 2012 FY 2013 FY 2012 Change*General FundLocal Funds 5,136 8,135 7,270 7,536 266 3.7Special Purpose Revenue Funds 277 186 277 278 1 0.3Total for General Fund 5,414 8,321 7,547 7,814 267 3.5Intra-District FundsIntra-District Funds 7,858 3,587 2,325 2,505 180 7.7Total for Intra-District Funds 7,858 3,587 2,325 2,505 180 7.7Gross Funds 13,271 11,907 9,872 10,319 447 4.5*Percent change is based on whole dollars.Note: If applicable, for a breakdown <strong>of</strong> each Grant (Federal and Private), Special Purpose Revenue type and Intra-District agreement,please refer to Schedule 80 <strong>Agency</strong> Summary by Revenue Source in <strong>the</strong> FY 2013 Operating Appendices located on <strong>the</strong> <strong>Office</strong> <strong>of</strong> <strong>the</strong><strong>Chief</strong> <strong>Financial</strong> <strong>Office</strong>r’s website.FY 2013 Proposed Full-Time Equivalents, by Revenue TypeTable BE0-2 contains <strong>the</strong> proposed FY 2013 FTE level compared to <strong>the</strong> FY 2012 approved FTE level by revenuetype. It also provides FY 2010 and FY 2011 actual data.Table BE0-2ChangeActual Actual Approved Proposed from PercentAppropriated Fund FY 2010 FY 2011 FY 2012 FY 2013 FY 2012 ChangeGeneral FundLocal Funds 58.3 86.1 82.6 79.0 -3.6 -4.3Special Purpose Revenue Funds 3.6 1.2 3.8 3.7 -0.2 -3.9Total for General Fund 61.8 87.3 86.4 82.7 -3.7 -4.3Intra-District FundsIntra-District Funds 60.7 15.4 15.0 19.7 4.7 31.6Total for Intra-District Funds 60.7 15.4 15.0 19.7 4.7 31.6Total Proposed FTEs 122.6 102.6 101.4 102.4 1.0 1.0D.C. Department <strong>of</strong> Human ResourcesA-68FY 2013 Proposed <strong>Budget</strong> and <strong>Financial</strong> Plan
FY 2013 Proposed Operating <strong>Budget</strong>, by Comptroller Source GroupTable BE0-3 contains <strong>the</strong> proposed FY 2013 budget at <strong>the</strong> Comptroller Source Group (object class) level comparedto <strong>the</strong> FY 2012 approved budget. It also provides FY 2010 and FY 2011 actual expenditures.Table BE0-3(dollars in thousands)ChangeActual Actual Approved Proposed from PercentComptroller Source Group FY 2010 FY 2011 FY 2012 FY 2013 FY 2012 Change*11 - Regular Pay - Continuing Full Time 6,459 6,011 6,446 6,317 -129 -2.012 - Regular Pay - O<strong>the</strong>r 1,514 1,189 456 840 385 84.513 - Additional Gross Pay 47 262 0 0 0 N/A14 - Fringe Benefits - Current Personnel 1,519 1,145 1,473 1,657 184 12.515 - Overtime Pay 67 2 0 0 0 N/ASubtotal Personal Services (PS) 9,606 8,609 8,374 8,814 440 5.320 - Supplies and Materials 69 43 39 39 0 0.830 - Energy, Comm. and Building Rentals 284 0 0 0 0 N/A31 - Telephone, Telegraph, Telegram, Etc. 91 4 0 0 0 N/A33 - Janitorial Services 126 0 0 0 0 N/A34 - Security Services 87 0 0 0 0 N/A35 - Occupancy Fixed Costs 148 0 0 0 0 N/A40 - O<strong>the</strong>r Services and Charges 560 209 38 35 -3 -6.941 - Contractual Services - O<strong>the</strong>r 2,300 3,031 1,411 1,417 6 0.470 - Equipment and Equipment Rental 0 11 11 14 3 29.4Subtotal Nonpersonal Services (NPS) 3,665 3,298 1,498 1,505 7 0.5Gross Funds 13,271 11,907 9,872 10,319 447 4.5*Percent change is based on whole dollars.FY 2013 Proposed <strong>Budget</strong> and <strong>Financial</strong> PlanD.C. Department <strong>of</strong> Human ResourcesA-69
Division DescriptionThe D.C. Department <strong>of</strong> Human Resources operates through <strong>the</strong> following 7 divisions:Compensation and Classification – provides position management, classification and compensation support servicesto District government agencies. Establishes <strong>of</strong>ficial classifications and descriptions, designs and implementspay schedules, and develops classification/compensation policies, procedures and regulations. Provides expert adviceto District government management in <strong>the</strong> areas <strong>of</strong> classification, compensation, administration <strong>of</strong> pay schedules,merit pay, compensation and classification policies, FLSA, and recruitment/retention issues.Recruitment and Staffing Administration – provides recruitment, selection, and placement services to client agenciesand oversight controls for effective recruitment and staffing, employee relations, and auditing <strong>of</strong> subordinateagencies delegated recruitment.Benefits and Retirement Services – provides benefits services for <strong>the</strong> approximate 32,000 benefit-eligible employeesand retirees to streng<strong>the</strong>n <strong>the</strong> individuals and organizational performance across <strong>the</strong> District. This includes planmanagement, contracting, and communication <strong>of</strong> all health, voluntary and retirement programs. Ano<strong>the</strong>r functionis <strong>the</strong> oversight and support <strong>of</strong> <strong>the</strong> Police and Firefighters Retirement Relief Board (PFRRB). The PFRRB hearsand rules on optional, disability and survivor cases pertaining to sworn personnel <strong>of</strong> <strong>the</strong> Metropolitan PoliceDepartment, Fire and Emergency Medical Services Department, U.S. Park Police, and U.S. Secret Service.Workforce Development Administration – provides training and development programs to District employees inorder to attract, develop, and retain a highly qualified, diverse workforce. Administers a comprehensive set <strong>of</strong> programsto develop District leadership through <strong>the</strong> Certified Public Manager program; Capital City Fellows program;Centralized College Internship Program; and High School Intern Program.This division contains <strong>the</strong> following 3 activities:■ Training and Development – provides training, a pr<strong>of</strong>essional forum for implementing consortiums and programsthat increase knowledge, skills, and competencies <strong>of</strong> District government employees;■ Capital City Fellows – provides central oversight for this two-year training program for recent graduates <strong>of</strong> master’sdegree programs in public administration, public policy, urban planning, and related fields while workingfor <strong>the</strong> District government; and■ Special Programs – provides central management <strong>of</strong> special programs designed to attract and recruit emergingleaders for <strong>the</strong> District government, and to make working in <strong>the</strong> District government a long-term career choice.Ranging in duration 6 weeks to 20 weeks, <strong>the</strong>se programs promote leadership and competency developmentfor local high school, undergraduate, and graduate students who want hands-on public policy municipal governmentexperience. By extending outreach to <strong>the</strong> next generation <strong>of</strong> District employees, DCHR is responsiveto city government challenges and proactive at arriving at modern solutions.Compliance and Legal Administration – ensures that agencies comply with human resources laws, regulations,policies and procedures. Conducts criminal background investigations and drug and alcohol testing, and administers/enforces<strong>the</strong> District Residency Preference regulations for employment programs and <strong>the</strong> DomicileRequirement for District government employees, applicants and volunteers. Responsible for managing <strong>the</strong> HRcontrol environment by identifying changes to applicable personnel laws, regulations and policies. Delivers training,continuing education and pr<strong>of</strong>essional development programs and learning opportunities intended to enhance<strong>the</strong> knowledge, skills, and competencies <strong>of</strong> District government employees and residents alike.This division contains <strong>the</strong> following 4 activities:■ Legal – provides legal assistance to DCHR and subordinate agencies to ensure that <strong>the</strong> District governmentattracts, develops, and retains a well-qualified, diverse workforce in compliance with <strong>the</strong> Comprehensive MeritD.C. Department <strong>of</strong> Human ResourcesA-70FY 2013 Proposed <strong>Budget</strong> and <strong>Financial</strong> Plan
Personnel Act and o<strong>the</strong>r relevant District and federal laws, rules, and regulations. It also provides legal advice to <strong>the</strong>Director and agency management on a variety <strong>of</strong> complex legal issues in order to accomplish DCHR’s mission,provides legal advice and guidance to both subordinate and independent agencies within <strong>the</strong> District governmentregarding matters involving personnel and employment law, and provides litigation support to <strong>the</strong> <strong>Office</strong> <strong>of</strong> <strong>the</strong>Attorney General in a variety <strong>of</strong> pending legal matters;■ Compliance – conducts criminal background investigations <strong>of</strong> District government employees, applicants andvolunteers. Provides drug and alcohol testing services for specified employees and applicants. The unit administersand enforces <strong>the</strong> District Residency Preference regulations for employment programs and <strong>the</strong> DomicileRequirement. It also investigates complaints <strong>of</strong> violations <strong>of</strong> <strong>the</strong> District Personnel regulations and make recommendationsfor corrective action;■ Police & Fire Retirement Relief Board – provides oversight and support for <strong>the</strong> Police and FirefightersRetirement Relief Board (PFRRB). The PFRRB hears and rules on optional, disability and survivor cases pertainingto sworn personnel <strong>of</strong> <strong>the</strong> Metropolitan Police Department, Fire and Emergency Medical Services Department,U.S. Park Police, and U.S. Secret Service; and■ Policy – provides policy development and consultation services.Business Operation Group – provides operational support to <strong>the</strong> agency’s core HR functional service groups.More specifically, <strong>the</strong> group performs <strong>the</strong> following routine activities: (1) performs risk-based financial and operationalperformance audits and reviews <strong>of</strong> existing laws, regulations and policies; (2) conducts design and operationaleffectiveness reviews <strong>of</strong> existing business processes and functional Information Technology control activities; (3)designs and documents existing and new processes that are intended to drive process improvements; (4) providesmonitoring and oversight over <strong>the</strong> end-to-end human resources lifecycle <strong>of</strong> activities, and provides performancemanagement reports and updates; (5) serves as <strong>the</strong> agency’s fiduciary custodians responsible for properly safeguarding<strong>the</strong> District’s records management portfolio <strong>of</strong> Official Personnel Files (OPFs) and o<strong>the</strong>r personally identifiableinformation; and (6) provides senior management with comprehensive measurements, analysis and planningsupport to effectively manage <strong>the</strong> agency’s resources (resource allocation and planning), facilities (i.e.,Employee ID and Credentialing Services, Fleet Management, Facilities Operations) and financial obligations (i.e.,P-Card, Direct Vouchers, Contracts and Procurements, Petty Cash, MOUs).This division contains <strong>the</strong> following 2 activities:■ Measurement, Analysis and Planning – provides risk-based financial and operational performanceaudits and reviews <strong>of</strong> existing laws, regulations and policies; conducts design and operational effectivenessreviews <strong>of</strong> existing business processes and functional Information Technology control activities;designs and documents <strong>of</strong> existing and new processes that are intended to drive process improvements;provides monitoring and oversight over <strong>the</strong> end-to-end human resources lifecycle <strong>of</strong> activities; and providesperformance management reports and updates; and■ Resource Management Group - serves as <strong>the</strong> agency’s fiduciary custodians responsible for properlysafeguarding <strong>the</strong> District’s records management portfolio <strong>of</strong> OPFs and o<strong>the</strong>r personally identifiableinformation; and provides senior management with comprehensive measurements, analysis and planningsupport to effectively manage <strong>the</strong> agency’s resources, facilities (i.e., Employee ID andCredentialing Services, Fleet Management, Facilities Operations) and financial obligations (i.e., P-Card, Direct Vouchers, Contracts and Procurements, Petty Cash, MOUs).<strong>Agency</strong> Management - provides for administrative support and <strong>the</strong> required tools to achieve operationaland programmatic results. This division is standard for all agencies using performance-based budgeting.Division Structure ChangeThe D.C. Department <strong>of</strong> Human Resources added a new division, <strong>the</strong> Business Operations Group, in<strong>the</strong> FY 2013 proposed budget.FY 2013 Proposed <strong>Budget</strong> and <strong>Financial</strong> PlanD.C. Department <strong>of</strong> Human ResourcesA-71
FY 2013 Proposed Operating <strong>Budget</strong> and FTEs, by Division and ActivityTable BE0-4 contains <strong>the</strong> proposed FY 2013 budget by division and activity compared to <strong>the</strong> FY 2012 approvedbudget. It also provides <strong>the</strong> FY 2011 actual data.Table BE0-4(dollars in thousands)Dollars in ThousandsFull-Time EquivalentsChangeChangeActual Approved Proposed from Actual Approved Proposed fromDivision/Activity FY 2011 FY 2012 FY 2013 FY 2012 FY 2011 FY 2012 FY 2013 FY 2012(1000) <strong>Agency</strong> Management Program(1010) Personnel 804 823 1,007 184 6.7 7.0 8.0 1.0(1020) Contracting and Procurement 0 0 0 0 0.0 0.0 0.0 0.0(1030) Property Management 2 2 3 0 0.0 0.0 0.0 0.0(1040) Human Resources Information Systems 656 523 602 79 4.8 0.0 7.0 7.0(1040) Information Technology 0 0 0 0 0.0 5.0 0.0 -5.0(1080) Communications -2 0 112 112 0.0 0.0 1.0 1.0(1085) Customer Service 625 728 252 -476 10.6 11.0 5.0 -6.0Subtotal (1000) <strong>Agency</strong> Management Program 2,086 2,075 1,974 -101 22.2 23.0 21.0 -2.0(2000) Policy and Staffing Administration(2010) Policy 0 0 0 0 0.0 5.0 0.0 -5.0(2030) Recruiting and Staffing 0 0 0 0 0.0 12.0 0.0 -12.0(2050) Audit 0 0 0 0 0.0 2.0 0.0 -2.0Subtotal (2000) Policy and Staffing Administration 0 0 0 0 0.0 19.0 0.0 -19.0(2000) Recruitment and Staffing Administration(2010) Recruiting and Staffing 487 489 670 181 4.8 0.0 8.0 8.0(2030) Recruiting and Staffing 964 933 0 -933 12.5 0.0 0.0 0.0(2050) Audit 158 174 0 -174 1.9 0.0 0.0 0.0Subtotal (2000) Recruitment and Staffing Administration 1,609 1,595 670 -925 19.2 0.0 8.0 8.0(2100) Compliance and Legal Administration(2120) Legal 187 214 123 -90 2.0 2.0 1.0 -1.0(2130) Compliance 769 823 476 -347 5.8 6.0 6.0 0.0(2140) Police and Fire Retirement Relief Board 0 0 240 240 0.0 0.0 3.3 3.3(2150) Policy 0 0 431 431 0.0 0.0 4.0 4.0Subtotal (2100) Compliance and Legal Administration 956 1,037 1,271 234 7.8 8.0 14.3 6.3(2200) Benefits and Retirement Services(2210) Benefits Operation Unit 3,377 2,474 1,165 -1,309 18.8 20.4 15.1 -5.3Subtotal (2200) Benefits and Retirement Services 3,377 2,474 1,165 -1,309 18.8 20.4 15.1 -5.3(2600) Compensation and Classification(2610) Compensation 205 197 1,060 863 1.9 2.0 10.0 8.0(2620) Classification 1,417 898 0 -898 8.7 9.0 0.0 -9.0(2630) Performance Management 0 7 0 -7 0.0 0.0 0.0 0.0Subtotal (2600) Compensation and Classification 1,622 1,103 1,060 -42 10.6 11.0 10.0 -1.0(Continued on next page)D.C. Department <strong>of</strong> Human ResourcesA-72FY 2013 Proposed <strong>Budget</strong> and <strong>Financial</strong> Plan
Table BE0-4 (Continued)(dollars in thousands)Dollars in ThousandsFull-Time EquivalentsChangeChangeActual Approved Proposed from Actual Approved Proposed fromDivision/Activity FY 2011 FY 2012 FY 2013 FY 2012 FY 2011 FY 2012 FY 2013 FY 2012(3000) Workforce Development Administration(3100) Training and Development 1,362 981 614 -367 9.6 10.0 6.0 -4.0(3200) Capital City Fellows 758 607 641 34 14.4 10.0 10.0 0.0(3300) Special Programs 137 0 288 288 0.0 0.0 3.0 3.0Subtotal (3000) Workforce Development Administration 2,257 1,588 1,543 -45 24.0 20.0 19.0 -1.0(4000) Business Operations Group(4100) Measurement, Analysis and Planning 0 0 772 772 0.0 0.0 10.0 10.0(4200) Resource Management Group 0 0 1,863 1,863 0.0 0.0 5.0 5.0Subtotal (4000) Business Operations Group 0 0 2,635 2,635 0.0 0.0 15.0 15.0Total Proposed Operating <strong>Budget</strong> 11,907 9,872 10,319 447 102.6 101.4 102.4 1.0(Change is calculated by whole numbers and numbers may not add up due to rounding)Note: For more detailed information regarding <strong>the</strong> proposed funding for <strong>the</strong> activities within this agency’s divisons, please see Schedule 30-PBBProgram Summary by Activity in <strong>the</strong> FY 2013 Operating Appendices located on <strong>the</strong> <strong>Office</strong> <strong>of</strong> <strong>the</strong> <strong>Chief</strong> <strong>Financial</strong> <strong>Office</strong>r’s website.FY 2013 Proposed <strong>Budget</strong> ChangesThe District Department <strong>of</strong> Human Resources’ (DCHR) proposed FY 2013 gross budget is $10,318,724,which represents a 4.5 percent increase over its FY 2012 approved budget <strong>of</strong> $9,871,867. The budget iscomprised <strong>of</strong> $7,536,269 in Local funds, $277,688 in Special Purpose Revenue funds, and $2,504,767 inIntra-District funds.Current Services Funding LevelThe Current Services Funding Level (CSFL) is a Local funds ONLY representation <strong>of</strong> <strong>the</strong> true cost <strong>of</strong> operatingDistrict agencies, before consideration <strong>of</strong> policy decisions. The CSFL reflects changes from <strong>the</strong> FY2012 approved budget across multiple programs, and it estimates how much it would cost an agency tocontinue its current programs and operations into <strong>the</strong> following fiscal year. The initial adjustments in <strong>the</strong>budget proposal represent changes that should be compared to <strong>the</strong> FY 2013 CSFL budget and not necessarilychanges made to <strong>the</strong> FY 2012 Local funds budget. The FY 2013 CSFL adjustments to <strong>the</strong> FY 2012Local funds budget are described in table 5 <strong>of</strong> this agency's budget chapter. Please see <strong>the</strong> CSFLDevelopment section within Volume 1: Executive Summary for more information regarding <strong>the</strong> methodologyused and components that comprise <strong>the</strong> CSFL.DCHR’s FY 2013 CSFL budget is $7,390,937, which represents a $120,584, or 1.7 percent, increase over <strong>the</strong>FY 2012 approved Local funds budget <strong>of</strong> $7,270,353.Initial Adjusted <strong>Budget</strong>Cost Increase: Local funds – DCHR reclassified $298,088 <strong>of</strong> positions to Regular Pay - O<strong>the</strong>r. Contractual Servicesincreased by $251,517 and Equipment and Equipment Rental by $3,248 due to projected costs. Special PurposeRevenue – within personal services, Fringe Benefits increased by $2,565, and salaries increase by $2,292in <strong>the</strong> Compliance and Legal Administration program. Intra-District funds – salaries were increased by$243,410 for projected step increases and 4.7 new FTEs in <strong>the</strong> Capital City Fellow program. In addition,FY 2013 Proposed <strong>Budget</strong> and <strong>Financial</strong> PlanD.C. Department <strong>of</strong> Human ResourcesA-73
Fringe Benefits increased by $86,983; $82,317 reallocated in personal services from multiple programs to<strong>the</strong> new Business Operations Group program; and Supplies and Materials increased by $15,300.Cost Decrease: Local funds – reducted by $490,936 in personal services across multiple programs. FringeBenefits reduced by $43,826 to align with projected costs, and O<strong>the</strong>r Services and Charges reduced by$2,791. Special Purpose Revenue – Regular Pay – Continuing Full-Time salaries reduced by $4,857 to <strong>of</strong>fsetstep and fringe increases in Regular Pay – O<strong>the</strong>r.Shift: Local funds– Supplies were reduced by $15,300 and shifted to Intra-District funds. Intra-Districtfunds - Contractual Services were reduced by $251,517 and shifted to Local funds.Additionally Adjusted <strong>Budget</strong>Technical Adjustment: Adjustment <strong>of</strong> Fringe Benefits to restore <strong>the</strong> District Government contribution foremployee health insurance from 72 percent, implemented in <strong>the</strong> FY 2011 budget, to 75 percent in FY2013, resulting in an increase <strong>of</strong> $25,589 to DCHR’s Local funds, $897 to Special Purpose Revenue, and$3,551 to Intra-District funds.Policy InitiativesTransfer In: Local funds – DCHR received a net increase <strong>of</strong> $119,742 and 1.0 FTE from <strong>the</strong> <strong>Office</strong> <strong>of</strong><strong>the</strong> <strong>Chief</strong> Technology <strong>Office</strong>r for salary and Fringe Benefits for Human Resources Information Systems(HRIS) functional support.D.C. Department <strong>of</strong> Human ResourcesA-74FY 2013 Proposed <strong>Budget</strong> and <strong>Financial</strong> Plan
FY 2012 Approved <strong>Budget</strong> to FY 2013 Proposed <strong>Budget</strong>, by Revenue TypeTable BE0-5 itemizes <strong>the</strong> changes by revenue type between <strong>the</strong> FY 2012 approved budget and <strong>the</strong> FY 2013 proposedbudget.Table BE0-5(dollars in thousands)PROGRAM BUDGET FTELOCAL FUNDS: FY 2012 Approved <strong>Budget</strong> and FTE 7,270 82.6Fringe Benefit Rate Adjustment Multiple Programs 86 0.0Consumer Price Index Multiple Programs 6 0.0Personal Services Growth Factor Multiple Programs 29 0.0FY 2013 Current Services Funding Level <strong>Budget</strong> (CSFL) 7,391 82.6Cost Increase: Reclassification <strong>of</strong> personal services Multiple Programs 298 0.0Cost Increase: In Contractual Services - O<strong>the</strong>r Business Operations Group 252 0.0Cost Increase: In Equipment and Equipment Rental Business Operations Group 3 0.0Cost Decrease: Personal services Multiple Programs -491 -4.6Cost Decrease: Adjust Fringe Benefits with projected costs Multiple Programs -44 0.0Cost Decrease: O<strong>the</strong>r Services and Charges Multiple Programs -3 0.0Shift: Supplies and shifted to Intra-District funds Multiple Programs -15 0.0FY 2013 Initial Adjusted <strong>Budget</strong> 7,391 78.0Technical Adjustment: Health insurance contribution Multiple Programs 26 0.0FY 2013 Additionally Adjusted <strong>Budget</strong> 7,417 78.0FY 2013 Policy InitiativesTransfer In: Transfer FTE from <strong>the</strong> <strong>Office</strong> <strong>of</strong> <strong>the</strong> <strong>Chief</strong> <strong>Agency</strong> Management Program 120 1.0Technology <strong>Office</strong>r to DCHRLOCAL FUNDS: FY 2013 Proposed <strong>Budget</strong> and FTE 7,536 79.0SPECIAL PURPOSE REVENUE FUNDS: FY 2012 Approved <strong>Budget</strong> and FTE 277 3.8Cost Increase: Align Fringe Benefits with projected costs Compliance and Legal Administration 3 0.0Cost Increase: Net increase <strong>of</strong> personal services moved Compliance and Legal Administration 2 0.0from <strong>the</strong> Benefits and Retirement Services programCost Decrease: Net decrease <strong>of</strong> personal services Compliance and Legal Administration -5 -0.1FY 2013 Initial Adjusted <strong>Budget</strong> 277 3.7Technical Adjustment: Health insurance contribution Multiple Programs 1 0.0FY 2013 Additionally Adjusted <strong>Budget</strong> 278 3.7SPECIAL PURPOSE REVENUE FUNDS: FY 2013 Proposed <strong>Budget</strong> and FTE 278 3.7INTRA-DISTRICT FUNDS: FY 2012 Approved <strong>Budget</strong> and FTE 2,325 15.0Cost Increase: Adjust salary with projected step increases Multiple Programs 243 4.7plus Capital City Fellow FTEsCost Increase: Align Fringe Benefits with projected costs Multiple Programs 87 0.0Cost Increase: Increase in personal services for new program Business Operations Group 82 0.0Cost Increase: Net increase <strong>of</strong> Supplies and Materials Business Operations Group 15 0.0Shift: Reduced Contractual Services and shifted to Local funds Multiple Programs -252 0.0FY 2013 Initial Adjusted <strong>Budget</strong> 2,501 19.7Technical Adjustment: Health insurance contribution Multiple Programs 4 0.0FY 2013 Additionally Adjusted <strong>Budget</strong> 2,505 19.7INTRA-DISTRICT FUNDS: FY 2013 Proposed <strong>Budget</strong> and FTE 2,505 19.7Gross for BE0 - D. C. Department <strong>of</strong> Human Resources 10,319 102.4(Change is calculated by whole numbers and numbers may not add up due to rounding)FY 2013 Proposed <strong>Budget</strong> and <strong>Financial</strong> PlanD.C. Department <strong>of</strong> Human ResourcesA-75
<strong>Agency</strong> Performance PlanThe agency’s performance plan has <strong>the</strong> following objectives for FY 2013:1. Administrative ServicesObjective 1: Attract a highly qualified and diverse workforce for <strong>the</strong> District.Objective 2: Retain and develop a quality work force through a re-engineering <strong>of</strong> key DCHR processes.Objective 3: Enhance customer service to job applicants.Administrative ServicesFY 2010 FY 2011 FY 2011 FY 2012 FY 2013 FY 2014Measure Actual Target Actual Projection Projection ProjectionNotPercentage <strong>of</strong> overall customer satisfaction 1 72% 75% Available 80% 85% 85%Percentage <strong>of</strong> applicants reporting satisfied orextremely satisfied with DCHR customer service 98.5% 90% 98.58% 95% 97% 98%Percentage <strong>of</strong> non-management employeesreporting satisfaction with human resources services 99.2% 97% 99.08% 98% 99% 99%Percentage <strong>of</strong> management employees reportingsatisfaction with human resources services 99.3% 97% 100% 98% 99% 99%Percentage <strong>of</strong> MSS employees that are Districtresidents 37% 40% 35% 45% 50% 50%Percentage <strong>of</strong> responses to customer inquiriesreceived by “Ask <strong>the</strong> Director” within 24 hours 82% 90% 99.17% 95% 97% 98%2. Benefits and RetirementObjective 1: Attract a highly qualified and diverse workforce for <strong>the</strong> District <strong>of</strong> Columbia.Objective 2: Retain and develop a quality work force through a re-engineering <strong>of</strong> key DCHR processes.Objective 3: Enhance customer service to job applicants.Benefits and RetirementFY 2010 FY 2011 FY 2011 FY 2012 FY 2013 FY 2014Measure Actual Target Actual Projection Projection ProjectionPercentage <strong>of</strong> employees participating inDeferred Compensation 39.1% 40% 40.44% 55% 58% 58%Percentage <strong>of</strong> employees enrolled in Employee SelfService 93.1% 90% 97.73% 95% 95% 97%Percentage <strong>of</strong> employees enrolled in Direct Deposit 93.5% 90% 95.73% 92% 95% 97%Number <strong>of</strong> sick leave hours used per 1,000 hours Not Not Not Not Not Notworked 2 Available Available Available Available Available AvailableD.C. Department <strong>of</strong> Human ResourcesA-76FY 2013 Proposed <strong>Budget</strong> and <strong>Financial</strong> Plan
3. Compensation and ClassificationObjective 1: Attract a highly qualified and diverse workforce for <strong>the</strong> District <strong>of</strong> Columbia.Objective 2: Retain and develop a quality workforce through a re-engineering <strong>of</strong> key DCHR processes.Objective 3: Establish organizational and position structures that promote <strong>the</strong> development <strong>of</strong> effective agency missionsand operations.Compensation and ClassificationFY 2010 FY 2011 FY 2011 FY 2012 FY 2013 FY 2014Measure Actual Target Actual Projection Projection ProjectionPercentage <strong>of</strong> new position descriptions writtenwith minimum qualifications 23.1% 25% 27.68% 90% 90% 90%Number <strong>of</strong> classification actions (new jobspecifications or re-certifications) completed 786 400 455 100 200 200Number <strong>of</strong> audit reports submitted to agencyleadership on compensation and classificationissues 5 4 7 4 4 4Number <strong>of</strong> ePerformance training sessions <strong>of</strong>feredto District employees 143 20 19 30 45 50Percentage <strong>of</strong> external salary surveys completedwithin 14 days or survey deadline 97.2% 95% 80% 95% 100% 100%NotNotNumber <strong>of</strong> job specifications in <strong>the</strong> District Available 4,000 Available 2,000 2,000 2,000Number <strong>of</strong> HR advisors and o<strong>the</strong>r management Not Notstaff trained on position management Available 90 Available 90 90 90Number <strong>of</strong> employee appeals for classification or Not Notcompensation review received Available Baseline Available 400 100 100NotNotNumber <strong>of</strong> position management consultations Available 12 Available 24 48 50Percentage <strong>of</strong> employee performance reviews Not Notcompleted on schedule 3 Available Baseline Available TBD TBD TBDFY 2013 Proposed <strong>Budget</strong> and <strong>Financial</strong> PlanD.C. Department <strong>of</strong> Human ResourcesA-77
4. Compliance and LegalObjective 1: Retain and develop a quality workforce through a re-engineering <strong>of</strong> key DCHR processes.Objective 2: Enhance customer service to job applicants.Objective 3: Produce fair, timely and quality legal written decisions in disability retirement cases involving <strong>the</strong>police and firefighters.Objective 4: Maintain a certified pool <strong>of</strong> eligible Police Firefighters’ Retirement and Relief Board members.Compliance and LegalFY 2010 FY 2011 FY 2011 FY 2012 FY 2013 FY 2014Measure Actual Target Actual Projection Projection ProjectionNumber <strong>of</strong> criminal background checks <strong>of</strong> incumbentemployees 2,145 648 559 750 800 800Number <strong>of</strong> criminal background checks <strong>of</strong> applicants 1,493 900 849 1,015 1,200 1,200Number <strong>of</strong> criminal background checks <strong>of</strong> volunteers 2,619 1,900 1,656 2,500 3,000 3,000Number <strong>of</strong> drug tests <strong>of</strong> incumbents 837 1,150 996 1,208 1,268 1,268Number <strong>of</strong> alcohol tests <strong>of</strong> incumbents 141 355 179 374 393 400Number <strong>of</strong> drug tests <strong>of</strong> applicants 1,521 1,150 1,048 1,200 1,350 1,350Number <strong>of</strong> cases that are continued for hearingsNotAvailable Baseline 23 23 TBD TBDNumber <strong>of</strong> cases reversed/remanded by D.C.NotCourt <strong>of</strong> Appeals Available Baseline 0 1 TBD TBDPercentage <strong>of</strong> cases decided within two yearsNotAvailable Baseline 100% 100% TBD TBDNumber <strong>of</strong> training seminars for PFRRB members 0 4 4 5 5 5PFRRB: Police Firefighter Retirement and Relief Board5. Policy and AuditObjective 1: Attract a highly qualified and diverse workforce for <strong>the</strong> District <strong>of</strong> Columbia.Objective 2: Retain and develop a quality workforce through a re-engineering <strong>of</strong> key DCHR processes.Objective 3: Enhance customer service to job applicants.Objective 4: Training for Human Resources Advisors (HRAs).Policy and AuditFY 2010 FY 2011 FY 2011 FY 2012 FY 2013 FY 2014Measure Actual Target Actual Projection Projection ProjectionTotal number <strong>of</strong> vacancies 4 1,978 1,000 775 800 800 800Number <strong>of</strong> audits conducted in District governmentNotagencies 7 9 Available 13 13 13Percentage <strong>of</strong> electronic recruitment processingcompleted within 48 hours for Tier III agencies 5 29% 80% 3.35% 90% 90% 90%D.C. Department <strong>of</strong> Human ResourcesA-78FY 2013 Proposed <strong>Budget</strong> and <strong>Financial</strong> Plan
6. Workforce Development DivisionObjective 1: Attract a highly qualified and diverse workforce for <strong>the</strong> District <strong>of</strong> Columbia.Objective 2: Retain and develop a quality workforce through a re-engineering <strong>of</strong> key DCHR processes.Objective 3: Enhance training opportunities.Workforce Development DivisionFY 2010 FY 2011 FY 2011 FY 2012 FY 2013 FY 2014Measure Actual Target Actual Projection Projection ProjectionNumber <strong>of</strong> Certified Public Managers transitioninginto management positions and/or leadership roleswithin one year <strong>of</strong> certification 6 27.3% 35% 38.89% 40% 45% 46%Percentage <strong>of</strong> Capital City Fellows and EmergingLeaders accepting District positions upon completion<strong>of</strong> program 47.4% 40% 22.22% 45% 50% 55%Average time (hours) spent per employee in WDAinstructor led training 5.4 6 5 10 12 15Average time (hours) spent per employee in WDAtraining online 4.8 3 2.89 5 7 10Number <strong>of</strong> employees utilizing <strong>the</strong> new LearningManagement System (LMS)NotAvailable 2,000NotAvailable 3,000 4,000 5,000Performance Plan Endnotes:1. This is an industry standard. According to <strong>the</strong> FY 2007 International City/County Management Association (ICMA) Center forPerformance Measurement, <strong>the</strong> average percent <strong>of</strong> overall satisfaction is 75.4 percent based on responses from 9 jurisdictions.2. This is a baseline measure. There are no projections for out years. This is an industry standard. According to FY 2007 ICMACenter for Performance Measurement, <strong>the</strong> average number <strong>of</strong> sick leave hours used per 1,000 hours worked is 30 hours basedon <strong>the</strong> responses <strong>of</strong> 73 jurisdictions.3. This is an industry standard. According to <strong>the</strong> FY 2007 ICMA Center for Performance Measurement, <strong>the</strong> average percentage <strong>of</strong>employee performance reviews completed on schedule was 78.7 percent based on responses from 76 jurisdictions.4. The number <strong>of</strong> vacancies in Fiscal Year 2010 was impacted by a District-wide hiring freeze, which resulted in a reduced rate <strong>of</strong><strong>the</strong> backfilling <strong>of</strong> positions vacated by attrition.5. A Tier III agency referenced in <strong>the</strong> table above is an agency (subordinate or independent) for which <strong>the</strong> DCHR provides <strong>the</strong> fullcadre <strong>of</strong> HR services.6. This measure tracks <strong>the</strong> number <strong>of</strong> all graduates (grades 13 and above) who progress into new leadership positions/roles, andthose who continue <strong>the</strong>ir leadership/management progression beyond <strong>the</strong> management role <strong>the</strong>y encumbered at <strong>the</strong> time <strong>of</strong>application.FY 2013 Proposed <strong>Budget</strong> and <strong>Financial</strong> PlanD.C. Department <strong>of</strong> Human ResourcesA-79
(JR0)<strong>Office</strong> <strong>of</strong> Disability Rightshttp://odr.dc.govTelephone: 202-724-5055% ChangeFY 2011 FY 2012 FY 2013 fromDescription Actual Approved Proposed FY 2012Operating <strong>Budget</strong> $1,207,286 $1,616,156 $1,839,671 13.8FTEs 10.6 11.0 11.0 0.0The mission <strong>of</strong> <strong>the</strong> <strong>Office</strong> <strong>of</strong> Disability Rights (ODR) is to ensure thatevery program, service, benefit, and activity operated or funded by <strong>the</strong>District <strong>of</strong> Columbia is fully accessible to, and usable by, qualified peoplewith disabilities with or without reasonable accommodations ormodifications.Summary <strong>of</strong> ServicesODR is responsible for oversight <strong>of</strong> <strong>the</strong> District’s obligations under <strong>the</strong> Americans with Disabilities Act (ADA), aswell as o<strong>the</strong>r federal and local disability rights laws. ODR provides technical assistance, training, informal disputeresolution, policy guidance, and expertise on disability rights issues to District agencies and <strong>the</strong> disability community.ODR coordinates <strong>the</strong> ADA compliance efforts <strong>of</strong> all District agencies and works with agency ADA coordinatorsto ensure that <strong>the</strong> District is responsive to <strong>the</strong> needs <strong>of</strong> <strong>the</strong> disability community and employees with disabilities.The agency’s FY 2013 proposed budget is presented in <strong>the</strong> following tables:FY 2013 Proposed <strong>Budget</strong> and <strong>Financial</strong> Plan<strong>Office</strong> <strong>of</strong> Disability RightsA-81
FY 2013 Proposed Gross Funds Operating <strong>Budget</strong>, by Revenue TypeTable JR0-1 contains <strong>the</strong> proposed FY 2013 agency budget compared to <strong>the</strong> FY 2012 approved budget. It alsoprovides FY 2010 and FY 2011 actual expenditures.Table JR0-1(dollars in thousands)ChangeActual Actual Approved Proposed from PercentAppropriated Funds FY 2010 FY 2011 FY 2012 FY 2013 FY 2012 Change*General FundLocal Funds 961 819 952 970 18 1.9Total for General Fund 961 819 952 970 18 1.9Federal ResourcesFederal Grant Funds 220 379 664 718 54 8.1Total for Federal Resources 220 379 664 718 54 8.1Intra-District FundsIntra-District Funds 0 9 0 152 152 N/ATotal for Intra-District Funds 0 9 0 152 152 N/AGross Funds 1,181 1,207 1,616 1,840 224 13.8*Percent change is based on whole dollars.Note: If applicable, for a breakdown <strong>of</strong> each Grant (Federal and Private), Special Purpose Revenue type and Intra-District agreement,please refer to Schedule 80 <strong>Agency</strong> Summary by Revenue Source in <strong>the</strong> FY 2013 Operating Appendices located on <strong>the</strong> <strong>Office</strong> <strong>of</strong> <strong>the</strong><strong>Chief</strong> <strong>Financial</strong> <strong>Office</strong>r’s website.FY 2013 Proposed Full-Time Equivalents, by Revenue TypeTable JR0-2 contains <strong>the</strong> proposed FY 2013 FTE level compared to <strong>the</strong> FY 2012 approved FTE level by revenuetype. It also provides FY 2010 and FY 2011 actual data.Table JR0-2ChangeActual Actual Approved Proposed from PercentAppropriated Funds FY 2010 FY 2011 FY 2012 FY 2013 FY 2012 ChangeGeneral FundLocal Funds 7.7 7.6 8.0 8.0 0.0 0.0Total for General Fund 7.7 7.6 8.0 8.0 0.0 0.0Federal ResourcesFederal Grant Funds 0.0 3.0 3.0 3.0 0.0 0.0Total for Federal Resources 0.0 3.0 3.0 3.0 0.0 0.0Total Proposed FTEs 7.7 10.6 11.0 11.0 0.0 0.0<strong>Office</strong> <strong>of</strong> Disability RightsA-82FY 2013 Proposed <strong>Budget</strong> and <strong>Financial</strong> Plan
FY 2013 Proposed Operating <strong>Budget</strong>, by Comptroller Source GroupTable JR0-3 contains <strong>the</strong> proposed FY 2013 budget at <strong>the</strong> Comptroller Source Group (object class) level comparedto <strong>the</strong> FY 2012 approved budget. It also provides FY 2010 and FY 2011 actual expenditures.Table JR0-3(dollars in thousands)ChangeActual Actual Approved Proposed from PercentComptroller Source Group FY 2010 FY 2011 FY 2012 FY 2013 FY 2012 Change*11 - Regular Pay - Continuing Full Time 734 797 879 891 11 1.312 - Regular Pay - O<strong>the</strong>r 44 0 0 0 0 N/A14 - Fringe Benefits - Current Personnel 161 161 157 179 22 13.815 - Overtime Pay 0 0 0 0 0 0Subtotal Personal Services (PS) 940 958 1,036 1,069 33 3.220 - Supplies and Materials 12 9 12 14 2 20.930 - Energy, Comm. and Building Rentals 5 0 0 0 0 N/A31 - Telephone, Telegraph, Telegram, Etc. 6 0 0 0 0 N/A34 - Security Services 4 0 0 0 0 N/A35 - Occupancy Fixed Costs 11 0 0 0 0 N/A40 - O<strong>the</strong>r Services and Charges 181 179 150 305 155 103.241 - Contractual Services - O<strong>the</strong>r 11 53 400 433 33 8.270 - Equipment and Equipment Rental 11 8 19 19 0 2.0Subtotal Nonpersonal Services (NPS) 242 249 580 771 190 32.8Gross Funds 1,181 1,207 1,616 1,840 224 13.8*Percent change is based on whole dollars.Program DescriptionThe <strong>Office</strong> <strong>of</strong> Disability Rights operates through <strong>the</strong> following 2 programs:Disability Rights – promotes <strong>the</strong> accessibility <strong>of</strong> District <strong>of</strong> Columbia government programs and services forindividuals with disabilities by coordinating and overseeing a District-wide compliance program.This program contains <strong>the</strong> following 6 activities:■ Operations – provides overall direction, leadership, and coordination <strong>of</strong>, and guidance on, activities related to<strong>the</strong> centralized administrative support system; establishes procedures and protocols for unified operationswithin <strong>the</strong> agency; and assists in facilities management;■ Training and Technical Assistance – provides ongoing training and technical assistance to <strong>the</strong> agency’s ADAcoordinators and personnel;■ Public Information and Outreach – provides information through published literature, assistance and referralsto individuals who have questions about disability rights or are experiencing obstacles to receiving services;■ Evaluation and Compliance – evaluates <strong>the</strong> District’s compliance with <strong>the</strong> ADA, section 504 <strong>of</strong> <strong>the</strong>Rehabilitation Act, and <strong>the</strong> disability rights provisions <strong>of</strong> <strong>the</strong> Human Rights Act; reports deficiencies to <strong>the</strong>FY 2013 Proposed <strong>Budget</strong> and <strong>Financial</strong> Plan<strong>Office</strong> <strong>of</strong> Disability RightsA-83
■■<strong>Office</strong> <strong>of</strong> Human Rights; makes recommendations for addressing deficiencies to <strong>the</strong> Mayor; and coordinates,facilitates, and supports <strong>the</strong> Mayor’s Committee on Persons with Disabilities;Investigations – provides informal dispute resolution into actions or inactions <strong>of</strong> agencies in alleged violation<strong>of</strong> <strong>the</strong> ADA, <strong>the</strong> District <strong>of</strong> Columbia Disability Rights Protection Act, o<strong>the</strong>r federal disability civil rightslegislation, and o<strong>the</strong>r disability-related civil rights legislation; andState Developmental Disabilities Council (DDC) – functions as <strong>the</strong> Designated State <strong>Agency</strong>; provides supportservices; maintains fiscal responsibilities, records, access, and financial reports; and supports <strong>the</strong> DDC stateplan.<strong>Agency</strong> Management – provides for administrative support and <strong>the</strong> required tools to achieve operational andprogrammatic results. This program is standard for all agencies using performance-based budgeting.Program Structure ChangeThe <strong>Office</strong> <strong>of</strong> Disability Rights has no program structure changes in <strong>the</strong> FY 2013 proposed budget.FY 2013 Proposed Operating <strong>Budget</strong> and FTEs, by Program and ActivityTable JR0-4 contains <strong>the</strong> proposed FY 2013 budget by program and activity compared to <strong>the</strong> FY 2012 approved budget.It also provides <strong>the</strong> FY 2011 actual data.Table JR0-4(dollars in thousands)Dollars in ThousandsFull-Time EquivalentsChangeChangeActual Approved Proposed from Actual Approved Proposed fromProgram/Activity FY 2011 FY 2012 FY 2013 FY 2012 FY 2011 FY 2012 FY 2013 FY 2012(1000) <strong>Agency</strong> Management Program(1030) Property Management 0 2 3 0 0.0 0.0 0.0 0.0(1040) Information Technology 8 6 6 0 0.0 0.0 0.0 0.0(1090) Performance Management 215 295 299 4 2.8 3.0 3.0 0.0Subtotal (1000) <strong>Agency</strong> Management Program 224 303 308 4 2.8 3.0 3.0 0.0(2000) Disability Rights(2005) Operations 1 11 11 0 0.9 0.0 0.0 0.0(2010) Training and Technical Assistance 150 154 159 4 0.9 1.6 1.6 0.0(2015) Public Information and Outreach 0 1 1 0 0.0 0.0 0.0 0.0(2020) Evaluation and Compliance 410 445 603 158 1.4 3.0 3.0 0.0(2030) Investigations 44 37 41 4 1.4 0.4 0.4 0.0(2040) State Developmental Disabilities Council 379 664 718 54 3.0 3.0 3.0 0.0Subtotal (2000) Disability Rights 984 1,313 1,532 219 7.7 8.0 8.0 0.0Total Proposed Operating <strong>Budget</strong> 1,207 1,616 1,840 224 10.6 11.0 11.0 0.0(Change is calculated by whole numbers and numbers may not add up due to rounding)Note: For more detailed information regarding <strong>the</strong> proposed funding for <strong>the</strong> activities within this agency’s programs, please see Schedule 30-PBBProgram Summary by Activity in <strong>the</strong> FY 2013 Operating Appendices located on <strong>the</strong> <strong>Office</strong> <strong>of</strong> <strong>the</strong> <strong>Chief</strong> <strong>Financial</strong> <strong>Office</strong>r’s website.<strong>Office</strong> <strong>of</strong> Disability RightsA-84FY 2013 Proposed <strong>Budget</strong> and <strong>Financial</strong> Plan
FY 2013 Proposed <strong>Budget</strong> ChangesThe <strong>Office</strong> <strong>of</strong> Disability Rights’ (ODR) proposed FY 2013 gross budget is $1,839,671, which represents a 13.8percent increase over its FY 2012 approved gross budget <strong>of</strong> $1,616,156. The budget is comprised <strong>of</strong> $970,136 inLocal funds, $717,535 in Federal Grants funds, and $152,000 in Intra-District funds.Current Services Funding LevelThe Current Services Funding Level (CSFL) is a Local funds ONLY representation <strong>of</strong> <strong>the</strong> true cost <strong>of</strong> operatingDistrict agencies, before consideration <strong>of</strong> policy decisions. The CSFL reflects changes from <strong>the</strong> FY 2012 approvedbudget across multiple programs, and it estimates how much it would cost an agency to continue its current programsand operations into <strong>the</strong> following fiscal year. The initial adjustments in <strong>the</strong> budget proposal representchanges that should be compared to <strong>the</strong> FY 2013 CSFL budget and not necessarily changes made to <strong>the</strong> FY 2012Local funds budget. The FY 2013 CSFL adjustments to <strong>the</strong> FY 2012 Local funds budget are described in table 5<strong>of</strong> this agency's budget chapter. Please see <strong>the</strong> CSFL Development section within Volume 1: Executive Summaryfor more information regarding <strong>the</strong> methodology used and components that comprise <strong>the</strong> CSFL.ODR’s FY 2013 CSFL budget is $967,257, which represents a $15,074, or 1.6 percent, increase over <strong>the</strong> FY2012 approved Local funds budget <strong>of</strong> $952,183.Initial Adjusted <strong>Budget</strong>The budget proposal enables <strong>the</strong> agency to continue to maximize all available resources to ensure that every program,service, benefit, and activity operated or funded by <strong>the</strong> District <strong>of</strong> Columbia is fully accessible to, and usableby, people with disabilities.Cost Increase: The budget proposal includes adjustments in personal services for projected salary, steps and FringeBenefit cost increases <strong>of</strong> $14,579 in Local funds and $3,596 in Federal Grant funds. The proposed budget includesadjustments in nonpersonal services for Supplies and Materials <strong>of</strong> $2,100, O<strong>the</strong>r Services and Charges <strong>of</strong> $14,900and Contractual Services <strong>of</strong> $31,900 in Federal Grants. The budget proposal also includes nonpersonal servicesadjustments <strong>of</strong> $152,000 in Intra-District funds for O<strong>the</strong>r Services and Charges based on new District-wideMemoranda <strong>of</strong> Understanding (MOU) with 31 agencies for Sign Language Interpretation Services.Cost Decrease: The budget proposal includes a reduction <strong>of</strong> $14,579 in Local funds that reflects cost reductionsin O<strong>the</strong>r Services and Charges.Additionally Adjusted <strong>Budget</strong>Technical Adjustment: Adjustments <strong>of</strong> Fringe Benefits to restore <strong>the</strong> District Government contribution foremployee health insurance from 72 percent, implemented in <strong>the</strong> FY 2011 budget, to 75 percent in FY 2013, resultingin increases <strong>of</strong> $2,880 in Local funds and $776 in Federal Grants funds.FY 2013 Proposed <strong>Budget</strong> and <strong>Financial</strong> Plan<strong>Office</strong> <strong>of</strong> Disability RightsA-85
FY 2012 Approved <strong>Budget</strong> to FY 2013 Proposed <strong>Budget</strong>, by Revenue TypeTable JR0-5 itemizes <strong>the</strong> changes by revenue type between <strong>the</strong> FY 2012 approved budget and <strong>the</strong> FY 2013 proposedbudget.Table JR0-5(dollars in thousands)PROGRAM BUDGET FTELOCAL FUNDS: FY 2012 Approved <strong>Budget</strong> and FTE 952 8.0Fringe Benefit Rate Adjustment Multiple Programs 8 0.0Consumer Price Index Multiple Programs 4 0.0Personal Services Growth Factor Multiple Programs 3 0.0FY 2013 Current Services Funding Level <strong>Budget</strong> (CSFL) 967 8.0Cost Increase: Projected salary, steps and Fringe Benefit Multiple Programs 15 0.0increasesCost Decrease: Cost reduction <strong>of</strong> O<strong>the</strong>r Services and Charges Multiple Programs -15 0.0FY 2013 Initial Adjusted <strong>Budget</strong> 967 8.0Technical Adjustment: Health insurance contribution Multiple Programs 3 0.0FY 2013 Additionally Adjusted <strong>Budget</strong> 970 8.0LOCAL FUNDS: FY 2013 Proposed <strong>Budget</strong> and FTE 970 8.0FEDERAL GRANT FUNDS: FY 2012 Approved <strong>Budget</strong> and FTE 664 3.0Cost Increase: Projected salary, steps and Fringe Benefit Disability Rights 4 0.0increasesCost Increase: Supplies and Materials Disability Rights 2 0.0Cost Increase: O<strong>the</strong>r Services and Charges Disability Rights 15 0.0Cost Increase: Contractual Services Disability Rights 32 0.0FY 2013 Initial Adjusted <strong>Budget</strong> 717 3.0Technical Adjustment: Health insurance contribution Multiple Programs 1 0.0FY 2013 Additionally Adjusted <strong>Budget</strong> 718 3.0FEDERAL GRANT FUNDS: FY 2013 Proposed <strong>Budget</strong> and FTE 718 3.0INTRA-DISTRICT FUNDS: FY 2012 Approved <strong>Budget</strong> and FTE 0 0.0Cost Increase: O<strong>the</strong>r Services and Charges (District-wide Disability Rights 152 0.0MOU with 31 agencies for Sign Language Interpretation services)FY 2013 Initial Adjusted <strong>Budget</strong> 152 0.0INTRA-DISTRICT FUNDS: FY 2013 Proposed <strong>Budget</strong> and FTE 152 0.0Gross for JR0 - <strong>Office</strong> <strong>of</strong> Disability Rights 1,840 11.0<strong>Office</strong> <strong>of</strong> Disability RightsA-86FY 2013 Proposed <strong>Budget</strong> and <strong>Financial</strong> Plan
<strong>Agency</strong> Performance PlanThe agency’s performance plan has <strong>the</strong> following objectives for FY 2013:Objective 1: Be a model city <strong>of</strong> accessibility for people with disabilities.Objective 2: Improve <strong>the</strong> responsiveness <strong>of</strong> government systems and employees to <strong>the</strong> needs <strong>of</strong> people with disabilities.Objective 3: Increase employment <strong>of</strong> people with disabilities in District government.Objective 4: Expand opportunities for people with disabilities to live in integrated community settings.<strong>Agency</strong> Performance MeasuresFY 2010 FY 2011 FY 2011 FY 2012 FY 2013 FY 2014Measure Actual Target Actual Projection Projection ProjectionNumber <strong>of</strong> District-owned and leased buildingsmodified for accessibility 78 50 71 60 70NotAvailableNumber <strong>of</strong> District facilities assessed foraccommodation needs 102 60 357NotAvailableNotAvailableNotAvailablePercentage <strong>of</strong> sign language interpretation requestsfilled within 5-7 days from <strong>the</strong> date <strong>of</strong> <strong>the</strong> request 100% 100% 100% 100% 100%NotAvailableNumber <strong>of</strong> agencies trained on Section 508 andcontent management 22 18NotAvailable 22 30NotAvailablePercentage <strong>of</strong> video and audio files posted to newcontent management system with captioning orwritten transcriptNotAvailable 80%NotAvailableNotAvailableNotAvailableNotAvailableNumber <strong>of</strong> agency Section 508 compliance plans Not Not Not Not Notto improve web accessibility submitted Available 14 Available Available Available AvailableNumber <strong>of</strong> District employees, contractors, andgrantees receiving ADA training 750 600 676 1,000 750NotAvailableNumber <strong>of</strong> technical assistance calls/complaints/resource requests handled within 30 days 629 450 470 480 420NotAvailableNumber <strong>of</strong> agency ADA compliance plans completedand being implemented 50 60 140 50 85NotAvailableNotNumber <strong>of</strong> sign language requests completed 411 400 402 425 450 AvailableNumber <strong>of</strong> reasonable accommodations provided toDistrict employees 29 40 35 30 30NotAvailableNumber <strong>of</strong> people moved out <strong>of</strong> institutions intocommunity-based settings 761 90 840NotAvailableNotAvailableNotAvailableFY 2013 Proposed <strong>Budget</strong> and <strong>Financial</strong> Plan<strong>Office</strong> <strong>of</strong> Disability RightsA-87
Medical Liability CaptiveInsurance <strong>Agency</strong>(RJ0)% ChangeFY 2011 FY 2012 FY 2013 fromDescription Actual Approved Proposed FY 2012Operating <strong>Budget</strong> $196,378 $3,181,640 $2,495,850 -21.6The mission <strong>of</strong> <strong>the</strong> Medical Liability Captive Insurance <strong>Agency</strong> (“<strong>the</strong>Captive”) is to provide insurance for local non-pr<strong>of</strong>it health centers.The Captive was created by statute in 2008 and is administered by <strong>the</strong><strong>Chief</strong> Risk <strong>Office</strong>r, <strong>Office</strong> <strong>of</strong> Risk Management (ORM). ORMincorporated <strong>the</strong> Captive and began writing insurance policies in FY2008. The liability <strong>of</strong> <strong>the</strong> agency is limited to <strong>the</strong> funds available to <strong>the</strong>Captive participants.The agency’s FY 2013 proposed budget is presented in <strong>the</strong> following tables:FY 2013 Proposed <strong>Budget</strong> and <strong>Financial</strong> PlanMedical Liability Captive Insurance <strong>Agency</strong>A-89
FY 2013 Proposed Gross Funds Operating <strong>Budget</strong>, by Revenue TypeTable RJ0-1 contains <strong>the</strong> proposed FY 2013 agency budget compared to <strong>the</strong> FY 2012 approved budget. It also providesFY 2010 and FY 2011 actual expenditures.Table RJ0-1(dollars in thousands)ChangeActual Actual Approved Proposed from PercentAppropriated Fund FY 2010 FY 2011 FY 2012 FY 2013 FY 2012 Change*General FundLocal Funds 0 196 2,584 2,430 -154 -6.0Special Purpose Revenue Funds 210 0 598 66 -531 -88.9Total for General Fund 210 196 3,182 2,496 -686 -21.6Gross Funds 210 196 3,182 2,496 -686 -21.6*Percent change is based on whole dollars.Note: If applicable, for a breakdown <strong>of</strong> each Grant (Federal and Private), Special Purpose Revenue type and Intra-District agreement,please refer to Schedule 80 <strong>Agency</strong> Summary by Revenue Source in <strong>the</strong> FY 2013 Operating Appendices located on <strong>the</strong> <strong>Office</strong> <strong>of</strong> <strong>the</strong><strong>Chief</strong> <strong>Financial</strong> <strong>Office</strong>r’s website.FY 2013 Proposed Operating <strong>Budget</strong>, by Comptroller Source GroupTable RJ0-2 contains <strong>the</strong> proposed FY 2013 budget at <strong>the</strong> Comptroller Source Group (object class) level comparedto <strong>the</strong> FY 2012 approved budget. It also provides FY 2010 and FY 2011 actual expenditures.Table RJ0-2(dollars in thousands)ChangeActual Actual Approved Proposed from PercentComptroller Source Group FY 2010 FY 2011 FY 2012 FY 2013 FY 2012 Change*11 - Regular Pay - Continuing Full Time 37 -1 0 0 0 N/A12 - Regular Pay - O<strong>the</strong>r 60 88 0 0 0 N/A13 - Additional Gross Pay 1 -1 0 0 0 N/A14 - Fringe Benefits - Current Personnel 16 16 0 0 0 N/ASubtotal Personal Services (PS) 115 102 0 0 0 N/A20 - Supplies and Materials 0 0 10 10 0 N/A40 - O<strong>the</strong>r Services and Charges 95 95 3,172 2,486 -686 -21.6Subtotal Nonpersonal Services (NPS) 95 95 3,182 2,496 -686 -21.6Gross Funds 210 196 3,182 2,496 -686 -21.6*Percent change is based on whole dollars.Medical Liability Captive Insurance <strong>Agency</strong>A-90FY 2013 Proposed <strong>Budget</strong> and <strong>Financial</strong> Plan
Program DescriptionThe District <strong>of</strong> Columbia Medical Liability Captive Insurance Company operates through <strong>the</strong> following program:Medical Liability Captive Operations - is developed to reduce <strong>the</strong> District’s unlimited medical malpractice risks,while providing insurance for local non-pr<strong>of</strong>it health centers. The <strong>Office</strong> <strong>of</strong> Risk Management underwrites andadministers medical malpractice insurance policies to non-pr<strong>of</strong>it community health centers and <strong>of</strong>fers gap insuranceto Federally Qualified Health Centers for claims that are not covered by <strong>the</strong> Federal Tort Claims Act.This program contains <strong>the</strong> following 2 activities:■ Oversight - The <strong>Chief</strong> Risk <strong>Office</strong>r, with <strong>the</strong> assistance <strong>of</strong> <strong>the</strong> Captive Advisory Council, continues to adviseand oversee <strong>the</strong> needs and interests <strong>of</strong> <strong>the</strong> health centers to ensure that <strong>the</strong>y continue to meet <strong>the</strong> requirements<strong>of</strong> <strong>the</strong> Captive for providing services to <strong>the</strong>ir customers and <strong>the</strong> financial condition <strong>of</strong> its policyholders; and■ Growth and Income Strategy and Management - distributes payments and collects premium and interestincome on behalf <strong>of</strong> <strong>the</strong> District Medical Liability Captive Insurance <strong>Agency</strong> for <strong>the</strong> establishment, operation,and administration <strong>of</strong> <strong>the</strong> agency.Program Structure ChangesThe District <strong>of</strong> Columbia Medical Liability Captive Insurance <strong>Agency</strong> has no program structure changes in <strong>the</strong> FY2013 proposed budget.FY 2013 Proposed Operating <strong>Budget</strong> and FTEs, by Program and ActivityTable RJ0-3 contains <strong>the</strong> proposed FY 2013 budget by program and activity compared to <strong>the</strong> FY 2012 approved budget.It also provides <strong>the</strong> FY 2011 actual data.Table RJ0-3(dollars in thousands)Dollars in ThousandsFull-Time EquivalentsChangeChangeActual Approved Proposed from Actual Approved Proposed fromProgram/Activity FY 2011 FY 2012 FY 2013 FY 2012 FY 2011 FY 2012 FY 2013 FY 2012(2000) Medical Liability Captive Operations(2001) Oversight 196 2,584 2,430 -154 0.0 0.0 0.0 0.0(2002) Growth and Income Strategy and Management 0 598 66 -531 0.0 0.0 0.0 0.0Subtotal (2000) Medical Liability Captive Operations 196 3,182 2,496 -686 0.0 0.0 0.0 0.0Total Proposed Operating <strong>Budget</strong> 196 3,182 2,496 -686 0.0 0.0 0.0 0.0(Change is calculated by whole numbers and numbers may not add up due to rounding)Note: For more detailed information regarding <strong>the</strong> proposed funding for <strong>the</strong> activities within this agency’s programs, please see Schedule 30-PBBProgram Summary by Activity in <strong>the</strong> FY 2013 Operating Appendices located on <strong>the</strong> <strong>Office</strong> <strong>of</strong> <strong>the</strong> <strong>Chief</strong> <strong>Financial</strong> <strong>Office</strong>r’s website.FY 2013 Proposed <strong>Budget</strong> and <strong>Financial</strong> PlanMedical Liability Captive Insurance <strong>Agency</strong>A-91
FY 2013 Proposed <strong>Budget</strong> ChangesThe Medical Liability Captive Insurance <strong>Agency</strong>’s (MLCIA) proposed FY 2013 gross budget is $2,495,850, whichrepresents a 21.6 percent decrease from its FY 2012 approved gross budget <strong>of</strong> $3,181,640. The budget is comprised<strong>of</strong> $2,429,757 in Local funds and $66,093 in Special Purpose Revenue funds.Current Services Funding LevelThe Current Services Funding Level (CSFL) is a Local funds ONLY representation <strong>of</strong> <strong>the</strong> true cost <strong>of</strong> operatingDistrict agencies, before consideration <strong>of</strong> policy decisions. The CSFL reflects changes from <strong>the</strong> FY 2012 approvedbudget across multiple programs, and it estimates how much it would cost an agency to continue its current programsand operations into <strong>the</strong> following fiscal year. The initial adjustments in <strong>the</strong> budget proposal representchanges that should be compared to <strong>the</strong> FY 2013 CSFL budget and not necessarily changes made to <strong>the</strong> FY 2012Local funds budget. The FY 2013 CSFL adjustments to <strong>the</strong> FY 2012 Local funds budget are described in table 4<strong>of</strong> this agency's budget chapter. Please see <strong>the</strong> CSFL Development section within Volume 1: Executive Summaryfor more information regarding <strong>the</strong> methodology used and components that comprise <strong>the</strong> CSFL.MLCIA’s FY 2013 CSFL Local budget is $2,429,757, which represents a $154,357, or 6.0 percent, decrease from<strong>the</strong> FY 2012 approved Local funds budget <strong>of</strong> $2,584,114.Initial Adjusted <strong>Budget</strong>Cost Decrease: Special Purpose Revenue funds were decreased by $531,433 to align with projected resources.FY 2012 Approved <strong>Budget</strong> to FY 2013 Proposed <strong>Budget</strong>, by Revenue TypeTable RJ0-4 itemizes <strong>the</strong> changes by revenue type between <strong>the</strong> FY 2012 approved budget and <strong>the</strong> FY 2013 proposedbudget.Table RJ0-4(dollars in thousands)PROGRAM BUDGET FTELOCAL FUNDS: FY 2012 Approved <strong>Budget</strong> and FTE 2,584 0.0Removal <strong>of</strong> One-Time Funding Medical Liability Captive Operations -202 0.0Consumer Price Index Medical Liability Captive Operations 48 0.0FY 2013 Current Services Funding Level <strong>Budget</strong> (CSFL) 2,430 0.0No Change 0 0.0FY 2013 Initial Adjusted <strong>Budget</strong> 2,430 0.0LOCAL FUNDS: FY 2013 Proposed <strong>Budget</strong> and FTE 2,430 0.0SPECIAL PURPOSE REVENUE FUNDS: FY 2012 Approved <strong>Budget</strong> and FTE 598 0.0Cost Decrease: To align with projected resources Medical Liability Captive Operations -531 0.0FY 2013 Initial Adjusted <strong>Budget</strong> 66 0.0SPECIAL PURPOSE REVENUE FUNDS: FY 2013 Proposed <strong>Budget</strong> and FTE 66 0.0Gross for RJ0 - Medical Liability Captive Insurance <strong>Agency</strong> 2,496 0.0(Change is calculated by whole numbers and numbers may not add up due to rounding)Medical Liability Captive Insurance <strong>Agency</strong>A-92FY 2013 Proposed <strong>Budget</strong> and <strong>Financial</strong> Plan
<strong>Office</strong> <strong>of</strong> Finance and ResourceManagement(AS0)www.cfo.dc.govTelephone: 202-727-0333% ChangeFY 2011 FY 2012 FY 2013 fromDescription Actual Approved Proposed FY 2012Operating <strong>Budget</strong> $31,708,152 $31,056,301 $32,637,894 5.1FTEs 47.5 42.0 42.0 0.0The mission <strong>of</strong> <strong>the</strong> <strong>Office</strong> <strong>of</strong> Finance and Resource Management(OFRM) is to provide financial and resource management services tovarious District <strong>of</strong> Columbia government agencies. OFRM will promote<strong>the</strong> effective management <strong>of</strong> <strong>the</strong> District's resources by continuouslyseeking improvements in operational efficiency on behalf <strong>of</strong> <strong>the</strong>government and <strong>the</strong> residents <strong>of</strong> <strong>the</strong> District.FY 2013 Proposed <strong>Budget</strong> and <strong>Financial</strong> Plan<strong>Office</strong> <strong>of</strong> Finance and Resource ManagementA-93
The agency’s FY 2013 proposed budget is presented in <strong>the</strong> following tables:FY 2013 Proposed Gross Funds Operating <strong>Budget</strong>, by Revenue TypeTable AS0-1 contains <strong>the</strong> proposed FY 2013 agency budget compared to <strong>the</strong> FY 2012 approved budget. It alsoprovides FY 2010 and FY 2011 actual expenditures.Table AS0-1(dollars in thousands)ChangeActual Actual Approved Proposed from PercentAppropriated Fund FY 2010 FY 2011 FY 2012 FY 2013 FY 2012 Change*General FundLocal Funds 4,297 17,874 19,068 19,373 305 1.6Special Purpose Revenue Funds 0 0 226 294 68 29.9Total for General Fund 4,297 17,874 19,294 19,667 373 1.9Intra-District FundsIntra-District Funds 250,197 13,834 11,762 12,971 1,209 10.3Total for Intra-District Funds 250,197 13,834 11,762 12,971 1,209 10.3Gross Funds 254,495 31,708 31,056 32,638 1,582 5.1*Percent change is based on whole dollars.Note: If applicable, for a breakdown <strong>of</strong> each Grant (Federal and Private), Special Purpose Revenue type and intra-District agreement,please refer to Schedule 80 <strong>Agency</strong> Summary by Revenue Source in <strong>the</strong> FY 2013 Operating Appendices located on <strong>the</strong> <strong>Office</strong> <strong>of</strong> <strong>the</strong><strong>Chief</strong> <strong>Financial</strong> <strong>Office</strong>r’s website.FY 2013 Proposed Full-Time Equivalents, by Revenue TypeTable AS0-2 contains <strong>the</strong> proposed FY 2013 FTE level compared to <strong>the</strong> FY 2012 approved FTE level by revenuetype. It also provides FY 2010 and FY 2011 actual data.Table AS0-2ChangeActual Actual Approved Proposed from PercentAppropriated Fund FY 2010 FY 2011 FY 2012 FY 2013 FY 2012 ChangeGeneral FundLocal Funds 46.5 39.8 37.6 37.4 -0.3 -0.8Total for General Fund 46.5 39.8 37.6 37.4 -0.3 -0.8Intra-District FundsIntra-District Funds 4.3 7.8 4.4 4.6 0.3 6.9Total for Intra-District Funds 4.3 7.8 4.4 4.6 0.3 6.9Total Proposed FTEs 50.9 47.5 42.0 42.0 0.0 0.0<strong>Office</strong> <strong>of</strong> Finance and Resource ManagementA-94FY 2013 Proposed <strong>Budget</strong> and <strong>Financial</strong> Plan
FY 2013 Proposed Operating <strong>Budget</strong>, by Comptroller Source GroupTable AS0-3 contains <strong>the</strong> proposed FY 2013 budget at <strong>the</strong> Comptroller Source Group (object class) level comparedto <strong>the</strong> FY 2012 approved budget. It also provides FY 2010 and FY 2011 actual expenditures.Table AS0-3(dollars in thousands)ChangeActual Actual Approved Proposed from PercentComptroller Source Group FY 2010 FY 2011 FY 2012 FY 2013 FY 2012 Change*11 - Regular Pay - Continuing Full Time 3,764 3,806 3,615 3,811 196 5.412 - Regular Pay - O<strong>the</strong>r 28 0 0 0 0 N/A13 - Additional Gross Pay 11 15 0 0 0 N/A14 - Fringe Benefits - Current Personnel 789 756 801 918 117 14.615 - Overtime Pay 8 10 0 4 4 N/ASubtotal Personal Services (PS) 4,600 4,587 4,416 4,734 317 7.220 - Supplies and Materials 25 13 6 30 24 370.430 - Energy, Comm. and Building Rentals 97,709 250 0 0 0 N/A31 - Telephone, Telegraph, Telegram, Etc. 26,974 26,748 26,632 27,764 1,131 4.232 - Rentals - Land and Structures 124,940 -12 0 0 0 N/A33 - Janitorial Services 30 0 0 0 0 N/A34 - Security Services 21 0 0 0 0 N/A35 - Occupancy Fixed Costs 37 0 0 0 0 N/A40 - O<strong>the</strong>r Services and Charges 138 120 1 81 80 6,516.870 - Equipment and Equipment Rental 20 3 0 30 30 N/ASubtotal Nonpersonal Services (NPS) 249,895 27,121 26,640 27,904 1,264 4.7Gross Funds 254,495 31,708 31,056 32,638 1,582 5.1*Percent change is based on whole dollars.FY 2013 Proposed <strong>Budget</strong> and <strong>Financial</strong> Plan<strong>Office</strong> <strong>of</strong> Finance and Resource ManagementA-95
Program DescriptionThe <strong>Office</strong> <strong>of</strong> Finance and Resource Management operates through <strong>the</strong> following 3 programs:<strong>Financial</strong> Management – provides financial management services to enable agencies to accomplish programmaticgoals and ensure financial health and positive recognition <strong>of</strong> <strong>the</strong> agency and <strong>the</strong> District <strong>of</strong> Columbia government.This program contains <strong>the</strong> following 4 activities:■ Accounting – provides accounts payable and accounts receivable services to cluster agencies; processes all vendorinvoice payments ensuring that <strong>the</strong> provisions <strong>of</strong> <strong>the</strong> District’s Quick Payment Act are adhered to; reconcilesall agency-controlled cash accounts; processes all check payments and cash receipts within 24 hours;processes accounting journal entries for cluster agencies and records all financial events in <strong>the</strong> accounting systemwithin <strong>the</strong> required timeframes; manages and directs <strong>the</strong> monthly, interim, and annual closings; and completescash draw downs for agencies with federal grant programs;■ <strong>Budget</strong> Formulation and Planning – provides and develops <strong>the</strong> annual budgets in conjunction with <strong>the</strong> clusteragencies; provides budget execution, financial analysis, forecasting, and reporting functions on behalf <strong>of</strong> <strong>the</strong>agencies in <strong>the</strong> cluster; and approves and tracks all agency obligations and commitments;■ Grants – provides budget modifications and reprogrammings; monitors grant expiration dates in order to limit<strong>the</strong> occurrence <strong>of</strong> lapsed grants; and completes required grant budget and expenditure reports; and■ Fixed Costs – provides timely and accurate fixed costs payments to District vendors and ensures that expendituresare accurately billed to <strong>the</strong> applicable cluster agency.Resource Management – performs due diligence analysis to identify financial waste and abuse and accounts for <strong>the</strong>use <strong>of</strong> all dollars expended from budgets <strong>of</strong> client agencies that are related to fixed costs.<strong>Agency</strong> Management – provides for administrative support and <strong>the</strong> required tools to achieve operational and programmaticresults. This program is standard for all agencies using <strong>the</strong> performance-based budgeting.Program Structure ChangeThe <strong>Office</strong> <strong>of</strong> Finance and Resource Management has no program structure changes in <strong>the</strong> FY 2013 proposed budget.<strong>Office</strong> <strong>of</strong> Finance and Resource ManagementA-96FY 2013 Proposed <strong>Budget</strong> and <strong>Financial</strong> Plan
FY 2013 Proposed Operating <strong>Budget</strong> and FTEs, by Program and ActivityTable AS0-4 contains <strong>the</strong> proposed FY 2013 budget by program and activity compared to <strong>the</strong> FY 2012 approved budget.It also provides <strong>the</strong> FY 2011 actual data.Table AS0-4(dollars in thousands)Dollars in ThousandsFull-Time EquivalentsChangeChangeActual Approved Proposed from Actual Approved Proposed fromProgram/Activity FY 2011 FY 2012 FY 2013 FY 2012 FY 2011 FY 2012 FY 2013 FY 2012(1000) <strong>Agency</strong> Management Program(1030) Property Management 13,967 15,154 15,085 -69 0.0 0.0 0.0 0.0(1050) <strong>Financial</strong> Management 132 6 60 54 0.0 0.0 0.0 0.0(1070) Fleet Management 4 1 1 0 0.0 0.0 0.0 0.0(1080) Communications 560 560 601 41 6.5 5.6 5.6 0.0(1100) <strong>Office</strong> <strong>of</strong> Finance and Resource Management 0 0 0 0 0.0 0.0 0.0 0.0Subtotal (1000) <strong>Agency</strong> Management Program 14,662 15,721 15,747 26 6.5 5.6 5.6 0.0(2000) <strong>Financial</strong> Management(2100) Accounting 1,245 1,246 1,425 179 16.1 12.6 14.0 1.4(2200) <strong>Budget</strong> Formulations and Planning 1,842 1,902 2,012 110 15.6 16.8 16.4 -0.4(2300) Grants 87 53 89 36 1.0 1.0 1.0 0.0(2400) Capital 314 68 0 -68 3.4 1.0 0.0 -1.0(2500) Fixed Costs 13,020 11,478 12,678 1,200 0.0 0.0 0.0 0.0Subtotal (2000) <strong>Financial</strong> Management 16,509 14,747 16,204 1,458 36.1 31.4 31.4 0.0(3000) Resource Management(3100) Resource Management 538 588 687 99 4.9 5.0 5.0 0.0Subtotal (3000) Resource Management 538 588 687 99 4.9 5.0 5.0 0.0Total Proposed Operating <strong>Budget</strong> 31,708 31,056 32,638 1,582 47.5 42.0 42.0 0.0(Change is calculated by whole numbers and numbers may not add up due to rounding)Note: For more detailed information regarding <strong>the</strong> proposed funding for <strong>the</strong> activities within this agency’s programs, please see Schedule 30-PBBProgram Summary by Activity in <strong>the</strong> FY 2013 Operating Appendices located on <strong>the</strong> <strong>Office</strong> <strong>of</strong> <strong>the</strong> <strong>Chief</strong> <strong>Financial</strong> <strong>Office</strong>r’s website.FY 2013 Proposed <strong>Budget</strong> and <strong>Financial</strong> Plan<strong>Office</strong> <strong>of</strong> Finance and Resource ManagementA-97
FY 2013 Proposed <strong>Budget</strong> ChangesThe <strong>Office</strong> <strong>of</strong> Finance and Resource Management’s (OFRM) proposed FY 2013 gross budget is $32,637,894,which represents a 5.1 percent increase over its FY 2012 approved gross budget <strong>of</strong> $31,056,301. The budget iscomprised <strong>of</strong> $19,373,140 in Local funds, $293,542 in Special Purpose Revenue funds, and $12,971,212 in Intra-District funds. The proposed FY 2013 budget reflects <strong>the</strong> OFRM’s commitment to provide financial and resourcemanagement services to various District <strong>of</strong> Columbia government agencies.The agency has budgeted $27,763,542 in District-wide telecom costs, including landline, wireless and data servicesfor many District agencies. The $27,763,542 includes $15,085,464 in Local funds, $293,542 in SpecialPurpose Revenue funds, and $12,384,536 in Intra-District funds collected from o<strong>the</strong>r agencies.To simplify and improve cost accounting for telecommunications costs, Local funds for telecommunicationsfor most agencies have been budgeted directly in OFRM. In prior years, about 70 agencies budgeted for telecomcosts individually and <strong>the</strong>n transferred funds to OFRM during <strong>the</strong> fiscal year. Agencies that pay for telecommunicationsservices using Special Purpose Revenue or Federal funds will continue to budget for <strong>the</strong>se costs within <strong>the</strong>agency budget and transfer funds to OFRM in FY 2013.Current Services Funding LevelThe Current Services Funding Level (CSFL) is a Local funds ONLY representation <strong>of</strong> <strong>the</strong> true cost <strong>of</strong> operatingDistrict agencies, before consideration <strong>of</strong> policy decisions. The CSFL reflects changes from <strong>the</strong> FY 2012 approvedbudget across multiple programs, and it estimates how much it would cost an agency to continue its current programsand operations into <strong>the</strong> following fiscal year. The initial adjustments in <strong>the</strong> budget proposal representchanges that should be compared to <strong>the</strong> FY 2013 CSFL budget and not necessarily changes made to <strong>the</strong> FY 2012Local funds budget. The FY 2013 CSFL adjustments to <strong>the</strong> FY 2012 Local funds budget are described in table 5<strong>of</strong> this agency's budget chapter. Please see <strong>the</strong> CSFL Development section within Volume 1: Executive Summaryfor more information regarding <strong>the</strong> methodology used and components that comprise <strong>the</strong> CSFL.OFRMs’ FY 2013 CSFL budget is $19,133,765, which represents a $65,761 or 0.3 percent, increase over <strong>the</strong>FY 2012 Approved Local funds budget <strong>of</strong> $19,068,004.Initial Adjusted <strong>Budget</strong>Technical Adjustment: $1,361,106 was added for <strong>the</strong> Local portion <strong>of</strong> Telecom transferred from <strong>the</strong> Department<strong>of</strong> Transportation, and $1,139,086 was reduced for <strong>the</strong> Local Telecom budget for <strong>the</strong> <strong>Office</strong> <strong>of</strong> UnifiedCommunications (OUC). OFRM will receive those funds via Intra-District from <strong>the</strong> OUC E911 Fund.Shift: The agency’s proposed budget moves 0.3 FTE from Local funds to Intra-District funds in <strong>the</strong> <strong>Agency</strong>Management program.Cost Increase: To address <strong>the</strong> increasing demands for telecommunications resources, <strong>the</strong> agency proposes toincrease Telecom by $67,504 in Special Purpose Revenue funds and $1,132,435 in Intra-District funds from OUCbased on current estimates from <strong>the</strong> <strong>Office</strong> <strong>of</strong> <strong>the</strong> <strong>Chief</strong> Technology <strong>Office</strong>r (OCTO). The agency also proposedan increase <strong>of</strong> $75,139 in Intra-District funds for personal services costs attributed to step and Fringe Benefitincreases.Additionally Adjusted <strong>Budget</strong>Technical Adjustment: Adjustment <strong>of</strong> Fringe Benefits to reverse a 72 percent District Government contributionfor employee health insurance implemented in <strong>the</strong> FY 2011 budget, to 75 percent in FY 2013, resulting in anincrease <strong>of</strong> $17,355 in Local funds and $1,380 in Intra-District funds.<strong>Office</strong> <strong>of</strong> Finance and Resource ManagementA-98FY 2013 Proposed <strong>Budget</strong> and <strong>Financial</strong> Plan
FY 2012 Approved <strong>Budget</strong> to FY 2013 Proposed <strong>Budget</strong>, by Revenue TypeTable AS0-5 itemizes <strong>the</strong> changes by revenue type between <strong>the</strong> FY 2012 approved budget and <strong>the</strong> FY 2013 proposedbudget.Table AS0-5(dollars in thousands)PROGRAM BUDGET FTELOCAL FUNDS: FY 2012 Approved <strong>Budget</strong> and FTE 19,068 37.6Consumer Price Index (less than $500) Multiple Programs 0 0.0Fringe Benefit Rate Adjustment Multiple Programs 50 0.0Personal Services Growth Factor Multiple Programs 16 0.0FY 2013 Current Services Funding Level <strong>Budget</strong> (CSFL) 19,134 37.6Technical Adjustments: Transfer in from Department <strong>of</strong> Transportation <strong>Agency</strong> Management Program 1,361 0.0for TelecomTechnical Adjustments: Reduction to Telecom <strong>Agency</strong> Management Program -1,139 0.0Shift: Move to Intra-District <strong>Agency</strong> Management Program 0 -0.3FY 2013 Initial Adjusted <strong>Budget</strong> 19,356 37.4Technical Adjustment: Health insurance contribution Multiple Programs 17 0.0FY 2013 Additionally Adjusted <strong>Budget</strong> 19,373 37.4LOCAL FUNDS: FY 2013 Proposed <strong>Budget</strong> and FTE 19,373 37.4SPECIAL PURPOSE REVENUE FUNDS: FY 2012 Approved <strong>Budget</strong> and FTE 226 0.0Cost Increase: Telecom fixed costs for District Enterprise agencies <strong>Financial</strong> Management 68 0.0FY 2013 Initial Adjusted <strong>Budget</strong> 294 0.0SPECIAL PURPOSE REVENUE FUNDS: FY 2013 Proposed <strong>Budget</strong> and FTE 294 0.0INTRA-DISTRICT FUNDS: FY 2012 Approved <strong>Budget</strong> and FTE 11,762 4.4Cost Increase: Step increases and associated Fringe Benefits <strong>Financial</strong> Management 75 0.0Cost Increase: Telecom fixed costs <strong>Financial</strong> Management 1,132 0.0Shift: From Local funds <strong>Agency</strong> Management Program 0 0.3FY 2013 Initial Adjusted <strong>Budget</strong> 12,970 4.6Technical Adjustment: Health insurance contribution Multiple Programs 1 0.0FY 2013 Additionally Adjusted <strong>Budget</strong> 12,971 4.6INTRA-DISTRICT FUNDS: FY 2013 Proposed <strong>Budget</strong> and FTE 12,971 4.6Gross for AS0 - <strong>Office</strong> <strong>of</strong> Finance and Resource Management 32,638 42.0(Change is calculated by whole numbers and numbers may not add up due to rounding)FY 2013 Proposed <strong>Budget</strong> and <strong>Financial</strong> Plan<strong>Office</strong> <strong>of</strong> Finance and Resource ManagementA-99
<strong>Office</strong> <strong>of</strong> Contractingand Procurementwww.ocp.dc.govTelephone: 202-727-0252(PO0)% ChangeFY 2011 FY 2012 FY 2013 fromDescription Actual Approved Proposed FY 2012Operating <strong>Budget</strong> $24,568,098 $8,697,582 $8,970,555 3.1FTEs 87.7 84.0 85.0 1.2The mission <strong>of</strong> <strong>the</strong> <strong>Office</strong> <strong>of</strong> Contracting and Procurement(OCP) is to partner with vendors and District agencies to purchasequality goods and services in a timely manner and at a reasonablecost while ensuring that all purchasing actions are conductedfairly and impartially.Summary <strong>of</strong> ServicesOCP purchases approximately $2.0 billion <strong>of</strong> goods and services on behalf <strong>of</strong> more than 60 different District agenciesand programs. OCP buying teams include goods, services, transportation and specialty equipment, and informationtechnology. The agency provides oversight and monitoring <strong>of</strong> agencies with delegated contracting authority,provides contract administration support, and manages <strong>the</strong> District’s Purchase Card program. OCP also providessurplus property management for District agencies.The agency’s FY 2013 proposed budget is presented in <strong>the</strong> following tables:FY 2013 Proposed <strong>Budget</strong> and <strong>Financial</strong> Plan<strong>Office</strong> <strong>of</strong> Contracting and ProcurementA-101
FY 2013 Proposed Gross Funds Operating <strong>Budget</strong>, by Revenue TypeTable PO0-1 contains <strong>the</strong> proposed FY 2013 agency budget compared to <strong>the</strong> FY 2012 approved budget. It alsoprovides FY 2010 and FY 2011 actual expenditures.Table PO0-1(dollars in thousands)ChangeActual Actual Approved Proposed from PercentAppropriated Fund FY 2010 FY 2011 FY 2012 FY 2013 FY 2012 Change*General FundLocal Funds 2,775 8,294 8,698 8,971 273 3.1Special Purpose Revenue Funds 523 1,189 0 0 0 N/ATotal for General Fund 3,298 9,483 8,698 8,971 273 3.1Intra-District FundsIntra-District Funds 22,030 15,085 0 0 0 N/ATotal for Intra-District Funds 22,030 15,085 0 0 0 N/AGross Funds 25,328 24,568 8,698 8,971 273 3.1*Percent change is based on whole dollars.Note: If applicable, for a breakdown <strong>of</strong> each Grant (Federal and Private), Special Purpose Revenue type and Intra-District agreement,please refer to Schedule 80 <strong>Agency</strong> Summary by Revenue Source in <strong>the</strong> FY 2013 Operating Appendices located on <strong>the</strong> <strong>Office</strong> <strong>of</strong> <strong>the</strong><strong>Chief</strong> <strong>Financial</strong> <strong>Office</strong>r’s website.FY 2013 Proposed Full-Time Equivalents, by Revenue TypeTable PO0-2 contains <strong>the</strong> proposed FY 2013 FTE level compared to <strong>the</strong> FY 2012 approved FTE level by revenuetype. It also provides FY 2010 and FY 2011 actual data.Table PO0-2ChangeActual Actual Approved Proposed from PercentAppropriated Fund FY 2010 FY 2011 FY 2012 FY 2013 FY 2012 ChangeGeneral FundLocal Funds 21.6 79.1 84.0 85.0 1.0 1.2Special Purpose Revenue Funds 3.8 8.6 0.0 0.0 0.0 N/ATotal for General Fund 25.4 87.7 84.0 85.0 1.0 1.2Intra-District FundsIntra-District Funds 77.1 0.0 0.0 0.0 0.0 N/ATotal for Intra-District Funds 77.1 0.0 0.0 0.0 0.0 N/ATotal Proposed FTEs 102.5 87.7 84.0 85.0 1.0 1.2<strong>Office</strong> <strong>of</strong> Contracting and ProcurementA-102FY 2013 Proposed <strong>Budget</strong> and <strong>Financial</strong> Plan
FY 2013 Proposed Operating <strong>Budget</strong>, by Comptroller Source GroupTable PO0-3 contains <strong>the</strong> proposed FY 2013 budget at <strong>the</strong> Comptroller Source Group (object class) level comparedto FY 2012 approved budget. It also provides FY 2010 and FY 2011 actual expenditures.Table PO0-3(dollars in thousands)ChangeActual Actual Approved Proposed from PercentComptroller Source Group FY 2010 FY 2011 FY 2012 FY 2013 FY 2012 Change*11 - Regular Pay - Continuing Full Time 6,133 6,162 6,354 6,613 259 4.112 - Regular Pay - O<strong>the</strong>r 990 626 469 195 -274 -58.413 - Additional Gross Pay 295 694 0 0 0 N/A14 - Fringe Benefits - Current Personnel 1,289 1,296 1,386 1,505 119 8.615 - Overtime Pay 28 3 0 0 0 N/ASubtotal Personal Services (PS) 8,735 8,781 8,209 8,313 104 1.320 - Supplies and Materials 45 48 65 46 -19 -28.930 - Energy, Comm. and Building Rentals 244 0 0 0 0 N/A31 - Telephone, Telegraph, Telegram, Etc. 148 8 0 0 0 N/A33 - Janitorial Services 101 0 0 0 0 N/A34 - Security Services 90 0 0 0 0 N/A35 - Occupancy Fixed Costs 150 0 0 0 0 N/A40 - O<strong>the</strong>r Services and Charges 15,500 15,550 194 284 90 46.141 - Contractual Services - O<strong>the</strong>r 215 71 100 175 75 75.070 - Equipment and Equipment Rental 101 110 130 153 23 18.0Subtotal Nonpersonal Services (NPS) 16,593 15,787 488 658 169 34.6Gross Funds 25,328 24,568 8,698 8,971 273 3.1*Percent change is based on whole dollars.FY 2013 Proposed <strong>Budget</strong> and <strong>Financial</strong> Plan<strong>Office</strong> <strong>of</strong> Contracting and ProcurementA-103
Division DescriptionThe <strong>Office</strong> <strong>of</strong> Contracting and Procurement operates through <strong>the</strong> following 5 divisions:Procurement – provides acquisition services to District agencies in accordance with District laws and regulationsfor <strong>the</strong> supplies, equipment, and services needed to support agencies’ missions and objectives.This division contains <strong>the</strong> following 6 activities:■ Information Technology – includes <strong>the</strong> acquisition <strong>of</strong> s<strong>of</strong>tware and hardware as well as technology services;■ Procurement Management and Support – provides oversight and project management;■ Goods – includes <strong>the</strong> acquisition <strong>of</strong> public safety equipment, <strong>of</strong>fice supplies and equipment, uniforms, andrecreational and promotional items;■ Services – includes <strong>the</strong> acquisition <strong>of</strong> legal, financial, training, and health and human services;■ Transportation and Specialty Equipment - includes <strong>the</strong> acquisition <strong>of</strong> vehicles and o<strong>the</strong>r specialty equipment;and■ Purchase Card – provides overall oversight and administration <strong>of</strong> <strong>the</strong> District’s Purchase Cards used in agencies.The Purchase Card provides an alternative delegated procurement vehicle that reduces <strong>the</strong> processing costand delivery time for purchases under $2,500.Administration and Support – provides internal administrative and operational support to <strong>the</strong> agency as well ascustomer service, resource management, surplus and property management.This division contains <strong>the</strong> following 5 activities:■ Surplus Property – provides surplus property management, re-utilization, and disposal services to District agencies;■ Support Services – includes agency acquisition services, facilities management, front desk support, and recordsmanagement;■ Customer Service and Communications – manages <strong>the</strong> agency’s web site, produces electronic and print publications,corresponds with constituents and vendors, responds to media inquiries, staffs <strong>the</strong> agency’s customerservice phone lines, ensures compliance with language access laws and regulations, and publishes articles andnews releases;■ Resource Management – manages all human resource functions including recruitment, retention, and staffdevelopment; and■ Procurement Training – provides internal training for procurement and external training to all Districtemployees on general procurement practices and laws as well as training for <strong>the</strong> Procurement AutomatedSupport System (PASS).Procurement Technology – provides consultative and technical support to agencies, vendors and OCP buyers, andsupport and includes user training and report generation.Procurement Integrity and Compliance – initiates and conducts independent operational performance audits andbusiness process improvement reviews <strong>of</strong> existing procurement functions.<strong>Office</strong> <strong>of</strong> Contracting and ProcurementA-104FY 2013 Proposed <strong>Budget</strong> and <strong>Financial</strong> Plan
This division contains <strong>the</strong> following 2 activities:■ Integrity and Compliance – initiates and conducts independent operational performance audits and liaiseswith external auditors for OCP’s compliance with <strong>the</strong> Comprehensive Annual <strong>Financial</strong> Report (CAFR); and■ Contract Administration and Analysis – provides agency goal development and monitoring, analysis, and projectmanagement; and includes <strong>the</strong> green purchasing program.<strong>Agency</strong> Management Program – provides for administrative support and <strong>the</strong> required tools to achieve operationaland programmatic results. This division is standard for all agencies using performance-based budgeting.Division Structure ChangeThe <strong>Office</strong> <strong>of</strong> Contracting and Procurement eliminates one division and adds one division in <strong>the</strong> FY 2013 proposedbudget. Table 4 depicts <strong>the</strong> new FY 2013 agency structure.FY 2013 Proposed <strong>Budget</strong> and <strong>Financial</strong> Plan<strong>Office</strong> <strong>of</strong> Contracting and ProcurementA-105
FY 2013 Proposed Operating <strong>Budget</strong> and FTEs, by Division and ActivityTable PO0-4 contains <strong>the</strong> proposed FY 2013 budget by division and activity compared to <strong>the</strong> FY 2012 approved budget.It also provides <strong>the</strong> FY 2011 actual data.Table PO0-4(dollars in thousands)Dollars in ThousandsFull-Time EquivalentsChangeChangeActual Approved Proposed from Actual Approved Proposed fromDivision/Activity FY 2011 FY 2012 FY 2013 FY 2012 FY 2011 FY 2012 FY 2013 FY 2012(1000) <strong>Agency</strong> Management Program(1010) Personnel -3 0 0 0 0.0 0.0 0.0 0.0(1015) Training and Employee Development 22 69 40 -29 0.0 0.0 0.0 0.0(1020) Contracting and Procurement 15,343 130 243 113 0.0 0.0 0.0 0.0(1040) Information Technology 119 51 80 29 0.0 0.0 0.0 0.0(1070) Fleet Management 19 22 14 -8 0.0 0.0 0.0 0.0(1085) Customer Service -1 0 0 0 0.0 0.0 0.0 0.0(1087) Language Access 15 0 0 0 0.0 0.0 0.0 0.0(1090) Performance Management 446 432 383 -50 5.2 4.0 3.0 -1.0Subtotal (1000) <strong>Agency</strong> Management Program 15,960 705 760 55 5.2 4.0 3.0 -1.0(2000) Procurement(2010) Procurement Management and Support 1,071 690 243 -448 4.3 7.0 2.0 -5.0(2015) Information Technology 796 700 940 240 11.4 7.0 9.0 2.0(2020) Goods 1,285 1,076 528 -548 11.3 12.0 6.0 -6.0(2030) Services 1,859 1,902 2,410 507 20.2 19.0 24.0 5.0(2040) Transportation and Special Equipment 214 263 257 -6 3.5 4.0 4.0 0.0(2055) Purchase Card -50 0 199 199 0.0 0.0 2.0 2.0Subtotal (2000) Procurement 5,175 4,631 4,576 -55 50.8 49.0 47.0 -2.0(3000) Procurement Integrity and Compliance(3010) Procurement Integrity and Compliance 672 793 456 -337 6.2 7.0 4.0 -3.0(3020) Contract Administration and Analysis 0 0 292 292 0.0 0.0 3.0 3.0Subtotal (3000) Procurement Integrity and Compliance 672 793 748 -45 6.2 7.0 7.0 0.0(4000) Administration and Support(4010) Surplus Property 719 541 823 282 4.7 4.0 6.0 2.0(4015) Vendor Relations 22 0 0 0 0.0 0.0 0.0 0.0(4020) Support Services 1,031 837 577 -261 11.3 9.0 6.0 -3.0(4030) Customer Service and Communications 0 0 459 459 0.0 0.0 6.0 6.0(4040) Resource Management 0 0 336 336 0.0 0.0 3.0 3.0(4050) Procurement Training 0 0 260 260 0.0 0.0 3.0 3.0Subtotal (4000) Administration and Support 1,772 1,378 2,455 1,077 16.0 13.0 24.0 11.0(5000) Performance Management(5010) Contract Administration 24 0 0 0 0.9 0.0 0.0 0.0(5015) Technology Support 470 488 0 -488 3.5 5.0 0.0 -5.0(5020) Communications and Customer Service 211 126 0 -126 1.8 1.0 0.0 -1.0(5030) Special Projects and Analysis 194 485 0 -485 2.6 4.0 0.0 -4.0(5040) Purchase Card 90 91 0 -91 0.8 1.0 0.0 -1.0Subtotal (5000) Performance Management 989 1,191 0 -1,191 9.6 11.0 0.0 -11.0(6000) Procurement Technology(6010) Technology Support 0 0 431 431 0.0 0.0 4.0 4.0Subtotal (6000) Procurement Technology 0 0 431 431 0.0 0.0 4.0 4.0Total Proposed Operating <strong>Budget</strong> 24,568 8,698 8,971 273 87.7 84.0 85.0 1.0(Change is calculated by whole numbers and numbers may not add up due to rounding)Note: For more detailed information regarding <strong>the</strong> proposed funding for <strong>the</strong> activities within this agency’s divisions, please see Schedule 30-PBBProgram Summary by Activity in <strong>the</strong> FY 2013 Operating Appendices located on <strong>the</strong> <strong>Office</strong> <strong>of</strong> <strong>the</strong> <strong>Chief</strong> <strong>Financial</strong> <strong>Office</strong>r’s website.<strong>Office</strong> <strong>of</strong> Contracting and ProcurementA-106FY 2013 Proposed <strong>Budget</strong> and <strong>Financial</strong> Plan
FY 2013 Proposed <strong>Budget</strong> ChangesThe <strong>Office</strong> <strong>of</strong> Contracting and Procurement’s (OCP) proposed FY 2013 gross budget is $8,970,555, which representsa 3.1 percent increase over its FY 2012 approved gross budget <strong>of</strong> $8,697,582. The budget is comprisedentirely <strong>of</strong> Local funds.Current Service Funding LevelThe Current Services Funding Level (CSFL) is a Local funds ONLY representation <strong>of</strong> <strong>the</strong> true cost <strong>of</strong> operatingDistrict agencies, before consideration <strong>of</strong> policy decisions. The CSFL reflects changes from <strong>the</strong> FY 2012 approvedbudget across multiple programs, and it estimates how much it would cost an agency to continue its current programsand operations into <strong>the</strong> following fiscal year. The initial adjustments in <strong>the</strong> budget proposal represent changesthat should be compared to <strong>the</strong> FY 2013 CSFL budget and not necessarily changes made to <strong>the</strong> FY 2012 Localfunds budget. The FY 2013 CSFL adjustments to <strong>the</strong> FY 2012 Local funds budget are described in table 5 <strong>of</strong> thisagency's budget chapter. Please see <strong>the</strong> CSFL Development section within Volume 1: Executive Summary for moreinformation regarding <strong>the</strong> methodology used and components that comprise <strong>the</strong> CSFL.OCP's FY 2013 CSFL budget is $8,838,502, which represents a $140,920, or 1.6 percent, increase over <strong>the</strong>FY 2012 approved Local funds budget <strong>of</strong> $8,697,582.Initial Adjusted <strong>Budget</strong>Cost Increase: $159,318 to nonpersonal services for an increase in O<strong>the</strong>r Services and Charges, ContractualServices, and Equipment and Equipment Rental.Cost Decrease: $159,318 from personal services - term employees to <strong>of</strong>fset <strong>the</strong> increase in nonpersonal services.Additionally Adjusted <strong>Budget</strong>Technical Adjustment: Adjustment <strong>of</strong> Fringe Benefits to restore <strong>the</strong> District Government contribution for employeehealth insurance from 72 percent, implemented in <strong>the</strong> FY 2011 budget, to 75 percent in FY 2013, resulting inan increase <strong>of</strong> $32,053 in Local funds.Policy InitiativeCost Increase: $100,000 and 1.0 FTE were added in <strong>the</strong> Procurement Division to implement <strong>the</strong> use <strong>of</strong> VirtualCredit Cards as a payment vehicle.FY 2013 Proposed <strong>Budget</strong> and <strong>Financial</strong> Plan<strong>Office</strong> <strong>of</strong> Contracting and ProcurementA-107
FY 2012 Approved <strong>Budget</strong> to FY 2013 Proposed <strong>Budget</strong>, by Revenue TypeTable PO0-5 itemizes <strong>the</strong> changes by revenue type between <strong>the</strong> FY 2012 approved budget and <strong>the</strong> FY 2013 proposedbudget.Table PO0-5(dollars in thousands)PROGRAM BUDGET FTELOCAL FUNDS: FY 2012 Approved <strong>Budget</strong> and FTE 8,698 84.0Consumer Price Index Multiple Programs 10 0.0Fringe Benefit Rate Adjustment Multiple Programs 97 0.0Personal Services Growth Factor Multiple Programs 34 0.0FY 2013 Current Services Funding Level <strong>Budget</strong> (CSFL) 8,839 84.0Cost Increase: To O<strong>the</strong>r Services and Charges, Contractual Multiple Programs 159 0.0Services, and Equipment and Equipment RentalCost Decrease: To personal services cost to <strong>of</strong>fset Multiple Programs -159 0.0increase in nonpersonal servicesFY 2013 Initial Adjusted <strong>Budget</strong> 8,839 84.0Technical Adjustment: Health insurance contribution Multiple Programs 32 0.0FY 2013 Additionally Adjusted <strong>Budget</strong> 8,871 84.0FY 2013 Policy InitiativesCost Increase: To implement <strong>the</strong> use <strong>of</strong> Virtual Cards Procurement 100 1.0as a payment vehicle initiativeLOCAL FUNDS: FY 2013 Proposed <strong>Budget</strong> and FTE 8,971 85.0Gross for PO0 - <strong>Office</strong> <strong>of</strong> Contracting and Procurement 8,971 85.0(Change is calculated by whole numbers and numbers may not add up due to rounding)<strong>Office</strong> <strong>of</strong> Contracting and ProcurementA-108FY 2013 Proposed <strong>Budget</strong> and <strong>Financial</strong> Plan
<strong>Agency</strong> Performance PlanThe agency has <strong>the</strong> following objectives and performance indicators for <strong>the</strong>ir divisions:1. Procurement DivisionObjective 1: Streamline and simplify <strong>the</strong> procurement process.Objective 2: Increase accountability through transparency and compliance with governing laws and policies.Objective 3: Provide effective customer guidance and education in a responsive and pr<strong>of</strong>essional manner.ProcurementFY 2010 FY 2011 FY 2011 FY 2012 FY 2013 FY 2014Measure Actual Target Actual Projection Projection ProjectionDollar amount <strong>of</strong> central purchasing<strong>of</strong>fice purchases per FTE (in millions) 1 $11.9 $12 $19.3 $20.0 $21.0 $22.0Not NotTotal number <strong>of</strong> term contract vehicles 2 2 2 2 6 Available AvailableNotPercentage <strong>of</strong> EPP term contract vehicles Available 2% 2% 4% 6% 6%Number <strong>of</strong> newly active vendors insourcing module 1,747 2,000 3,962 2,000 2,100 2,200Number <strong>of</strong> functional catalogs in PASS Not NotAvailable Available 2 6 8 10FY 2013 Proposed <strong>Budget</strong> and <strong>Financial</strong> Plan<strong>Office</strong> <strong>of</strong> Contracting and ProcurementA-109
2. Operations and Support DivisionObjective 1: Streamline and simplify <strong>the</strong> procurement process.Objective 2: Streamline and simplify <strong>the</strong> on-line auction process to increase revenue.Objective 3: Increase use and residual revenue from Purchase Card program.Operations and Support DivisionFY 2010 FY 2011 FY 2011 FY 2012 FY 2013 FY 2014Measure Actual Target Actual Projection Projection ProjectionPercentage <strong>of</strong> OCP customers rating OCPsatisfactory or better 3 44% 75% 75% 75% 85% 95%Percentage <strong>of</strong> purchasing conducted with Purchasing Cards 4 1.3% 1.5% .36% 1.5% 1.5% 1.5%Purchase Card utilization rate (based on totaleligible purchases under $2500) 93% 95% 90.04% 100% 100% 100%Number <strong>of</strong> certified participants who canNotreceive surplus property Available 25 32 38 46 55Number <strong>of</strong> pounds processed for recyclingNotprogram (thousands <strong>of</strong> pounds) Available 27 32 64 75 85Total dollar revenue generated/collected by SPD(millions <strong>of</strong> dollars) $.402 $.700 $1.02 $1.2 $1.5 $2.0Dollar Value <strong>of</strong> excess property recycled toDistrict agencies for re-use (millions <strong>of</strong> dollars) $.819 $.900 $2.5 $3.5 $4.0 $4.5<strong>Office</strong> <strong>of</strong> Contracting and ProcurementA-110FY 2013 Proposed <strong>Budget</strong> and <strong>Financial</strong> Plan
3. Resource Management DivisionObjective 1: Create a procurement training institute that will provide a comprehensive training curriculum for allDC government procurement staff.Objective 2: Working with <strong>the</strong> University <strong>of</strong> <strong>the</strong> District <strong>of</strong> Columbia (UDC) to develop and deliver procurementindustry certification programs.Objective 3: Fill a minimum <strong>of</strong> 85 percent <strong>of</strong> budgeted staff positions. Completion date – June 2012.Objective 4: Research, develop and pilot employee performance measures for 50 percent <strong>of</strong> OCP positions.Completion Date – June 2012.Resource Management DivisionFY 2010 FY 2011 FY 2011 FY 2012 FY 2013 FY 2014Measure Actual Target Actual Projection Projection ProjectionNumber <strong>of</strong> new training courses developed and delivered Not Not NotAvailable Available Available 10 20 30Percentage <strong>of</strong> staff covered by standardized Not Not Notperformance measures Available Available Available 50% 100% 100%Percentage <strong>of</strong> budgeted staff hired by December 2012 Not Not NotAvailable Available Available 85% 100% 100%Number <strong>of</strong> working days for external Not Not Notrecruitment 5 Available Available Available 35 30 25FY 2013 Proposed <strong>Budget</strong> and <strong>Financial</strong> Plan<strong>Office</strong> <strong>of</strong> Contracting and ProcurementA-111
4. Technology DivisionObjective 1: Communication and trainingObjective 2: New real-time Ariba category management module in PASS.Objective 3: Information distribution to internal and external customers via web portals.Technology DivisionFY 2010 FY 2011 FY 2011 FY 2012 FY 2013 FY 2014Measure Actual Target Actual Projection Projection ProjectionPercentage <strong>of</strong> total number <strong>of</strong> issues resolved Not Not Notfrom all customers within 8 hours (HELP DESK) 6 Available Available Available 80% 80% 80%Percentage <strong>of</strong> total number <strong>of</strong> improvements andenhancement to <strong>the</strong> PASS/eSourcing application Not Not Notsubmitted to OCTO implemented within 30 days Available Available Available 90% 90% 90%Percentage <strong>of</strong> total number <strong>of</strong> intranet and Not Not Notinternet updates completed within 24 hours Available Available Available 100% 100% 100%Percentage <strong>of</strong> internal overall customer Not Not Notsatisfaction <strong>of</strong> PASS/eSourcing support Available Available Available 100% 100% 100%Percentage <strong>of</strong> network updates, maintenance, or Not Not Notchanges completed when scheduled within Available Available Available 80% 80% 80%time allocated 7<strong>Office</strong> <strong>of</strong> Contracting and ProcurementA-112FY 2013 Proposed <strong>Budget</strong> and <strong>Financial</strong> Plan
5. <strong>Office</strong> <strong>of</strong> Procurement Integrity & Compliance (OPIC)Objective 1: Increase compliance with District procurement laws and regulations.Objective 2: Systematize enterprise-wide risk assessments and response.<strong>Office</strong> <strong>of</strong> Procurement Integrity and Compliance (OPIC)FY 2010 FY 2011 FY 2011 FY 2012 FY 2013 FY 2014Measure Actual Target Actual Projection Projection ProjectionNumber <strong>of</strong> compliance reviews and Not Notaudit reports Issued Available Available 16 Baseline TBD TBDAverage number <strong>of</strong> days to complete a Not Not Notcompliance review/audit Available Available Available Baseline TBD TBDPercentage <strong>of</strong> sole source emergency and Not Not Notmillion dollar contracts audited Available Available Available 100% 100% 100%Percentage <strong>of</strong> OCP contracting <strong>of</strong>ficer Not Not Notoperations reviewed/audited Available Available Available Baseline TBD TBDPercentage <strong>of</strong> agency contracting <strong>of</strong>ficer Not Notoperations reviewed/audited Available Available 100% 20% TBD TBDPerformance Plan Endnotes:1. This is an industry standard. According to <strong>the</strong> FY 2010 ICMA Center for Performance Measurement, <strong>the</strong> average Dollar Amount <strong>of</strong>Central Purchasing <strong>Office</strong> Purchases per FTE was $15.71 million based on responses from 38 jurisdictions.2. OCP will assess <strong>the</strong> appropriate number <strong>of</strong> term contracts needed to meet <strong>the</strong> District’s needs on an annual basis.Therefore, noout-year projections are available.3. This is an industry standard. According to <strong>the</strong> FY 2010 ICMA Center for Performance Measurement, 76.8 percent <strong>of</strong> respondents(for jurisdictions with a population exceeding 100,000) rated <strong>the</strong>ir respective Procurement Operation’s performance as good toexcellent.4. This is an industry standard. According to <strong>the</strong> FY 2010 ICMA Center for Performance Measurement, <strong>the</strong> median rate <strong>of</strong> PurchaseCard utilization (for jurisdictions with a population exceeding 100,000) is 2.56 percent.5. This is an industry standard. According to <strong>the</strong> FY 2010 ICMA Center for Performance Measurement, <strong>the</strong> mean number <strong>of</strong> workingdays to recruit and place an internal candidate (for jurisdictions with populations exceeding 100,000) was 32.8 days.6. This is an industry standard. According to <strong>the</strong> FY 2010 ICMA Center for Performance Measurement, <strong>the</strong> mean performance forthis metric is 70.3 percent (for jurisdictions with populations exceeding 100,000).7. This is an industry standard. According to <strong>the</strong> FY 2010 ICMA Center for Performance Measurement, <strong>the</strong> mean performance forthis metric is 78.5 percent (for jurisdictions with populations exceeding 100,000).8. All objectives and initiatives adhere to Generally Accepted Government Auditing Standards (GAGAS) established by <strong>the</strong>Comptroller General <strong>of</strong> <strong>the</strong> United States, OPIC’s United States Government Accountability <strong>Office</strong>. These pr<strong>of</strong>essional standardsprovide a framework for performing high quality audit work with competence, integrity, objectivity, and independence.FY 2013 Proposed <strong>Budget</strong> and <strong>Financial</strong> Plan<strong>Office</strong> <strong>of</strong> Contracting and ProcurementA-113
<strong>Office</strong> <strong>of</strong> <strong>the</strong> <strong>Chief</strong> Technology<strong>Office</strong>rwww.octo.dc.govTelephone: 202-727-2277(TO0)% ChangeFY 2011 FY 2012 FY 2013 fromDescription Actual Approved Proposed FY 2012Operating <strong>Budget</strong> $73,131,273 $70,770,173 $77,708,049 9.8FTEs 312.4 310.8 288.2 -7.3Leverage <strong>the</strong> power <strong>of</strong> technology to improve service delivery,drive innovation, and bridge <strong>the</strong> digital divide to build a worldclasscity.Summary <strong>of</strong> ServicesThe <strong>Office</strong> <strong>of</strong> <strong>the</strong> <strong>Chief</strong> Technology <strong>Office</strong>r (OCTO) is <strong>the</strong> central technology organization <strong>of</strong> <strong>the</strong> District <strong>of</strong>Columbia Government. OCTO develops, implements, and maintains <strong>the</strong> District’s technology infrastructure;develops and implements major enterprise applications; establishes and oversees technology policies and standardsfor <strong>the</strong> District; provides technology services and support for District agencies; and develops technology solutionsto improve services to businesses, residents, and visitors in all areas <strong>of</strong> District government.Combining <strong>the</strong>se services into a customer-centered mission-driven organization is <strong>the</strong> responsibility <strong>of</strong> <strong>the</strong><strong>Office</strong> <strong>of</strong> <strong>the</strong> <strong>Chief</strong> Technology <strong>Office</strong>r. Department performance expectations in FY 2013 are listed by functionaldivision.The agency’s FY 2013 proposed budget is presented in <strong>the</strong> following tables:FY 2013 Proposed <strong>Budget</strong> and <strong>Financial</strong> Plan<strong>Office</strong> <strong>of</strong> <strong>the</strong> <strong>Chief</strong> Technology <strong>Office</strong>rA-115
FY 2013 Proposed Gross Funds Operating <strong>Budget</strong>, by Revenue TypeTable TO0-1 contains <strong>the</strong> proposed FY 2013 agency budget compared to <strong>the</strong> FY 2012 approved budget. It alsoprovides FY 2010 and FY 2011 actual expenditures.Table TO0-1(dollars in thousands)ChangeActual Actual Approved Proposed from PercentAppropriated Fund FY 2010 FY 2011 FY 2012 FY 2013 FY 2012 Change*General FundLocal Funds 46,089 29,757 34,249 39,974 5,725 16.7Special Purpose Revenue Funds 3,465 8,813 9,040 10,943 1,903 21.1Total for General Fund 49,553 38,570 43,289 50,917 7,628 17.6Federal ResourcesFederal Grant Funds 561 2,802 2,788 2,498 -289 -10.4Total for Federal Resources 561 2,802 2,788 2,498 -289 -10.4Private FundsPrivate Grant Funds 0 29 0 0 0 N/ATotal for Private Funds 0 29 0 0 0 N/AIntra-District FundsIntra-District Funds 35,807 31,731 24,693 24,292 -401 -1.6Total for Intra-District Funds 35,807 31,731 24,693 24,292 -401 -1.6Gross Funds 85,921 73,131 70,770 77,708 6,938 9.8*Percent change is based on whole dollars.Note: If applicable, for a breakdown <strong>of</strong> each Grant (Federal and Private), Special Purpose Revenue type and Intra-District agreement,please refer to Schedule 80 <strong>Agency</strong> Summary by Revenue Source in <strong>the</strong> FY 2013 Operating Appendices located on <strong>the</strong> <strong>Office</strong> <strong>of</strong> <strong>the</strong><strong>Chief</strong> <strong>Financial</strong> <strong>Office</strong>r’s website.FY 2013 Proposed Full-Time Equivalents, by Revenue TypeTable TO0-2 contains <strong>the</strong> proposed FY 2013 FTE level compared to <strong>the</strong> FY 2012 approved FTE level by revenuetype. It also provides FY 2010 and FY 2011 actual data.Table TO0-2ChangeActual Actual Approved Proposed from PercentAppropriated Fund FY 2010 FY 2011 FY 2012 FY 2013 FY 2012 ChangeGeneral FundLocal Funds 236.1 176.8 210.0 195.5 -14.5 -6.9Special Purpose Revenue Funds 0.0 0.0 0.0 7.8 7.8 N/ATotal for General Fund 236.1 176.8 210.0 203.4 -6.6 -3.2Intra-District FundsIntra-District Funds 62.5 135.5 100.8 84.8 -15.9 -15.8Total for Intra-District Funds 62.5 135.5 100.8 84.8 -15.9 -15.8Total Proposed FTEs 298.6 312.4 310.8 288.2 -22.6 -7.3<strong>Office</strong> <strong>of</strong> <strong>the</strong> <strong>Chief</strong> Technology <strong>Office</strong>rA-116FY 2013 Proposed <strong>Budget</strong> and <strong>Financial</strong> Plan
FY 2013 Proposed Operating <strong>Budget</strong>, by Comptroller Source GroupTable TO0-3 contains <strong>the</strong> proposed FY 2013 budget at <strong>the</strong> Comptroller Source Group (object class) level comparedto <strong>the</strong> FY 2012 approved budget. It also provides FY 2010 and FY 2011 actual expenditures.Table TO0-3(dollars in thousands)ChangeActual Actual Approved Proposed from PercentComptroller Source Group FY 2010 FY 2011 FY 2012 FY 2013 FY 2012 Change*11 - Regular Pay - Continuing Full Time 26,309 22,833 25,220 23,956 -1,264 -5.012 - Regular Pay - O<strong>the</strong>r 1,726 2,252 2,827 2,908 81 2.913 - Additional Gross Pay 1,124 1,084 0 0 0 N/A14 - Fringe Benefits - Current Personnel 5,418 5,196 5,347 5,596 249 4.615 - Overtime Pay 138 11 0 0 0 N/ASubtotal Personal Services (PS) 34,714 31,377 33,395 32,460 -935 -2.820 - Supplies and Materials 116 86 213 148 -65 -30.430 - Energy, Comm. and Building Rentals 1,353 122 0 0 0 N/A31 - Telephone, Telegraph, Telegram, Etc. 2,622 1,272 1,205 1,425 220 18.332 - Rentals - Land and Structures 5,357 93 488 37 -451 -92.433 - Janitorial Services 143 0 0 0 0 N/A34 - Security Services 1,342 0 0 0 0 N/A35 - Occupancy Fixed Costs 315 0 0 0 0 N/A40 - O<strong>the</strong>r Services and Charges 12,701 10,969 10,702 17,136 6,434 60.141 - Contractual Services - O<strong>the</strong>r 26,058 25,105 20,295 24,607 4,313 21.250 - Subsidies and Transfers 0 2,281 1,644 1,002 -643 -39.170 - Equipment and Equipment Rental 1,199 1,827 2,828 892 -1,935 -68.4Subtotal Nonpersonal Services (NPS) 51,208 41,755 37,375 45,248 7,873 21.1Gross Funds 85,921 73,131 70,770 77,708 6,938 9.8*Percent change is based on whole dollars.FY 2013 Proposed <strong>Budget</strong> and <strong>Financial</strong> Plan<strong>Office</strong> <strong>of</strong> <strong>the</strong> <strong>Chief</strong> Technology <strong>Office</strong>rA-117
Division DescriptionThe <strong>Office</strong> <strong>of</strong> <strong>the</strong> <strong>Chief</strong> Technology <strong>Office</strong>r operates through <strong>the</strong> following 7 divisions:Application Solutions – provides innovative, efficient, and cost-effective application development for <strong>the</strong> Districtgovernment and District residents. This division applies standard application development practices to guaranteeon-time and on-budget delivery <strong>of</strong> both custom-built and some selected standard, <strong>of</strong>f-<strong>the</strong>-shelf s<strong>of</strong>tware packages.This division contains <strong>the</strong> following 9 activities:■ Application Implementation – provides project management, application development, application implementation,technical consultations, and application maintenance and support for District agencies to enhanceinformation flow and responsiveness to citizens and to make government more efficient;■ Web Maintenance – establishes, maintains, and implements standards, guidelines, policies, and procedures formaintaining <strong>the</strong> DC.Gov web portal, which is used by hundreds <strong>of</strong> thousands <strong>of</strong> District residents, businesses,and visitors. The team provides centralized content management and fee-for-service webmaster support forDistrict agencies;■ Filenet – centralizes IT infrastructure support for <strong>the</strong> various electronic and paper records throughout <strong>the</strong>District. It provides system administration, maintenance, and application support for agencies using Filenet andK<strong>of</strong>ax applications. It is a repository for electronic content;■ Applications Quality Assurance – implements industry best practices for independent s<strong>of</strong>tware testing, configurationmanagement, database support, application integration, and enterprise content management; assuresthat deployed applications and tools meet standards set by OCTO; and tests applications for high quality andindustry standards for functionality, performance, and capacity planning;■ DMV Application Solutions – provides system development, maintenance and new functional enhancementsfor Department <strong>of</strong> Motor Vehicles’ (DMV’s) business applications, which support vehicle registration, driver’slicense/identification cards, dealer tags, residential parking permits, insurance verification, adjudication, and lawenforcement services with on-site and back-<strong>of</strong>fice services, <strong>the</strong> DMV web portal, and mobile application development;■ D.C. Geographic Information System (GIS) – provides critical geospatial data to District government agencystaff within public safety, economic development, education, transportation, city planning and operations areas.Maintaining accurate geospatial data and reliable systems and applications (and o<strong>the</strong>r customer services)improves quality and maximizes <strong>the</strong> efficiency <strong>of</strong> District government services through <strong>the</strong> application <strong>of</strong>geospatial technology. The program also serves <strong>the</strong> general public by publishing and sharing geospatial datafreely to <strong>the</strong> fullest extent possible with appropriate privacy and security protections;■ Procurement Application Services – supports <strong>the</strong> <strong>Office</strong> <strong>of</strong> Contracting and Procurement by maintaining andenhancing <strong>the</strong> Procurement Automated Support System (PASS), which enables purchasing, receiving <strong>of</strong> goods,and contract compliance for all District agencies (including <strong>the</strong> District <strong>of</strong> Columbia Public Schools); and deliversa centralized workflow for <strong>the</strong> procurement function <strong>of</strong> <strong>the</strong> District government;■ Human Resource Application Services – operates <strong>the</strong> Human Capital Management technology used by allDistrict employees and <strong>the</strong> D.C. Department <strong>of</strong> Human Resources (DCHR). Maintains and upgrades <strong>the</strong> systemand delivers new functionality as needed to expand and enhance <strong>the</strong> human resources management andpayroll system that serves all District employees; and■ Data Transparency and Accountability – collects, analyzes, and publishes government data for easy consumptionfor both <strong>the</strong> government and <strong>the</strong> general public. This program operates a series <strong>of</strong> applications and datareporting services as a centralized hub for <strong>the</strong> exchange <strong>of</strong> citywide data; specialized data sets requested by agencies;and web-accessible “transparency data” on government operations for <strong>the</strong> public, <strong>the</strong> <strong>Office</strong> <strong>of</strong> <strong>the</strong> CityAdministrator, and for District agencies.<strong>Office</strong> <strong>of</strong> <strong>the</strong> <strong>Chief</strong> Technology <strong>Office</strong>rA-118FY 2013 Proposed <strong>Budget</strong> and <strong>Financial</strong> Plan
Program Management <strong>Office</strong> – provides management, business consulting services, and business application supportto agencies to effectively develop and maintain new technology applications and improve service deliverythrough effective integration <strong>of</strong> technology solutions.This division contains <strong>the</strong> following 3 activities:■ <strong>Agency</strong> Technology Oversight and Support – consists <strong>of</strong> multiple management and program managementtype functions including: agency relationship management and business services, project management, andenterprise contracts. The agency relationship management function acts as <strong>the</strong> point <strong>of</strong> contact between allagencies and OCTO and enhances District technology projects with partnership across agency InformationTechnology (IT) representatives to ensure IT project alignment, cost efficiency, and success. The project managementfunction provides review and approval <strong>of</strong> IT projects as part <strong>of</strong> <strong>the</strong> Project Initiation Phase and during<strong>the</strong> project life cycle to improve <strong>the</strong> quality, consistency and performance <strong>of</strong> IT projects. The enterprise contractfunction reviews District-wide technology contracts for cost avoidance opportunities;■ Strategic Investment Support – provides program budget coordination and identifies and monitors <strong>the</strong>agency’s ongoing priorities and critical new capital investments. The services are provided through routinelygenerating reliable cost metrics and performance analysis, benchmarking, pr<strong>of</strong>itability models, and undertakingvalue-added activities that support overall strategic decision-making and mission performance. This activityprovides end users with insight and understanding to make optimal decisions and transform data into strategicand pr<strong>of</strong>itable business goals; and■ Regional and Community Technology Initiatives – provides digital divide outreach and coordination in support<strong>of</strong> OCTO’s objective to bridge <strong>the</strong> digital divide; and develops specialized public events, services, and campaignsfor engagement with <strong>the</strong> general public on Digital Inclusion initiatives.Shared Infrastructure Services – provides <strong>the</strong> technology infrastructure foundation for <strong>the</strong> entire District government’senterprise technology, including a vast high speed digital network, wireless networking services, telecommunicationsservices, database management, messaging and collaboration services, Cloud services and hosted applications,Citywide IT security services, desktop support and management, mainframe and financial system hostedenvironments, Network Operations Center, a Security Operation Center, disaster readiness services, inter-governmentcooperative services, data center-based mainframe services and state-<strong>of</strong>-<strong>the</strong>-art IT systems.This division contains <strong>the</strong> following 7 activities:■ Mainframe Operations – provides reliable, secure and efficient computing environments with sufficientresource capacity to meet <strong>the</strong> information processing requirements <strong>of</strong> <strong>the</strong> mainframe applications in OCTO’sdata centers; and sustains <strong>the</strong> mainframe hardware and s<strong>of</strong>tware that support mission-critical applications usedby DMV, Department <strong>of</strong> Employment Services, <strong>Office</strong> <strong>of</strong> <strong>the</strong> <strong>Chief</strong> <strong>Financial</strong> <strong>Office</strong>r, and University <strong>of</strong> <strong>the</strong>District <strong>of</strong> Columbia;■ Data Center Facilities – maintains <strong>the</strong> premises for OCTO’s data center sites, including facilities operationsand upgrade, resource allocation and access control, power management, site security, with consideration forenvironmentally-friendly solutions;■ Server Operations – provides operational support 24 hours per day, 7 days per week <strong>of</strong> District governmentmission-critical systems and applications, <strong>the</strong> DC.Gov portal, associated databases, virtual infrastructure (privatecloud), enterprise storage systems, and business continuity and disaster recovery for all <strong>the</strong> supported environments;■ Telecommunications Governance – manages a portfolio <strong>of</strong> approved vendors and contract vehicles to purchasetelecommunications products and services, complying with procurement guidelines, and works with all Districtagencies to monitor and certify telecommunications inventories (e.g. landlines, cellular devices, pagers, data circuits)to best manage overall telecommunications operations;FY 2013 Proposed <strong>Budget</strong> and <strong>Financial</strong> Plan<strong>Office</strong> <strong>of</strong> <strong>the</strong> <strong>Chief</strong> Technology <strong>Office</strong>rA-119
■■■D.C. Network Operations Center – provides around-<strong>the</strong>-clock monitoring <strong>of</strong> critical data, wireless and voicenetwork components, along with server and web applications, for <strong>the</strong> District government; also provides afterhoursand weekend call center services that support multiple agencies;Email (Citywide Messaging) – provides collaborative email services engineering, operations management andmodernization for entirety <strong>of</strong> <strong>the</strong> District government; mobile messaging systems engineering and operations;delivers over one million email messages daily to 39,000 electronic mailboxes throughout <strong>the</strong> District government;completes more than 450 Freedom <strong>of</strong> Information Act searches per year; implements and managesCitywide Active Directory and Identity Management systems for all user logins; manages centralized LDAPsystems for specialized application au<strong>the</strong>ntication, and creates specialized mobility solutions; andDC-Net – supplies a fiber-optic telecommunications platform serving as <strong>the</strong> core foundation and primarybackbone conduit <strong>of</strong> all technology and telecommunications services used by over 35,000 District employees;and manages secure voice, video, and data services throughout <strong>the</strong> District, supporting District agencies includingpublic schools, public libraries, community centers, health clinics, public safety agencies, administrative<strong>of</strong>fices, and District government public Wi-Fi networks.Information Security – is responsible for <strong>the</strong> citywide information security platform and policies as well as credentialingfor District employees.This division contains <strong>the</strong> following 2 activities:■ Information Security – deploys an effective information security architecture that mitigates technical vulnerabilitiesin <strong>the</strong> District Wide Area Network serving District agencies, provides a secure network environment for allDistrict government buildings, and ensures compliance with health information security regulations; and■ Identity Management System – manages <strong>the</strong> District’s credentialing system used by employees and residents.Technology Support Services – provides support 24 hours per day, 7 days per week for OCTO-supported applicationsand hardware throughout <strong>the</strong> District government. The IT ServUs activity provides support <strong>of</strong> desktopproducts and services to District agencies with certified technicians who apply industry best practices and industrylevels<strong>of</strong>tware tools, combined with service-level agreements that provide solutions for all end-user computer needs.<strong>Agency</strong> Management Program – provides administrative support and <strong>the</strong> required tools to achieve operational andprogrammatic results. This division is standard for all agencies using performance-based budgeting.<strong>Agency</strong> <strong>Financial</strong> Operations – provides comprehensive and efficient financial management services to, and onbehalf <strong>of</strong>, District agencies so that <strong>the</strong> financial integrity <strong>of</strong> <strong>the</strong> District <strong>of</strong> Columbia is maintained. This divisionis standard for all agencies using performance-based budgeting.Division Structure ChangeThe <strong>Office</strong> <strong>of</strong> <strong>the</strong> <strong>Chief</strong> Technology <strong>Office</strong>r has no division structure changes in <strong>the</strong> FY 2013 proposed budget.<strong>Office</strong> <strong>of</strong> <strong>the</strong> <strong>Chief</strong> Technology <strong>Office</strong>rA-120FY 2013 Proposed <strong>Budget</strong> and <strong>Financial</strong> Plan
FY 2013 Proposed Operating <strong>Budget</strong> and FTEs, by Division and ActivityTable TO0-4 contains <strong>the</strong> proposed FY 2013 budget by division and activity compared to <strong>the</strong> FY 2012 approved budget.It also provides <strong>the</strong> FY 2011 actual data.Table TO0-4(dollars in thousands)Dollars in ThousandsFull-Time EquivalentsChangeChangeActual Approved Proposed from Actual Approved Proposed fromDivision/Activity FY 2011 FY 2012 FY 2013 FY 2012 FY 2011 FY 2012 FY 2013 FY 2012(1000) <strong>Agency</strong> Management Program(1010) Personnel 250 196 583 388 2.8 2.0 2.0 0.0(1030) Property Management 633 735 803 68 3.7 4.0 4.0 0.0(1090) Performance Management 1,050 1,008 2,223 1,215 7.4 7.0 13.0 6.0Subtotal (1000) <strong>Agency</strong> Management Program 1,933 1,939 3,609 1,670 13.8 13.0 19.0 6.0(100F) <strong>Agency</strong> <strong>Financial</strong> Operations(110F) <strong>Budget</strong> Operations 728 725 756 31 6.4 6.0 6.0 0.0(120F) Accounting Operations 339 428 414 -15 4.6 5.0 5.0 0.0Subtotal (100F) <strong>Agency</strong> <strong>Financial</strong> Operations 1,067 1,153 1,169 16 11.1 11.0 11.0 0.0(2000) Application Solutions(2010) Application Implementation 3,285 3,153 3,675 522 15.5 11.5 12.0 0.5(2011) Web Maintenance 1,534 1,664 1,489 -175 6.9 11.0 10.0 -1.0(2012) Filenet 440 0 637 637 4.6 0.0 0.0 0.0(2013) Application Quality Assurance 2,220 1,924 1,293 -631 8.6 9.7 9.0 -0.7(2015) DMV Application Solutions 1,369 1,557 1,552 -6 6.9 8.6 7.0 -1.6(2016) DC Geographic Information System-GIS 2,379 2,621 2,692 71 9.7 9.8 11.0 1.2(2030) Telecommunications -18 0 0 0 0.0 0.0 0.0 0.0(2035) Dc Network Operations Center (DCNOC) -6 0 0 0 0.0 0.0 0.0 0.0(2037) Wireless/NCR-IP 323 0 0 0 0.0 0.0 0.0 0.0(2055) Service Desk -1 0 0 0 0.0 0.0 0.0 0.0(2070) Technology Acquisitions 549 0 0 0 0.0 0.0 0.0 0.0(2080) Procurement Application Services 1,085 1,246 1,239 -7 3.7 4.0 4.0 0.0(2081) Human Resource Application Services 1,630 2,112 2,407 295 8.3 9.0 6.0 -3.0(2085) Data Transparency and Accountability 744 667 526 -142 2.9 4.0 2.0 -2.0(2090) Remedy Services 0 752 0 -752 0.0 6.0 0.0 -6.0Subtotal (2000) Application Solutions 15,535 15,696 15,509 -187 67.1 73.6 61.0 -12.6(3000) Program Management <strong>Office</strong>(3010) <strong>Agency</strong> Technology Oversight and Support 2,839 2,323 1,817 -506 24.9 16.0 10.0 -6.0(3020) Strategic Investment Support 376 34 702 668 4.6 0.0 6.5 6.5(3037) Regional and Community Tech Initiatives 3,037 1,738 1,795 57 3.7 1.0 1.0 0.0Subtotal (3000) Program Management <strong>Office</strong> 6,252 4,096 4,315 219 33.2 17.0 17.5 0.5(Continued on next page)FY 2013 Proposed <strong>Budget</strong> and <strong>Financial</strong> Plan<strong>Office</strong> <strong>of</strong> <strong>the</strong> <strong>Chief</strong> Technology <strong>Office</strong>rA-121
Table TO0-4 (Continued)(dollars in thousands)Dollars in ThousandsFull-Time EquivalentsChangeChangeActual Approved Proposed from Actual Approved Proposed fromDivision/Activity FY 2011 FY 2012 FY 2013 FY 2012 FY 2011 FY 2012 FY 2013 FY 2012(4000) Shared Infrastructure Services(4010) Mainframe Operations 5,387 6,692 6,920 228 16.0 30.0 21.0 -9.0(4015) Data Center Facilities 425 443 851 408 1.9 3.0 4.0 1.0(4020) Server Operations 4,191 5,223 5,143 -81 9.9 21.5 15.0 -6.5(4030) Telecommunications Governance 1,617 1,715 1,858 143 15.0 12.0 13.0 1.0(4035) DC Network Operations Center (DCNOC) 3,932 3,247 3,851 604 18.7 15.8 16.0 0.2(4036) DC Net 19,319 18,283 20,182 1,900 51.9 43.0 48.7 5.7(4050) E-Mail 2,035 1,879 3,381 1,502 3.5 4.0 3.0 -1.0Subtotal (4000) Shared Infrastructure Services 36,906 37,482 42,185 4,703 116.8 129.2 120.7 -8.5(5000) Information Security((5010) Information Security 1,971 2,023 2,924 900 8.3 7.0 5.0 -2.0(5020) Identity Management Systems 37 746 824 77 0.0 4.0 4.0 0.0Subtotal (5000) Information Security 2,008 2,770 3,748 978 8.3 11.0 9.0 -2.0(6000) Technology Support Services(6010) IT Servus 7,790 7,168 7,173 6 58.5 56.0 50.0 -6.0(6020) Applications Support 1,639 467 0 -467 3.5 0.0 0.0 0.0Subtotal (6000) Technology Support Services 9,430 7,635 7,173 -462 62.0 56.0 50.0 -6.0Total Proposed Operating <strong>Budget</strong> 73,131 70,770 77,708 6,938 312.4 310.8 288.2 -22.6(Change is calculated by whole numbers and numbers may not add up due to rounding)Note: For more detailed information regarding <strong>the</strong> proposed funding for <strong>the</strong> activities in <strong>the</strong> agency’s divisions, please refer to Schedule 30-PBB,Program Summary by Activity in <strong>the</strong> FY 2013 Operating Appendices located on <strong>the</strong> <strong>Office</strong> <strong>of</strong> <strong>the</strong> <strong>Chief</strong> <strong>Financial</strong> <strong>Office</strong>r’s website.<strong>Office</strong> <strong>of</strong> <strong>the</strong> <strong>Chief</strong> Technology <strong>Office</strong>rA-122FY 2013 Proposed <strong>Budget</strong> and <strong>Financial</strong> Plan
FY 2013 Proposed <strong>Budget</strong> ChangesThe <strong>Office</strong> <strong>of</strong> <strong>the</strong> <strong>Chief</strong> Technology <strong>Office</strong>r’s (OCTO’s) proposed FY 2013 gross budget is $77,708,049, whichrepresents a 9.8 percent increase over its FY 2012 approved gross budget <strong>of</strong> $70,770,173. The budget is comprised<strong>of</strong> $39,974,021 in Local funds, $2,498,350 in Federal Grants funds, $10,943,228 in Special Purpose Revenuefunds, and $24,292,451 in Intra-District funds.Current Services Funding LevelThe Current Services Funding Level (CSFL) is a Local funds ONLY representation <strong>of</strong> <strong>the</strong> true cost <strong>of</strong> operatingDistrict agencies, before consideration <strong>of</strong> policy decisions. The CSFL reflects changes from <strong>the</strong> FY 2012 approvedbudget across multiple programs, and it estimates how much it would cost an agency to continue its current programsand operations into <strong>the</strong> following fiscal year. The initial adjustments in <strong>the</strong> budget proposal representchanges that should be compared to <strong>the</strong> FY 2013 CSFL budget and not necessarily changes made to <strong>the</strong> FY 2012Local funds budget. The FY 2013 CSFL adjustments to <strong>the</strong> FY 2012 Local funds budget are described in table 5<strong>of</strong> this agency's budget chapter. Please see <strong>the</strong> CSFL Development section within Volume 1: Executive Summaryfor more information regarding <strong>the</strong> methodology used and components that comprise <strong>the</strong> CSFL.OCTO’s FY 2013 CSFL budget is $39,924,918, which represents a $5,676,044, or 16.6 percent, increase over<strong>the</strong> FY 2012 approved Local funds budget <strong>of</strong> $34,248,874.Major CSFL Cost DriversThe FY 2013 CSFL calculated for OCTO included ano<strong>the</strong>r adjustment entry that is not described in detail ontable 5. This adjustment was made for an increase <strong>of</strong> $5,094,000 to account for <strong>the</strong> operating budget impact <strong>of</strong>capital projects that have been completed. During <strong>the</strong> development <strong>of</strong> <strong>the</strong> CSFL, some adjustments such as thiswere categorized as "o<strong>the</strong>r adjustments."Initial Adjusted <strong>Budget</strong>Cost Increase: OCTO will increase its Local funds in O<strong>the</strong>r Services and Charges by $2,141,084 to cover costsrelated to s<strong>of</strong>tware maintenance and s<strong>of</strong>tware licensing, $1,362,085 in Contractual Services for IT consultants, and$20,413 for IT equipment. O<strong>the</strong>r increases include $1,900,292 in Special Purpose Revenues to align <strong>the</strong> budgetwith revenue estimates for DC-Net, with an increase <strong>of</strong> 7.8 FTEs.Cost Decreases: To respond to <strong>the</strong> current economic climate <strong>of</strong> doing more with less while <strong>the</strong> demand for servicescontinue to escalate, <strong>the</strong> agency made <strong>the</strong> following reductions in Local funds: $3,422,862 and 1.0 FTE in Localfunds for Regular Pay - O<strong>the</strong>r and $100,719 in Supplies and Materials. A reduction <strong>of</strong> $289,318 in Federal Grantfunds is based on projected carryover; and a reduction <strong>of</strong> $420,799 and 15.9 FTEs in Intra-District is also anticipated.Additionally Adjusted <strong>Budget</strong>Technical Adjustment: Adjustments <strong>of</strong> Fringe Benefits to restore <strong>the</strong> District Government contribution foremployee health insurance from 72 percent, implemented in <strong>the</strong> FY 2011 budget, to 75 percent in FY 2013, resultingin increases <strong>of</strong> $87,145 in Local funds, $2,793 in Special Purpose Revenue funds, and $19,761 in Intra-Districtfunds.Policy InitiativesTechnical Adjustment: $1,303,717 in Local funds for <strong>the</strong> S<strong>of</strong>tware enterprise licensing agreement.Transfer Out: An agreement to detail one <strong>of</strong> OCTO’s employees to <strong>the</strong> DC Department <strong>of</strong> Human Resources tohelp transition its staff from a traditional IT role to more <strong>of</strong> a human resources related responsibility reduced <strong>the</strong>personal services budget by $117,458 and 1.0 FTE. This permanent transfer will help with <strong>the</strong> ComprehensiveAnnual <strong>Financial</strong> Report remediation project related to <strong>the</strong> PeopleS<strong>of</strong>t application.FY 2013 Proposed <strong>Budget</strong> and <strong>Financial</strong> Plan<strong>Office</strong> <strong>of</strong> <strong>the</strong> <strong>Chief</strong> Technology <strong>Office</strong>rA-123
Cost Decrease: OCTO’s Local funds budget is reduced by $1,224,302 due to cost savings associated with <strong>the</strong> elimination<strong>of</strong> 12.5 vacant FTEs.FY 2012 Approved <strong>Budget</strong> to FY 2013 Proposed <strong>Budget</strong>, by Revenue TypeTable TO0-5 itemizes <strong>the</strong> changes by revenue type between <strong>the</strong> FY 2012 approved budget and <strong>the</strong> FY 2013proposed budget.Table TO0-5(dollars in thousands)PROGRAM BUDGET FTELOCAL FUNDS: FY 2012 Approved <strong>Budget</strong> and FTE 34,249 210.0Fringe Benefit Rate Adjustment Multiple Programs 256 0.0Consumer Price Index Multiple Programs 231 0.0O<strong>the</strong>r Adjustments Multiple Programs 5,094 0.0Personal Services Growth Factor Multiple Programs 95 0.0FY 2013 Current Services Funding Level <strong>Budget</strong> (CSFL) 39,925 210.0Cost Increase: To cover <strong>the</strong> increase in O<strong>the</strong>r Services Multiple Programs 2,141 0.0and Charges related to s<strong>of</strong>tware maintenance and s<strong>of</strong>tware licensingCost Increase: To covers <strong>the</strong> increase in Contractual Multiple Programs 1,362 0.0Services and IT ConsultantsCost Increase: To cover <strong>the</strong> increase in IT Equipment Multiple Programs 20 0.0Cost Decrease: In Supplies and Materials Multiple Programs -101 0.0Cost Decrease: In Regular Pay to <strong>of</strong>fset increases in Multiple Programs -3,423 -1.0hardware and s<strong>of</strong>tware maintenance and Contractual ServicesFY 2013 Initial Adjusted <strong>Budget</strong> 39,925 209.0Technical Adjustment: Health insurance contribution Multiple Programs 87 0.0FY 2013 Additionally Adjusted <strong>Budget</strong> 40,012 209.0FY 2013 Policy InitiativesTechnical Adjustments: Micros<strong>of</strong>t licensing agreement Shared Infrastructure Services 1,304 0.0Transfer Out: To D.C. Department <strong>of</strong> Human Resources Application Solutions -117 -1.0Cost Decrease: Eliminate vacant positions Multiple Programs -1,224 -12.5LOCAL FUNDS: FY 2013 Proposed <strong>Budget</strong> and FTE 39,974 195.5FEDERAL GRANT FUNDS: FY 2012 Approved <strong>Budget</strong> and FTE 2,788 0.0Cost Decrease: Based on projected carryover Multiple Programs -289 0.0FY 2013 Initial Adjusted <strong>Budget</strong> 2,498 0.0FEDERAL GRANT FUNDS: FY 2013 Proposed <strong>Budget</strong> and FTE 2,498 0.0(Continued on next page)<strong>Office</strong> <strong>of</strong> <strong>the</strong> <strong>Chief</strong> Technology <strong>Office</strong>rA-124FY 2013 Proposed <strong>Budget</strong> and <strong>Financial</strong> Plan
Table TO0-5 (Continued)(dollars in thousands)PROGRAM BUDGET FTESPECIAL PURPOSE REVENUE FUNDS: FY 2012 Approved <strong>Budget</strong> and FTE 9,040 0.0Cost Increase: Projected increase in revenue estimates for DC-Net Shared Infrastructure Services 1,900 7.8FY 2013 Initial Adjusted <strong>Budget</strong> 10,940 7.8Technical Adjustment: Health insurance contribution Multiple Programs 3 0.0FY 2013 Additionally Adjusted <strong>Budget</strong> 10,943 7.8SPECIAL PURPOSE REVENUE FUNDS: FY 2013 Proposed <strong>Budget</strong> and FTE 10,943 7.8INTRA-DISTRICT FUNDS: FY 2012 Approved <strong>Budget</strong> and FTE 24,693 100.8Cost Decrease: In agency-wide Intra-District agreements Multiple Programs -421 -15.9FY 2013 Initial Adjusted <strong>Budget</strong> 24,273 84.9Technical Adjustment: Health insurance contribution Multiple Programs 20 0.0FY 2013 Additionally Adjusted <strong>Budget</strong> 24,292 84.9INTRA-DISTRICT FUNDS: FY 2013 Proposed <strong>Budget</strong> and FTE 24,292 84.9Gross for TO0 - <strong>Office</strong> <strong>of</strong> <strong>the</strong> <strong>Chief</strong> Technology <strong>Office</strong>r 77,708 288.2(Change is calculated by whole numbers and numbers may not add up due to rounding)FY 2013 Proposed <strong>Budget</strong> and <strong>Financial</strong> Plan<strong>Office</strong> <strong>of</strong> <strong>the</strong> <strong>Chief</strong> Technology <strong>Office</strong>rA-125
<strong>Agency</strong> Performance PlanThe agency’s performance plan has <strong>the</strong> following objectives for FY 2013:1. <strong>Agency</strong> Management ProgramObjective 1: Provide and maintain a ubiquitous, reliable, and secure computing environment for <strong>the</strong> governmentas well as residents, businesses, and visitors.Objective 2: Lower <strong>the</strong> cost <strong>of</strong> government operations and enhance service through innovative technologies.Objective 3: Bridge <strong>the</strong> digital divide and enable economic development.2. Application SolutionsObjective 1: Provide and maintain a ubiquitous, reliable, and secure computing environment for <strong>the</strong> governmentas well as residents, businesses, and visitors.Objective 2: Lower <strong>the</strong> cost <strong>of</strong> government operations and enhance service through innovative technologies.Objective 3: Embrace information technology best practices and ensure high quality service delivery <strong>of</strong> technologyprojects.Objective 4: Bridge <strong>the</strong> digital divide and enable economic development.Applications SolutionsFY 2010 FY 2011 FY 2011 FY 2012 FY 2013 FY 2014Measure Actual Target Actual Projection Projection ProjectionPercentage <strong>of</strong> trained agencies publishing content itemsto web 30% 40% 91.43% 60% 70% 75%Number <strong>of</strong> on-time delivery <strong>of</strong> releases to DMV in support<strong>of</strong> Performance Plan 4 4 5 4 4 4Number <strong>of</strong> datasets added to <strong>the</strong> Data Catalog, dashboards, Notreporting environments and applications Available 10 12 20 25 25Number <strong>of</strong> new projects using Agile methods 3 10 22 10 10 15Number <strong>of</strong> calls to District GIS Central Database 2.1 2.5 2.2 2.7 3 3Million Million Million Million Million MillionPercentage <strong>of</strong> uptime for enterprise applications 99.71% 99.85% 99.58% 99.90% 99.95% 99.95%Number <strong>of</strong> data downloads from public data catalogs 1.9 2 1.9 2.2 2.5 2.5Million Million Million Million Million MillionNumber <strong>of</strong> applications deployed using consumer or opensource and cloud computing technologies 471 550 781 600 650 700<strong>Office</strong> <strong>of</strong> <strong>the</strong> <strong>Chief</strong> Technology <strong>Office</strong>rA-126FY 2013 Proposed <strong>Budget</strong> and <strong>Financial</strong> Plan
3. Program Management <strong>Office</strong>Objective 1: Provide and maintain a ubiquitous, reliable, and secure computing environment for <strong>the</strong> governmentas well as residents, businesses, and visitors.Objective 2: Lower <strong>the</strong> cost <strong>of</strong> government operations and enhance service through innovative technologies.Program Management <strong>Office</strong>FY 2010 FY 2011 FY 2011 FY 2012 FY 2013 FY 2014Measure Actual Target Actual Projection Projection ProjectionAmount saved through SMART buyer program $1.2 $3 $2.2 $2 $2 $2Million Million Million Million Million MillionPercentage <strong>of</strong> IT Staff Augmentation (ITSA) Spend awarded toDistrict Certified Business Enterprises (CBEs) 97% 95% 98.3% 95% 95% 95%4. Shared Infrastructure ServicesObjective 1: Provide and maintain a ubiquitous, reliable, and secure computing environment for <strong>the</strong> governmentas well as residents, businesses, and visitors.Objective 2: Lower <strong>the</strong> cost <strong>of</strong> government operations and enhance service through innovative technologies.Objective 3: Bridge <strong>the</strong> digital divide and enable economic development.Shared Infrastructure ServicesFY 2010 FY 2011 FY 2011 FY 2012 FY 2013 FY 2014Measure Actual Target Actual Projection Projection ProjectionPercentage <strong>of</strong> uptime for all OCTO-supported infrastructure 99% 99% 99% 99% 99% 99%Number <strong>of</strong> agencies utilizing OCTO’s hosting servicesNotAvailable 25 65 50 75 86Number <strong>of</strong> public WiFi hotspots 230 300 276 370 425 425FY 2013 Proposed <strong>Budget</strong> and <strong>Financial</strong> Plan<strong>Office</strong> <strong>of</strong> <strong>the</strong> <strong>Chief</strong> Technology <strong>Office</strong>rA-127
5. Information SecurityObjective 1: Provide and maintain a ubiquitous, reliable, and secure computing environment for <strong>the</strong> government aswell as residents, businesses, and visitors.Objective 2: Embrace information technology best practices and ensure high quality service delivery <strong>of</strong> technologyprojects.Information SecurityFY 2010 FY 2011 FY 2011 FY 2012 FY 2013 FY 2014Measure Actual Target Actual Projection Projection ProjectionNumber <strong>of</strong> security audits passed Not 2 0 4 4 4AvailableNumber <strong>of</strong> tokenless VPN accounts added 645 1,000 1,079 2,000 3,000 5,0006. Technology Support ServiceObjective1: Embrace information technology best practices and ensure high quality service delivery <strong>of</strong> technologyprojects.Technology Support ServiceFY 2010 FY 2011 FY 2011 FY 2012 FY 2013 FY 2014Measure Actual Target Actual Projection Projection ProjectionPercentage <strong>of</strong> desktop issue tickets resolved within 4 hours 97% 96% 92.51% 90% 88% 90%Percentage <strong>of</strong> calls answered in 30 seconds 63% 80% 77.28% 80% 80% 80%Percentage <strong>of</strong> dispatch tickets resolved within SLAs 71% 70% 72.37% 75% 80% 80%<strong>Office</strong> <strong>of</strong> <strong>the</strong> <strong>Chief</strong> Technology <strong>Office</strong>rA-128FY 2013 Proposed <strong>Budget</strong> and <strong>Financial</strong> Plan
Department <strong>of</strong> General Services(AM0)www.dgs.dc.govTelephone: 202-724-4400% ChangeFY 2011 FY 2012 FY 2013 fromDescription Actual Approved Proposed FY 2012Operating <strong>Budget</strong> $24,164,378 $353,885,345 $388,442,860 9.8FTEs 65.8 713.2 678.0 -4.9The goal <strong>of</strong> <strong>the</strong> Department <strong>of</strong> General Services (DGS) is to ensure<strong>the</strong> delivery <strong>of</strong> new or modernized, well-equipped, well-maintained,safe and secure buildings and facilities for <strong>the</strong> benefit <strong>of</strong> District residentsand employees. Fur<strong>the</strong>r, <strong>the</strong> agency’s mission is to promote <strong>the</strong>efficient and effective management <strong>of</strong> <strong>the</strong> District’s real estate investmentsand interests through strategic portfolio management, constructionand facilities management. To this end, DGS will incorporatebest management practices from both <strong>the</strong> public and private sectors.Summary <strong>of</strong> ServicesThe Department <strong>of</strong> General Services (DGS) results from <strong>the</strong> consolidation <strong>of</strong> capital construction and real propertymanagement functions <strong>of</strong> <strong>the</strong> <strong>Office</strong> <strong>of</strong> Public Education Facilities Modernization, Department <strong>of</strong> Real EstateServices, Municipal Facilities: Non-Capital <strong>Agency</strong>, Fire and Emergency Medical Services, Metropolitan PoliceDepartment, and <strong>the</strong> facilities management responsibilities <strong>of</strong> <strong>the</strong> Department <strong>of</strong> Parks and Recreation.Consequently, DGS carries out a broad range <strong>of</strong> real estate management functions. In addition to managing capitalimprovement and construction program for a variety <strong>of</strong> District government agencies, DGS also executes realproperty acquisitions by purchase or lease, disposes <strong>of</strong> property through sale, lease or o<strong>the</strong>r authorized method;manages space in buildings and adjacent areas, and provides building management services for facilities owned oroperated by <strong>the</strong> District. Among <strong>the</strong> services provided are engineering, custodial, security, energy conservation,utility management, general maintenance, inspection, planning, capital repairs and improvement. In all <strong>of</strong> itsendeavors, DGS is dedicated to <strong>the</strong> following:■■■■■A Focused Dedication to Achieving Efficiency in Operations;A Commitment to Quality in Design and Execution;An Emphasis on Excellence in Service and Maintenance;A Promise to Deliver Secure and Safe Places <strong>of</strong> Work for District Employees; andA Promise to Deliver Aggressive and Attentive Management <strong>of</strong> <strong>the</strong> District’s Resources.FY 2013 Proposed <strong>Budget</strong> and <strong>Financial</strong> PlanDepartment <strong>of</strong> General ServicesA-129
The agency’s FY 2013 proposed budget is presented in <strong>the</strong> following tables:FY 2013 Proposed Gross Funds Operating <strong>Budget</strong>, by Revenue TypeTable AM0-1 contains <strong>the</strong> proposed FY 2013 agency budget compared to <strong>the</strong> FY 2012 approved budget. It alsoprovides <strong>the</strong> FY 2010 and FY 2011 actual expenditures.Table AM0-1(dollars in thousands)ChangeActual Actual Approved Proposed from PercentAppropriated Fund FY 2010 FY 2011 FY 2012 FY 2013 FY 2012 Change*General FundLocal Funds 19,546 7,136 205,426 244,338 38,912 18.9Special Purpose Revenue Funds 10,139 12,463 6,506 6,579 73 1.1Total for General Fund 29,685 19,599 211,932 250,917 38,985 18.4Intra-District FundsIntra-District Funds 45,008 4,565 141,953 137,525 -4,428 -3.1Total for Intra-District Funds 45,008 4,565 141,953 137,525 -4,428 -3.1Gross Funds 74,694 24,164 353,885 388,443 34,558 9.8*Percent change is based on whole dollars.Note: If applicable, for a breakdown <strong>of</strong> each Grant (Federal and Private), Special Purpose Revenue type and Intra-District agreement,please refer to Schedule 80 <strong>Agency</strong> Summary by Revenue Source in <strong>the</strong> FY 2013 Operating Appendices located on <strong>the</strong> <strong>Office</strong> <strong>of</strong> <strong>the</strong><strong>Chief</strong> <strong>Financial</strong> <strong>Office</strong>r’s website.FY 2013 Proposed Full-Time Equivalents, by Revenue TypeTable AM0-2 contains <strong>the</strong> proposed FY 2013 FTE level compared to <strong>the</strong> FY 2012 approved FTE level by revenuetype. It also provides FY 2010 and FY 2011 actual data.Table AM0-2ChangeActual Actual Approved Proposed from PercentAppropriated Fund FY 2010 FY 2011 FY 2012 FY 2013 FY 2012 ChangeGeneral FundLocal Funds 58.7 42.0 696.2 661.0 -35.2 -5.1Special Purpose Revenue Funds 7.4 23.7 17.0 17.0 0.0 0.0Total for General Fund 66.0 65.8 713.2 678.0 -35.2 -4.9Intra-District FundsIntra-District Funds 199.0 0.0 0.0 0.0 0.0 N/ATotal for Intra-District Funds 199.0 0.0 0.0 0.0 0.0 N/ATotal Proposed FTEs 265.0 65.8 713.2 678.0 -35.2 -4.9Department <strong>of</strong> General ServicesA-130FY 2013 Proposed <strong>Budget</strong> and <strong>Financial</strong> Plan
FY 2013 Proposed Operating <strong>Budget</strong>, by Comptroller Source GroupTable AM0-3 contains <strong>the</strong> proposed FY 2013 budget at <strong>the</strong> Comptroller Source Group (object class) level comparedto <strong>the</strong> FY 2012 approved budget. It also provides FY 2010 and FY 2011 actual expenditures.Table AM0-3(dollars in thousands)ChangeActual Actual Approved Proposed from PercentComptroller Source Group FY 2010 FY 2011 FY 2012 FY 2013 FY 2012 Change*11 - Regular Pay - Continuing Full Time 11,462 2,271 37,330 35,719 -1,611 -4.312 - Regular Pay - O<strong>the</strong>r 4,617 2,473 7,190 6,668 -522 -7.313 - Additional Gross Pay 1,135 149 625 625 0 0.014 - Fringe Benefits - Current Personnel 3,448 929 9,443 9,785 343 3.615 - Overtime Pay 1,449 94 1,982 1,961 -21 -1.1Subtotal Personal Services (PS) 22,111 5,916 56,571 54,758 -1,812 -3.220 - Supplies and Materials 195 146 1,249 5,125 3,877 310.530 - Energy, Comm. and Building Rentals 6,494 180 90,166 100,444 10,278 11.431 - Telephone, Telegraph, Telegram, Etc. 346 22 1 1 0 0.032 - Rentals - Land and Structures 0 0 125,376 130,327 4,951 3.933 - Janitorial Services 518 0 0 174 174 N/A34 - Security Services 778 82 416 0 -416 -100.035 - Occupancy Fixed Costs 2,069 0 0 0 0 N/A40 - O<strong>the</strong>r Services and Charges 6,527 3,352 6,031 6,919 888 14.741 - Contractual Services - O<strong>the</strong>r 35,339 14,454 73,456 89,931 16,474 22.470 - Equipment and Equipment Rental 316 11 619 763 144 23.2Subtotal Nonpersonal Services (NPS) 52,583 18,249 297,314 333,684 36,370 12.2Gross Funds 74,694 24,164 353,885 388,443 34,558 9.8*Percent change is based on whole dollars.FY 2013 Proposed <strong>Budget</strong> and <strong>Financial</strong> PlanDepartment <strong>of</strong> General ServicesA-131
Division DescriptionThe Department <strong>of</strong> General Services operates through <strong>the</strong> following 8 divisions:Construction Services – implements and manages <strong>the</strong> public building needs through <strong>the</strong> Capital ImprovementsPlan (<strong>the</strong> Plan) for most District government agencies. The Plan outlines agencies’ capital needs, including <strong>the</strong> rehabilitation<strong>of</strong> existing properties and construction <strong>of</strong> new facilities. This division ensures <strong>the</strong> timely and cost-effectivedelivery <strong>of</strong> superior quality engineering and design, construction, as well as a variety <strong>of</strong> o<strong>the</strong>r technical serviceson all relevant capital development projects in <strong>the</strong> Plan.This division contains <strong>the</strong> following 2 activities:■ DGS Construction Services – houses <strong>the</strong> operating budget costs <strong>of</strong> <strong>the</strong> division including non-capital eligiblepositions and administrative costs; and■ Public Education Construction Services – houses <strong>the</strong> operating budget cost <strong>of</strong> <strong>the</strong> Public Education activityincluding non-capital eligible positions and administrative costs.Contracting and Procurement – provides service and support to DGS (and o<strong>the</strong>r agencies as needed) in procuringgoods and services that fall into <strong>the</strong> following categories: construction, architecture, and engineering; facilitiesmaintenance and operation; real estate asset management (including leasing and auditing); and utility contracts andsecurity. Additionally, Contracting and Procurement is responsible for vertical construction procurements for anyDistrict agency without independent contracting authority.This division contains <strong>the</strong> following 2 activities:■ Contracting and Procurement Services – holds <strong>the</strong> operating budget costs <strong>of</strong> <strong>the</strong> division including non-capitaleligible positions and administrative costs; and■ Public Education Contracting and Procurement Services – holds <strong>the</strong> budget for <strong>the</strong> employees and administrativecosts related to Public Education contracting and procurement.Facility Operations – is responsible for <strong>the</strong> day-to-day operation <strong>of</strong> many District-owned properties, vacant lots,and homeless shelters, and acts as a liaison for operating purposes between agencies and landlords in leased buildingsby maintaining building assets and equipment; performing various repairs and non-structural improvements;and providing janitorial, trash and recycling pickup, postal, and engineering services.The division contains <strong>the</strong> following 8 activities:■ Postal Services – provides certain postal services to various District agencies in owned property;■ Facilities/Occupancy – includes costs associated with operating DGS-managed District buildings. Specifically,Facilities/Occupancy is responsible for elevator and fire alarm maintenance, landscape, air quality, pest control,HVAC and electrical repairs and maintenance, water treatment, salaries for <strong>the</strong>se services, and o<strong>the</strong>r relatedbuilding services contracts;■ Parking – provides parking space allocation services and parking revenue monitoring services to <strong>the</strong> District;■ RFK/Armory – provides facilities and security services for Robert F. Kennedy Memorial Stadium and <strong>the</strong>District <strong>of</strong> Columbia Armory (non-military portion), based on a Memorandum <strong>of</strong> Agreement with <strong>the</strong> District<strong>of</strong> Columbia Washington Convention and Sports Authority;■ Facilities-Public Education – includes facility maintenance and repair costs for <strong>the</strong> District <strong>of</strong> Columbia PublicSchools (DCPS);■ Facilities-Parks and Recreation – includes facility maintenance and repair costs for parks and recreation centersunder <strong>the</strong> Department <strong>of</strong> Parks and Recreation (DPR);■ Facilities-MPD – includes facility maintenance and repair costs for Metropolitan Police Department (MPD)buildings; andDepartment <strong>of</strong> General ServicesA-132FY 2013 Proposed <strong>Budget</strong> and <strong>Financial</strong> Plan
■Facilities-FEMS – includes facility maintenance and repair costs for Fire and Emergency Medical Services(FEMS) Department buildings.Asset Management/Portfolio – plans and manages <strong>the</strong> District’s real estate to achieve its highest and best use. Thisdivision engages in activities such as lease administration, allocation <strong>of</strong> owned and leased properties to District agencies,property acquisition and disposition, fixed cost forecasting for District facilities, and rent collection from entitiesleasing District-owned property.This division contains <strong>the</strong> following 4 activities:■ Lease Management (DGS Realty) – provides space location and management services for District agencies inboth owned and leased buildings;■ Public Education Realty – provides asset management services to public and private entities, allowing accessand utilization <strong>of</strong> school building and grounds by entering into use agreements, licenses, and lease agreements;■ Swing Space – provides support for services associated with moving agencies from one space to ano<strong>the</strong>r; and■ Eastern Market – provides for <strong>the</strong> operations and management <strong>of</strong> Eastern Market through <strong>the</strong> revenue-generatingEastern Market Enterprise Fund.Energy – contains <strong>the</strong> forecasted expenditures for utility and energy commodities purchased by DGS: fuel, naturalgas, electricity, steam, and water.This division contains <strong>the</strong> following 6 activities:■ Auto Fuel – includes forecasted automobile and heating fuel expenditures. The District purchases four types <strong>of</strong>fuel - Oil, Unleaded, E85 Ethanol, and Diesel Oil - that are used to heat facilities, to fuel generators, and t<strong>of</strong>uel vehicles;■ Heating Fuel - includes forecasted heating fuel expenditures;■ Natural Gas – includes forecasted natural gas expenditures;■ Electricity – includes forecasted electricity expenditures;■ Steam – includes forecasted steam expenditures; and■ Water – includes forecasted water and sewer expenditures.Security – includes <strong>the</strong> budget for <strong>the</strong> Protective Service Police Department (PSPD). PSPD provides 24-hour securityand law enforcement services to government operations by protecting employees, resources, and facilities atDistrict-owned and leased properties. Security includes patrol operations, contract security guard management, andelectronic access control and security systems. PSPD also assists District and federal agencies during special eventsand criminal investigations.Rent: In-Lease – includes <strong>the</strong> budget for in-leasing space, which is <strong>the</strong> cost <strong>of</strong> leasing non-District-governmentownedbuildings. Rent is comprised <strong>of</strong> four individual components: base rent, operating expenses, real estate tax,and parking. Each one <strong>of</strong> <strong>the</strong>se four charges is unique to <strong>the</strong> terms and conditions <strong>of</strong> <strong>the</strong> lease agreement with eachlandlord.<strong>Agency</strong> Management – provides for administrative support and <strong>the</strong> required tools to achieve operational and programmaticresults. This division is standard for all agencies using performance-based budgeting.Division Structure ChangeThe Department <strong>of</strong> General Services has no division structure changes in <strong>the</strong> FY 2013 proposed budget.FY 2013 Proposed <strong>Budget</strong> and <strong>Financial</strong> PlanDepartment <strong>of</strong> General ServicesA-133
FY 2013 Proposed Operating <strong>Budget</strong> and FTEs, by Division and ActivityTable AM0-4 contains <strong>the</strong> proposed FY 2013 budget by division and activity compared to <strong>the</strong> FY 2012 approved budget.It also provides <strong>the</strong> FY 2011 actual data.Table AM0-4(dollars in thousands)Dollars in ThousandsFull-Time EquivalentsChangeChangeActual Approved Proposed from Actual Approved Proposed fromDivision/Activity FY 2011 FY 2012 FY 2013 FY 2012 FY 2011 FY 2012 FY 2013 FY 2012(1000) <strong>Agency</strong> Management(1010) Personnel 281 393 453 60 4.5 4.0 5.0 1.0(1015) Training and Employee Development 0 3 13 10 0.0 0.0 0.0 0.0(1030) Property Management 464 451 450 -1 0.0 0.0 0.0 0.0(1040) Information Technology 856 409 615 206 2.7 2.0 2.0 0.0(1051) <strong>Financial</strong> Services - Public Education 0 1,051 931 -121 0.0 7.0 7.0 0.0(1055) Risk Management 93 103 108 5 0.9 1.0 1.0 0.0(1070) Fleet Management 283 325 371 46 0.9 0.0 0.0 0.0(1080) Communications 77 80 134 54 0.9 1.0 1.0 0.0(1085) Customer Service 50 48 50 2 0.9 1.0 1.0 0.0(1090) Performance Management 1,295 1,369 936 -433 10.8 11.0 8.0 -3.0(1095) Energy Management 2,109 601 648 47 4.5 6.0 5.0 -1.0(1110) Personnel - Public Education 0 452 265 -187 0.0 4.0 3.0 -1.0(1140) Information Technology - Public Education 0 197 201 4 0.0 2.0 2.0 0.0(1180) Communication - Public Education 0 266 142 -124 0.0 2.0 1.0 -1.0(1190) Performance Management - Public Education 0 699 1,499 800 0.0 0.0 5.0 5.0(1195) Environmental - Public Education 0 1,206 535 -671 0.0 9.0 4.0 -5.0No Activity Assigned 2,384 0 0 0 0.0 0.0 0.0 0.0Subtotal (1000) <strong>Agency</strong> Management Program 7,893 7,654 7,350 -303 26.2 50.0 45.0 -5.0(2000) Asset Management(2001) Lease Management 9,285 8,754 8,374 -380 10.9 12.0 10.0 -2.0(2003) Capital Construction 4 0 0 0 0.0 0.0 0.0 0.0(2004) Swing Space Funding 1,580 1,312 1,338 26 0.0 0.0 0.0 0.0(2006) Eastern Market 638 850 923 73 0.9 1.0 1.0 0.0(2101) Realty- Public Education 0 430 442 12 0.0 5.0 5.0 0.0Subtotal (2000) Asset Management 11,507 11,346 11,078 -268 11.8 18.0 16.0 -2.0(3000) Facility Operations(3001) Postal Services 739 655 671 16 5.4 6.0 6.0 0.0(3002) Facilities 248 18,981 40,906 21,925 0.0 115.0 116.0 1.0(3004) Parking 528 499 511 12 0.9 1.0 1.0 0.0(3005) RFK/DC Armory (Non-Military) Maintenance 2,392 4,356 4,356 0 14.6 16.0 16.0 0.0(3006) Facilities - D.C. General Hospital 6 0 0 0 0.0 0.0 0.0 0.0(3008) Janitorial Services 0 9,504 0 -9,504 0.0 6.0 0.0 -6.0(3009) Facilities- Public Education 0 40,469 43,276 2,806 0.0 219.8 225.2 5.5(3010) Facilities- Parks and Recreation 0 9,821 9,794 -27 0.0 104.5 94.8 -9.8(3012) Facilities- MPD 0 1,239 1,267 27 0.0 5.0 5.0 0.0(3013) Facilities- FEMS 0 500 470 -30 0.0 0.0 0.0 0.0Subtotal (3000) Facility Operations 3,912 86,025 101,251 15,226 20.9 473.2 464.0 -9.2(Continued on next page)Department <strong>of</strong> General ServicesA-134FY 2013 Proposed <strong>Budget</strong> and <strong>Financial</strong> Plan
Table AM0-4 (Continued)(dollars in thousands)Dollars in ThousandsFull-Time EquivalentsChangeChangeActual Approved Proposed from Actual Approved Proposed fromDivision/Activity FY 2011 FY 2012 FY 2013 FY 2012 FY 2011 FY 2012 FY 2013 FY 2012(4000) Protective Services(4001) Protective Services 0 28,034 33,039 5,005 0.0 121.0 111.0 -10.0(4040) Protective Services -87 0 0 0 0.0 0.0 0.0 0.0Subtotal (4000) Protective Services -87 28,034 33,039 5,005 0.0 121.0 111.0 -10.0(5000) Construction Services(5001) Construction Services 392 1,942 2,185 242 2.7 14.0 16.0 2.0(5101) Construction Division- Public Education 0 224 229 5 0.0 2.0 2.0 0.0Subtotal (5000) Construction Services 392 2,166 2,414 248 2.7 16.0 18.0 2.0(6000) Contracting and Procurement Services(6001) Contracting and Procurement Services 546 1,356 1,525 169 4.1 12.0 11.0 -1.0(6101) Contracting and Procurement Public Education 0 1,896 1,193 -702 0.0 23.0 13.0 -10.0Subtotal (6000) Contracting and Procurement Services 546 3,252 2,718 -534 4.1 35.0 24.0 -11.0(7000) Energy- Centrally Managed(7001) Auto Fuel 0 12,990 18,544 5,554 0.0 0.0 0.0 0.0(7002) Heating Fuel 0 1,478 870 -608 0.0 0.0 0.0 0.0(7003) Natural Gas 0 14,972 15,493 520 0.0 0.0 0.0 0.0(7004) Electricity 0 51,920 48,094 -3,826 0.0 0.0 0.0 0.0(7005) Steam 0 1,669 1,720 50 0.0 0.0 0.0 0.0(7006) Water 0 7,004 15,546 8,542 0.0 0.0 0.0 0.0Subtotal (7000) Energy- Centrally Managed 0 90,033 100,266 10,233 0.0 0.0 0.0 0.0(8000) Rent: In-Lease(8001) Rent: In-Lease 0 125,376 130,327 4,951 0.0 0.0 0.0 0.0Subtotal (8000) Rent: In-Lease 0 125,376 130,327 4,951 0.0 0.0 0.0 0.0Total Proposed Operating <strong>Budget</strong> 24,164 353,885 388,443 34,558 65.8 713.2 678.0 -35.2(Change is calculated by whole numbers and numbers may not add up due to rounding)Note: For more detailed information regarding <strong>the</strong> proposed funding for <strong>the</strong> activities within this agency’s programs, please see Schedule 30-PBBProgram Summary by Activity in <strong>the</strong> FY 2013 Operating Appendices located on <strong>the</strong> <strong>Office</strong> <strong>of</strong> <strong>the</strong> <strong>Chief</strong> <strong>Financial</strong> <strong>Office</strong>r’s website.FY 2013 Proposed <strong>Budget</strong> and <strong>Financial</strong> PlanDepartment <strong>of</strong> General ServicesA-135
FY 2013 Proposed <strong>Budget</strong> ChangesThe Department <strong>of</strong> General Services’ (DGS) proposed FY 2013 gross budget is $388,442,860, which representsa 9.8 percent increase over its FY 2012 approved gross budget <strong>of</strong> $353,885,345. The budget is comprised <strong>of</strong>$244,338,238 in Local funds, $6,579,157 in Special Purpose Revenue funds, and $137,525,466 in Intra-Districtfunds.Current Services Funding LevelThe Current Services Funding Level (CSFL) is a Local funds ONLY representation <strong>of</strong> <strong>the</strong> true cost <strong>of</strong> operatingDistrict agencies, before consideration <strong>of</strong> policy decisions. The CSFL reflects changes from <strong>the</strong> FY 2012 approvedbudget across multiple programs, and it estimates how much it would cost an agency to continue its current programsand operations into <strong>the</strong> following fiscal year. The initial adjustments in <strong>the</strong> budget proposal representchanges that should be compared to <strong>the</strong> FY 2013 CSFL budget and not necessarily changes made to <strong>the</strong> FY 2012Local funds budget. The FY 2013 CSFL adjustments to <strong>the</strong> FY 2012 Local funds budget are described in table 5<strong>of</strong> this agency's budget chapter. Please see <strong>the</strong> CSFL Development section within Volume 1: Executive Summaryfor more information regarding <strong>the</strong> methodology used and components that comprise <strong>the</strong> CSFL.DGS’s FY 2013 CSFL budget is $241,362,348, which represents a $35,936,310, or 17.5 percent, increase over<strong>the</strong> FY 2012 approved Local funds budget <strong>of</strong> $205,426,038.Major CSFL Cost DriversDGS’s CSFL funding for fixed costs reflects an increase <strong>of</strong> $33,513,230 to account for <strong>the</strong> District’s FY 2013 projectedgrowth in fixed costs over FY 2012. The growth in fixed costs was primarily driven by <strong>the</strong> rise in auto fuelprices and <strong>the</strong> District <strong>of</strong> Columbia’s Water Sewer and Authority’s impervious surface charge for water. Impervioussurfaces are mainly artificial structures—such as pavements (roads, sidewalks, driveways and parking lots) that arecovered by impenetrable materials such as asphalt, concrete, brick, and stone—and ro<strong>of</strong>tops. These pavement materialsseal <strong>the</strong> soil surface, eliminating rainwater infiltration and natural groundwater recharge.The FY 2013 CSFL calculated for DGS included ano<strong>the</strong>r adjustment entry that is not described in detail ontable 5. This adjustment was made for an increase <strong>of</strong> $443,300 to account for <strong>the</strong> operating budget impact <strong>of</strong> capitalprojects that have been completed. During <strong>the</strong> development <strong>of</strong> <strong>the</strong> CSFL, some adjustments such as this werecategorized as "o<strong>the</strong>r adjustments."Initial Adjusted <strong>Budget</strong>Cost Increase: To sustain current obligations and meet mission objectives, <strong>the</strong> agency’s budget proposal for SpecialPurpose Revenue funds reflects increases <strong>of</strong> $14,161 in personal services to cover salary, step increases and FringeBenefits in <strong>the</strong> RFK/DC Armory program, $68,073 to adjust for current spending for Overtime Pay at EasternMarket, $191,123 to cover fixed costs across several programs, and $300 for Equipment at RFK/DC Armory. InIntra-District funds, <strong>the</strong> budget proposal includes increases <strong>of</strong> $123,819 to properly align nonpersonal services withcurrent spending plans and $2,827,560 to cover <strong>the</strong> Energy Commodity.Cost Decrease: Adjustments in <strong>the</strong> budget proposal for Special Purpose Revenue funds include reductions <strong>of</strong>$71,235 in nonpersonal services to <strong>of</strong>fset an increase to Fringe Benefits and overtime, and $132,827 in O<strong>the</strong>rServices and Charges to align <strong>the</strong> budget with current spending plans for <strong>the</strong> Eastern Market. In Intra-Districtfunds, <strong>the</strong> budget proposal includes reductions <strong>of</strong> $7,086,681 in <strong>the</strong> Rent In-Lease program and $292,539 in <strong>the</strong>Protective Services division for Contractual Services.Transfers In: Various adjustments in <strong>the</strong> Local budget proposal reflect transfers <strong>of</strong> funding from o<strong>the</strong>r District agenciesto DGS. These adjustments include $6,832,892 from <strong>the</strong> District Department <strong>of</strong> Transportation (DDOT)and $1,300,500 from <strong>the</strong> Metropolitan Police Department (MPD). DGS’ Local funds budget includes increases<strong>of</strong> $208,783 for Rent and $1,289,804 for Security fixed costs due to a transfer <strong>of</strong> funding from <strong>the</strong> <strong>Office</strong> <strong>of</strong>Unified Communications (OUC).Department <strong>of</strong> General ServicesA-136FY 2013 Proposed <strong>Budget</strong> and <strong>Financial</strong> Plan
Correct: DGS’ FY 2013 Local funds budget proposal eliminates 7.2 unfunded positions to mainly reflect <strong>the</strong> transfer<strong>of</strong> former Department <strong>of</strong> Parks and Recreation facility maintenance positions.Additionally Adjusted <strong>Budget</strong>Technical Adjustment: Adjustments <strong>of</strong> Fringe Benefits to restore <strong>the</strong> District Government contribution foremployee health insurance from 72 percent, implemented in <strong>the</strong> FY 2011 budget, to 75 percent in FY 2013, resultingin increases <strong>of</strong> $216,045 in Local funds and $3,704 in Special Purpose Revenue funds.Policy InitiativesEliminate: A cost savings <strong>of</strong> $2,288,736 and 26.0 FTEs in Local funds with <strong>the</strong> removal <strong>of</strong> vacant positions acrossseveral programs.Cost Increase: A new security contract in <strong>the</strong> Protective Services division results in an increase <strong>of</strong> $3,736,874.Cost Decrease: The agency implemented several cost-saving measures to reduce electricty spending by $6,800,000in <strong>the</strong> Energy-Centrally Managed division. Additionally, <strong>the</strong> agency retr<strong>of</strong>itted several District buildings to attainenergy savings <strong>of</strong> $1,059,000 in <strong>the</strong> Energy-Centrally Managed division. DGS’ Local funds budget proposal eliminates2.0 FTEs, resulting in cost savings <strong>of</strong> $211,272. The agency also adjusted <strong>the</strong> Local funds budget in <strong>the</strong> AssetManagement program for a reduction <strong>of</strong> $250,000 due to projected cost savings in lease management.FY 2013 Proposed <strong>Budget</strong> and <strong>Financial</strong> PlanDepartment <strong>of</strong> General ServicesA-137
FY 2012 Approved <strong>Budget</strong> to FY 2013 Proposed <strong>Budget</strong>, by Revenue TypeTable AM0-5 itemizes <strong>the</strong> changes by revenue type between <strong>the</strong> FY 2012 approved budget and <strong>the</strong> FY 2013 proposedbudget.Table AM0-5(dollars in thousands)PROGRAM BUDGET FTELOCAL FUNDS: FY 2012 Approved <strong>Budget</strong> and FTE 205,426 696.2Fringe Benefit Rate Adjustment Multiple Programs 647 0.0O<strong>the</strong>r Adjustments Multiple Programs 443 0.0Fixed Cost Inflation Factor Multiple Programs 33,513 0.0Consumer Price Index Multiple Programs 1,116 0.0Personal Services Growth Factor Multiple Programs 217 0.0FY 2013 Current Services Funding Level <strong>Budget</strong> (CSFL) 241,362 696.2Transfer In: From DDOT Energy-Centrally Managed 6,833 0.0Transfer In: From MPD Rent: In-Lease 1,300 0.0Transfer In: From OUC Rent: In-Lease 209 0.0Transfer In: From OUC for Security Protective Services 1,290 0.0Correct: Unfunded positions <strong>Agency</strong> Management Program 0 -7.2FY 2013 Initial Adjusted <strong>Budget</strong> 250,994 689.0Technical Adjustment: Health insurance contribution Multiple Programs 216 0.0FY 2013 Additionally Adjusted <strong>Budget</strong> 251,210 689.0FY 2013 Policy InitiativesEliminate: Vacant positions Multiple Programs -2,289 -26.0Cost Increase: New security contract Protective Services 3,737 0.0Cost Decrease: Contract savings Energy-Centrally Managed -6,800 0.0Cost Decrease: Retr<strong>of</strong>it District buildings to improve energy savings Energy-Centrally Managed -1,059 0.0Cost Decrease: Eliminate positions. Multiple Programs -211 -2.0Cost Decrease: O<strong>the</strong>r Services and Charges Asset Management -250 0.0LOCAL FUNDS: FY 2013 Proposed <strong>Budget</strong> and FTE 244,338 661.0SPECIAL PURPOSE REVENUE FUNDS: FY 2012 Approved <strong>Budget</strong> and FTE 6,506 17.0Cost Increase: For Regular Pay and Fringe Benefits Multiple Programs 14 0.0Cost Increase: Adjustment based on current spending for Overtime Pay Asset Management 68 0.0Cost Increase: For fixed cost Multiple Programs 191 0.0Cost Increase: Equipment (less than $500) Facility Operations 0 0.0Cost Decrease: Adjustment to nonpersonal services to <strong>of</strong>fset increase Multiple Programs -71 0.0to Fringe BenefitsCost Decrease: O<strong>the</strong>r Services and Charges Asset Management -133 0.0FY 2013 Initial Adjusted <strong>Budget</strong> 6,576 17.0Technical Adjustment: Health insurance contribution Multiple Programs 4 0.0FY 2013 Additionally Adjusted <strong>Budget</strong> 6,579 17.0SPECIAL PURPOSE REVENUE FUNDS: FY 2013 Proposed <strong>Budget</strong> and FTE 6,579 17.0INTRA-DISTRICT FUNDS: FY 2012 Approved <strong>Budget</strong> and FTE 141,953 0.0Cost Increase: Adjustment to match spending plan Facility Operations 124 0.0Cost Increase: Adjustment to Energy-related fixed costs Energy- Centrally Managed 2,828 0.0Cost Decrease: Adjustment in Rentals to match spending plan Rent: In-Lease -7,087 0.0Cost Decrease: Adjustment in Contractual Services to match spending plan Protective Services -293 0.0FY 2013 Initial Adjusted <strong>Budget</strong> 137,525 0.0INTRA-DISTRICT FUNDS: FY 2013 Proposed <strong>Budget</strong> and FTE 137,525 0.0Gross for AM0 - Department <strong>of</strong> General Services 388,443 678.0(Change is calculated by whole numbers and numbers may not add up due to rounding)Department <strong>of</strong> General ServicesA-138FY 2013 Proposed <strong>Budget</strong> and <strong>Financial</strong> Plan
<strong>Agency</strong> Performance PlanThe agency has <strong>the</strong> following objectives and performance indicators for <strong>the</strong>ir Divisions:1. <strong>Office</strong> <strong>of</strong> <strong>the</strong> DirectorObjective 1: Provide oversight, support and program evaluation <strong>of</strong> DGS divisions to drive agency-wide performanceimprovement.Objective 2: Fully integrate predecessor agency functions and processes to achieve maximum efficiency without serviceinterruptions.Objective 3: Ensure that program budget and finance operations are efficient and transparent.Objective 4: Improve <strong>the</strong> efficiency and utilization <strong>of</strong> <strong>the</strong> fleet program.Proposed Key Performance - <strong>Office</strong> <strong>of</strong> <strong>the</strong> DirectorFY 2011 FY 2012 FY 2012 FY 2013 FY 2014Measure Actual Target YTD Projection ProjectionNumber <strong>of</strong> employees completed performance Not Notgoals and objectives on schedule 249 Available Available TBD TBDNumber <strong>of</strong> employees completed mid-year review Not Not212 Available Available TBD TBDNumber <strong>of</strong> employees whose managers completed Not Notevaluation reviews (year-end) 204 Available Available TBD TBDFY 2013 Proposed <strong>Budget</strong> and <strong>Financial</strong> PlanDepartment <strong>of</strong> General ServicesA-139
2. Capital Construction Services DivisionObjective 1: Consolidate procedures, sustainable development initiatives, Capital Improvement Plans (CIP’s), andcapital construction activities <strong>of</strong> all consolidated agencies.Objective 2: Major Construction – Government – Support <strong>the</strong> efficient provision <strong>of</strong> government services throughhigh quality and efficient stewardship <strong>of</strong> constructed assets.Objective 3: Major Construction – Public Safety – Support <strong>the</strong> provision <strong>of</strong> efficient public safety programsthrough effective project management and planning.Objective 4: Major Construction – Education - Modernize existing education facilities as well as construct newschools.Objective 5: Major Construction – Department <strong>of</strong> Parks and Recreation - Modernize existing as well as constructnew recreation centers, parks, fields, playgrounds and pool facilities.Objective 6: Small Capital Projects – Support <strong>the</strong> efficient provision <strong>of</strong> government services through high qualityand efficient stewardship <strong>of</strong> constructed assets.Proposed Key Performance - Construction DivisionFY 2010 FY 2011 FY 2012 FY 2012 FY 2013 FY 2014Measure Actual Actual Target YTD Projection ProjectionPercent <strong>of</strong> design and construction projectswithout exceeding 10 percent <strong>of</strong> <strong>the</strong> original schedule -Government Construction 71% 90% 84% 100% 90% 100%Percent <strong>of</strong> construction projects completed withoutexceeding 10 percent <strong>of</strong> original budget -Government Construction 94% 90% 84% 100% 90% 100%Percent <strong>of</strong> construction projects where DGSdirectedchange order values do not exceed 5 percent <strong>of</strong><strong>the</strong> original awarded construction contracts -Government Construction 83% 80% 84% 87.5% 90% 100%Percent <strong>of</strong> new DGS capital projects that wereassigned to a project manager and had a scheduledeveloped within 7 days <strong>of</strong> funding -Government Construction 100% 99% 99% 85% 100% 100%Number <strong>of</strong> school modernization projects underwayon time within <strong>the</strong> project deadlines 19 17 22 22 22 25Number <strong>of</strong> school modernization projects underwaywithin <strong>the</strong> budget 19 15 22 19 1 22 25Number <strong>of</strong> ongoing School Improvement Teams (S.I.T) 17 15 21 21 22 25Number <strong>of</strong> square feet modernized school facilities 1,200,000 1,077,950 1,235,621 4,220,839 2 969,403 2,309,108Percentage <strong>of</strong> DGS capital projects completed on Not Notschedule – Parks and Recreation 71.19% Available Available 95% 100% 100%(Continued on next page)Department <strong>of</strong> General ServicesA-140FY 2013 Proposed <strong>Budget</strong> and <strong>Financial</strong> Plan
Proposed Key Performance - Construction Division (Continued)FY 2010 FY 2011 FY 2012 FY 2012 FY 2013 FY 2014Measure Actual Actual Target YTD Projection ProjectionPercentage <strong>of</strong> DGS capital projects completed late – Not NotParks and Recreation 28.81% Available Available 5% 0% 0%Percentage <strong>of</strong> DGS capital projects completedwithin budget limit – Parks and Recreation Not Not100% Available Available 100% 100% 100%Contract dollars spent with Certified BusinessEnterprises (CBE) - School Construction 3 53% 49% 50% 51% 50% 50%3. Facility Management DivisionObjective 1: Provide a clean, safe and operational work environment for District agencies through effective andefficient facility management and maintenance.Proposed Key Performance - Facility Management DivisionFY 2010 FY 2011 FY 2012 FY 2012 FY 2013 FY 2014Measure Actual Actual Target YTD Projection ProjectionNumber <strong>of</strong> maintenance requests completed withinNot3 days 706 Available 2500 50 TBD TBDNumber <strong>of</strong> maintenance requests completed withinNot4-15 days 350 Available 500 241 TBD TBDNumber <strong>of</strong> maintenance requests completed withinNot16-30 days 108 Available 100 452 TBD TBDNumber <strong>of</strong> maintenance requests outstanding forNotmore than 30 days 123 Available 50 151 TBD TBDNumber <strong>of</strong> maintenance requests outstanding forNotmore than 60 days 109 Available 25 271 TBD TBDNumber <strong>of</strong> maintenance requests outstanding forNotmore than 90 days 486 Available 20 383 TBD TBDPercentage <strong>of</strong> athletic fields rated “Average” or better Not Notrating by STMA PCI Available 50% 55% Available TBD TBDPercentage <strong>of</strong> outdoor pools opened on time for <strong>the</strong>Notseason 100% 100% 100% Available TBD TBDPercentage <strong>of</strong> children pools closed before <strong>the</strong> end <strong>of</strong>Notseason 0% 0% 100% Available TBD TBDPercentage <strong>of</strong> spray parks closed before <strong>the</strong> end <strong>of</strong>Notseason 100% 100% 100% Available TBD TBDPercentage <strong>of</strong> children pool closed before <strong>the</strong> end Not Not<strong>of</strong> season Available 0% 0% Available TBD TBD(Continued on next page)FY 2013 Proposed <strong>Budget</strong> and <strong>Financial</strong> PlanDepartment <strong>of</strong> General ServicesA-141
Proposed Key Performance - Facility Management Division (Continued)FY 2010 FY 2011 FY 2012 FY 2012 FY 2013 FY 2014Measure Actual Actual Target YTD Projection ProjectionPercentage <strong>of</strong> children pool closed before <strong>the</strong> Not Notend <strong>of</strong> season Available 0% 0% Available TBD TBDPercentage <strong>of</strong> parks closed before <strong>the</strong> end <strong>of</strong> season Not NotAvailable 0% 0% Available TBD TBDNumber <strong>of</strong> premier fields Not NotAvailable 29 15 Available TBD TBDPercentage <strong>of</strong> emergency repair requests respondedto within 2 hours 63% 81% 90% 92% TBD TBDPercentage <strong>of</strong> non-emergency 4 repair requestsresponded to within 48 hours 86% 93% 95% 91% TBD TBDPercentage <strong>of</strong> completed work orders in FAST thatare preventive maintenance 5 94% 17% 75% 12.5% TBD TBDTotal completed preventive maintenance work orders Not Not Notin FAST 6 Available Available Available 708 TBD TBDNumber <strong>of</strong> open work orders-across <strong>the</strong> agencySchool Facilities 5,069 4,764 5,000 7,236 TBD TBDNumber <strong>of</strong> work orders cleared - School Facilities 21,381 27,067 15,000 3,456 TBD TBD4. Portfolio Management DivisionObjective 1: Generate additional revenue by leasing space in school buildings and on school grounds through varioustypes <strong>of</strong> agreements including use, lease and license agreements.Objective 2: Ensure accurate, timely and transparent financial transactions.Objective 3: Maximize <strong>the</strong> efficient and effective use <strong>of</strong> District-owned property by agencies and reduce dependenceon leased space.Proposed Key Performance - Portfolio DivisionFY 2010 FY 2011 FY 2012 FY 2012 FY 2013 FY 2014Measure Actual Actual Target YTD Projection ProjectionReduction <strong>of</strong> leased space by 700,000 SF over 3 years 3,770,918 3,191,439 3,077,949 3,171,534 3,016,390 2,956,062SF SF SF SF SF SFPercent <strong>of</strong> leased space that is currently occupied 7 99.6% 100% 100% 100% 100% 100%Percent <strong>of</strong> under-utilized space sublet to third parties Not Not Not NotAvailable Available Available Available TBD TBDGross revenue - School Facilities $3.75 $3.36 $ 3.1 Not TBD TBDMillion Million Million AvailableDepartment <strong>of</strong> General ServicesA-142FY 2013 Proposed <strong>Budget</strong> and <strong>Financial</strong> Plan
5. Sustainability and Energy Management DivisionObjective 1: Reduce energy costs and resource consumption.Objective 2: Increase <strong>the</strong> diversion percentage <strong>of</strong> recyclables and compostable waste from landfills.Proposed Key Performance - Sustainability and Energy Management DivisionFY 2010 FY 2011 FY 2012 FY 2012 FY 2013 FY 2014Measure Actual Actual Target YTD Projection ProjectionTotal reduction in electricity consumption at 3% from 5% from 5% fromdesignated buildings 8 , adjusted for wea<strong>the</strong>r Not baseline baseline baseline(heating and cooling days) kwh 394,759,250 Available 392,453,083 80,360,683 388,407,175 384,361,267kwh kwh kwh kwhTotal recycling diversion rate at <strong>the</strong> Big 4: Wilson,Reeves, One Judiciary Square, Daly (i.e. percent<strong>of</strong> overall waste that is recycled) 51% 50% 52% 52% 52% 53%6.Protective Services Police DepartmentObjective 1: Provide a safe and secure work environment by providing effective and efficient physical security andlaw enforcement services through a highly-trained and pr<strong>of</strong>essional law enforcement agency.Proposed Key Performance - Protective Services Police DepartmentFY 2010 FY 2011 FY 2012 FY 2012 FY 2013 FY 2014Measure Actual Actual Target YTD Projection Projection8 9% 0% 2%Reduction <strong>of</strong> Contract guard hours utilized 9 from from from TBD TBDprevious previous previousyear year yearMean time to respond to service calls 10 4 4.73 15 4.52 7.5 7.5minutes minutes minutes minutes minutesPercent <strong>of</strong> calls for service responded to within20 minutes during all hours 96% 96% 100% 96% 90% 90%Percent <strong>of</strong> building checks performed monthly <strong>of</strong> asubset <strong>of</strong> 144 DGS-owned and leased buildings. 11 12 99% 87% 90% 84% 90% TBDNumber <strong>of</strong> building assessments conducted toanalyze technology upgrades and security needs. 47 32 40 7 40 40FY 2013 Proposed <strong>Budget</strong> and <strong>Financial</strong> PlanDepartment <strong>of</strong> General ServicesA-143
7. Contracting & Procurement DivisionObjective 1: Streamline procurement processes and procedures.Objective 2: Provide quality training that result in increased procurement knowledge, more efficient procurementprocessing, and shorter procurement timelines.Objective 3: Ensure transparency and accountability throughout <strong>the</strong> procurement process.Objective 4: Support CBE programs through performance enhancement programs and increased compliancemonitoring on existing and upcoming contracts.Objective 5: Minimize procurement costs and processing times for routine services.Proposed Key Performance - Contracting and Procurement DivisionFY 2010 FY 2011 FY 2012 FY 2012 FY 2013 FY 2014Measure Actual Actual 13 Target YTD Projection ProjectionAverage time for processing a simplified acquisition 14 7 4.3 6 Not 6 6business business Available business businessdays days days daysPercentage DGS procurement reviewed for legalNotsufficiency by OAG in 5 business days 15 33% 84% 93% Available 95% 95%Average time for awarding an Invitation for Bids 46% 53 90 Not Not Not(IFB) under $1M 16 calendar calendar Applicable Applicable Applicabledays daysDepartment <strong>of</strong> General ServicesA-144FY 2013 Proposed <strong>Budget</strong> and <strong>Financial</strong> Plan
Performance Plan Endnotes:1. Upon approval <strong>of</strong> <strong>the</strong> FY 2012 reprogramming /amended Capital Improvement Plan (CIP) all 19 activemodernization and Phase 1 projects will be within budget.2. Cumulative data from 2007 to present. Actual YTD measure is determined at <strong>the</strong> end <strong>of</strong> <strong>the</strong> fiscal year basedon completed projects.3. Cumulative data from 2007 to present.4. Emergency repairs are issues which impact agency operations or <strong>the</strong> life, safety and health <strong>of</strong> building occupants.5. This measure does not include external requests for service.6. This number will increase as preventive maintenance schedules are fur<strong>the</strong>r developed and funded.7. The industry standard based on CoStar for optimizing occupancy rates is to maintain 5 percent <strong>of</strong> <strong>the</strong> spaceas unoccupied. This reserve space provides flexibility to accommodate additional temporary or long-termbuilding occupants or any o<strong>the</strong>r changes in space configurations. A 100 percent occupancy rate for leased andDistrict-owned <strong>of</strong>fice space <strong>the</strong>refore refers in actuality to full occupancy <strong>of</strong> 95 percent <strong>of</strong> <strong>the</strong> total spaceremaining after accounting for <strong>the</strong> 5 percent set-aside.8. Designated buildings are <strong>the</strong> Big 4: Daly, Reeves, One Judiciary Square, Wilson Building.9. Percentage reductions are calculated using present year comparisons to utilization rates in previous years.10.Industry standard is 20 minutes and is based on IACP-International Association <strong>of</strong> <strong>Chief</strong>s <strong>of</strong> Police.11.During <strong>the</strong> course <strong>of</strong> inspections conducted by PSPD’s Penetration Interdiction and Tracking team (PIT), allelectronic screening devices are validated.12.In July 2011, PSPD was instructed to calculate this measure in a different way which drastically reducedPSPD’s ability to meet this measure’s expected goal.13.Based on FY 2011 DRES year-end actuals.14.Tracked from when final scope <strong>of</strong> work is received by contracting <strong>of</strong>ficer to PASS purchase order issue date.15.Tracked from when <strong>the</strong> <strong>Office</strong> <strong>of</strong> Attorney General (OAG) assigns a lawyer to review <strong>the</strong> documents to whenDGS receives a letter with <strong>the</strong>ir comments.16.In FY 2012, DGS will no longer be utilizing <strong>the</strong> IFB method to procure goods and services. Instead, <strong>the</strong>agency will utilize <strong>the</strong> competitive sealed bid or Request for Proposal (RFP) process.FY 2013 Proposed <strong>Budget</strong> and <strong>Financial</strong> PlanDepartment <strong>of</strong> General ServicesA-145
Contract Appeals Board(AF0)http://cab.dc.govTelephone: 202-727-6597% ChangeFY 2011 FY 2012 FY 2013 fromDescription Actual Approved Proposed FY 2012Operating <strong>Budget</strong> $764,749 $796,107 $1,051,447 32.1FTEs 5.6 6.0 8.0 33.3The mission <strong>of</strong> <strong>the</strong> Contract Appeals Board is to provide an impartial,expeditious, inexpensive, and knowledgeable forum for <strong>the</strong> hearingand resolving <strong>of</strong> contractual disputes and protests involving <strong>the</strong>District and its contracting communities.Summary <strong>of</strong> ServicesThe Contract Appeals Board adjudicates protests <strong>of</strong> District contract solicitations and awards, appeals by contractors<strong>of</strong> District contracting <strong>of</strong>ficer final decisions, claims by <strong>the</strong> District against contractors, appeals by contractors<strong>of</strong> suspensions and debarments, and contractor appeals <strong>of</strong> interest payment claims under <strong>the</strong> Quick Payment Act.The agency’s FY 2013 proposed budget is presented in <strong>the</strong> following tables:FY 2013 Proposed <strong>Budget</strong> and <strong>Financial</strong> PlanContract Appeals BoardA-147
FY 2013 Proposed Gross Funds Operating <strong>Budget</strong>, by Revenue TypeTable AF0-1 contains <strong>the</strong> proposed FY 2013 agency budget compared to <strong>the</strong> FY 2012 approved budget. It alsoprovides FY 2010 and FY 2011 actual expenditures.Table AF0-1(dollars in thousands)ChangeActual Actual Approved Proposed from PercentAppropriated Fund FY 2010 FY 2011 FY 2012 FY 2013 FY 2012 Change*General FundLocal Funds 1,032 765 796 1,051 255 32.1Total for General Fund 1,032 765 796 1,051 255 32.1Gross Funds 1,032 765 796 1,051 255 32.1*Percent change is based on whole dollars.Note: If applicable, for a breakdown <strong>of</strong> each Grant (Federal and Private), Special Purpose Revenue type and Intra-District agreement,please refer to Schedule 80 <strong>Agency</strong> Summary by Revenue Source in <strong>the</strong> FY 2013 Operating Appendices located on <strong>the</strong> <strong>Office</strong> <strong>of</strong> <strong>the</strong><strong>Chief</strong> <strong>Financial</strong> <strong>Office</strong>r’s website.FY 2013 Proposed Full-Time Equivalents, by Revenue TypeTable AF0-2 contains <strong>the</strong> proposed FY 2013 FTE level compared to <strong>the</strong> FY 2012 approved FTE level by revenuetype. It also provides FY 2010 and FY 2011 actual data.Table AF0-2ChangeActual Actual Approved Proposed from PercentAppropriated Fund FY 2010 FY 2011 FY 2012 FY 2013 FY 2012 ChangeGeneral FundLocal Funds 5.5 5.6 6.0 8.0 2.0 33.3Total for General Fund 5.5 5.6 6.0 8.0 2.0 33.3Total Proposed FTEs 5.5 5.6 6.0 8.0 2.0 33.3Contract Appeals BoardA-148FY 2013 Proposed <strong>Budget</strong> and <strong>Financial</strong> Plan
FY 2013 Proposed Operating <strong>Budget</strong>, by Comptroller Source GroupTable AF0-3 contains <strong>the</strong> proposed FY 2013 budget at <strong>the</strong> Comptroller Source Group (object class) level comparedto <strong>the</strong> FY 2012 approved budget. It also provides FY 2010 and FY 2011 actual expenditures.Table AF0-3(dollars in thousands)ChangeActual Actual Approved Proposed from PercentComptroller Source Group FY 2010 FY 2011 FY 2012 FY 2013 FY 2012 Change*11 - Regular Pay - Continuing Full Time 237 211 236 404 167 70.912 - Regular Pay - O<strong>the</strong>r 389 375 420 439 19 4.613 - Additional Gross Pay 0 44 0 0 0 N/A14 - Fringe Benefits - Current Personnel 112 100 120 168 48 39.9Subtotal Personal Services (PS) 738 731 776 1,010 235 30.220 - Supplies and Materials 1 3 3 3 0 2.031 - Telephone, Telegraph, Telegram, Etc. 8 1 0 0 0 N/A32 - Rentals - Land and Structures 244 0 0 0 0 N/A35 - Occupancy Fixed Costs 1 0 0 0 0 N/A40 - O<strong>the</strong>r Services and Charges 7 6 2 2 1 34.941 - Contractual Services - O<strong>the</strong>r 27 16 13 20 7 50.070 - Equipment and Equipment Rental 6 8 3 17 14 456.9Subtotal Nonpersonal Services (NPS) 294 34 20 41 21 103.1Gross Funds 1,032 765 796 1,051 255 32.1*Percent change is based on whole dollars.Program DescriptionThe Contract Appeals Board operates through <strong>the</strong> following 2 programs:Adjudication – <strong>the</strong> Contract Appeals Board adjudicates protests <strong>of</strong> District contract solicitations and awards,appeals by contractors <strong>of</strong> District contracting <strong>of</strong>ficer final decisions, claims by <strong>the</strong> District against contractors,appeals by contractors <strong>of</strong> suspensions and debarments, and contractor appeals <strong>of</strong> interest payment claims under <strong>the</strong>Quick Payment Act.Contract Appeals Board (<strong>Agency</strong> Management Program) – provides for administrative support and <strong>the</strong> requiredtools to achieve operational and programmatic results. This program is standard for all agencies using performancebasedbudgeting.Program Structure ChangeThe Contract Appeals Board has no program structure changes in <strong>the</strong> FY 2013 proposed budget.FY 2013 Proposed <strong>Budget</strong> and <strong>Financial</strong> PlanContract Appeals BoardA-149
FY 2013 Proposed Operating <strong>Budget</strong> and FTEs, by Program and ActivityTable AF0-4 contains <strong>the</strong> proposed FY 2013 budget by program and activity compared to <strong>the</strong> FY 2012 approved budget.It also provides <strong>the</strong> FY 2011 actual data.Table AF0-4(dollars in thousands)Dollars in ThousandsFull-Time EquivalentsChangeChangeActual Approved Proposed from Actual Approved Proposed fromProgram/Activity FY 2011 FY 2012 FY 2013 FY 2012 FY 2011 FY 2012 FY 2013 FY 2012(1000) Contract Appeals Board(1030) Property Management 1 0 1 1 0.0 0.0 0.0 0.0(1090) Performance Management 169 185 389 204 0.9 1.0 3.0 2.0Subtotal (1000) Contract Appeals Board 169 186 390 204 0.9 1.0 3.0 2.0(2000) Adjudication(2001) Adjudication 595 611 662 51 4.6 5.0 5.0 0.0Subtotal (2000) Adjudication 595 611 662 51 4.6 5.0 5.0 0.0Total Proposed Operating <strong>Budget</strong> 765 796 1,051 255 5.6 6.0 8.0 2.0(Change is calculated by whole numbers and numbers may not add up due to rounding)Note: For more detailed information regarding <strong>the</strong> proposed funding for <strong>the</strong> activities within this agency’s programs, please see Schedule 30-PBBProgram Summary by Activity in <strong>the</strong> FY 2013 Operating Appendices located on <strong>the</strong> <strong>Office</strong> <strong>of</strong> <strong>the</strong> <strong>Chief</strong> <strong>Financial</strong> <strong>Office</strong>r’s website.FY 2013 Proposed <strong>Budget</strong> ChangesThe Contract Appeals Board’s (CAB) proposed FY 2013 gross budget is $1,051,447, which represents a 32.1 percentincrease over its FY 2012 approved gross budget <strong>of</strong> $796,107. The budget is comprised entirely <strong>of</strong> Local funds.Current Service Funding LevelThe Current Services Funding Level (CSFL) is a Local funds ONLY representation <strong>of</strong> <strong>the</strong> true cost <strong>of</strong> operatingDistrict agencies, before consideration <strong>of</strong> policy decisions. The CSFL reflects changes from <strong>the</strong> FY 2012 approvedbudget across multiple programs, and it estimates how much it would cost an agency to continue its current programsand operations into <strong>the</strong> following fiscal year. The initial adjustments in <strong>the</strong> budget proposal represent changesthat should be compared to <strong>the</strong> FY 2013 CSFL budget and not necessarily changes made to <strong>the</strong> FY 2012 Localfunds budget. The FY 2013 CSFL adjustments to <strong>the</strong> FY 2012 Local funds budget are described in table 5 <strong>of</strong> thisagency's budget chapter. Please see <strong>the</strong> CSFL Development section within Volume 1: Executive Summary for moreinformation regarding <strong>the</strong> methodology used and components that comprise <strong>the</strong> CSFL.CAB's FY 2013 CSFL budget is $808,196, which represents a $12,089, or 1.5 percent, increase over <strong>the</strong> FY2012 approved Local funds budget <strong>of</strong> $796,107.Contract Appeals BoardA-150FY 2013 Proposed <strong>Budget</strong> and <strong>Financial</strong> Plan
Initial Adjusted <strong>Budget</strong>Cost Increase: $6,433 in Local funds to support a cost increase in Contractual Services.Cost Decrease: $6,433 in Local funds in personal services resulting from expected vacancy savings.Additionally Adjusted <strong>Budget</strong>Technical Adjustment: Adjustment <strong>of</strong> Fringe Benefits to restore <strong>the</strong> District Government contribution for employeehealth insurance from 72 percent, implemented in <strong>the</strong> FY 2011 budget, to 75 percent in FY 2013, resulting inan increase <strong>of</strong> $2,807 in Local funds.Policy InitiativeCost Increase: $28,196 in <strong>the</strong> Adjudication program and $8,248 in <strong>the</strong> Contract Appeals program to cover a payequity adjustment related to D.C. Code section 2.309.01, $190,000 and 2.0 FTEs in <strong>the</strong> Contract Appeal programto alleviate <strong>the</strong> agency’s backlog <strong>of</strong> cases, and $14,000 in <strong>the</strong> Adjudication program for Equipment and necessarys<strong>of</strong>tware upgrades.FY 2012 Approved <strong>Budget</strong> to FY 2013 Proposed <strong>Budget</strong>, by Revenue TypeTable AF0-5 itemizes <strong>the</strong> changes by revenue type between <strong>the</strong> FY 2012 approved budget and <strong>the</strong> FY 2013 proposedbudget.Table AF0-5(dollars in thousands)Program BUDGET FTELOCAL FUNDS: FY 2012 Approved <strong>Budget</strong> and FTE 796 6.0Fringe Benefit Rate Adjustment Multiple Programs 8 0.0Consumer Price Index (less than $500) Multiple Programs 0 0.0Personal Services Growth Factor Multiple Programs 3 0.0FY 2013 Current Services Funding Level <strong>Budget</strong> (CSFL) 808 6.0Cost Increase: In Local funds to support contractual Multiple Programs 6 0.0costs related to document archivingCost Decrease: In Local funds from expected vacancy Multiple Programs -6 0.0savings to support cost increase in Contractual ServicesFY 2013 Initial Adjusted <strong>Budget</strong> 808 6.0Technical Adjustment: Health insurance contribution Multiple Programs 3 0.0FY 2013 Additionally Adjusted <strong>Budget</strong> 811 6.0FY 2013 Policy InitiativesCost Increase: To cover pay equity adjustment Adjudication 28 0.0related to D.C. Code section 2.309.01Cost Increase: To cover pay equity adjustment related Contract Appeals Board 8 0.0to D.C. Code section 2.309.01Cost Increase: To alleviate backlog <strong>of</strong> cases Contract Appeals Board 190 2.0Cost Increase: Equipment and s<strong>of</strong>tware upgrades Adjudication 14 0.0LOCAL FUNDS: FY 2013 Proposed <strong>Budget</strong> and FTE 1,051 8.0Gross for AF0 - Contract Appeals Board 1,051 8.0(Change is calculated by whole numbers and numbers may not add up due to rounding)FY 2013 Proposed <strong>Budget</strong> and <strong>Financial</strong> PlanContract Appeals BoardA-151
<strong>Agency</strong> Performance PlansThe agency’s performance plan has <strong>the</strong> following objectives for FY 2013:Objective 1: Promote confidence in <strong>the</strong> integrity <strong>of</strong> <strong>the</strong> procurement process through equitable, timely, efficient,and legally correct adjudication <strong>of</strong> disputes and protests.Objective 2: Assist parties to resolve disputes through negotiation and settlement by initiating early case intervention,focusing attention on critical facts, resolving threshold legal issues, and conducting regular status conferences.Objective 3: Educate government and private contracting parties on resolving disputes through traditional andalternative dispute resolution methods.<strong>Agency</strong> Performance MeasuresFY 2010 FY 2011 FY 2011 FY 2012 FY 2013 FY 2014Measure Actual Target Actual Projection Projection ProjectionPercentage <strong>of</strong> protests resolved within 60 businessdays. 86.84% 90% 73% 90% TBD TBDPercentage <strong>of</strong> appeals cases decided within 4 months<strong>of</strong> <strong>the</strong> cases being ready for decision. 80.77% 90% 85% 90% TBD TBDPercentage <strong>of</strong> new cases using electronic filing system.100% 100% 100% 100% TBD TBDNotPercentage <strong>of</strong> decisions sustained on appeal 100% 100% Available 100% TBD TBDPercentage <strong>of</strong> cases closed by <strong>the</strong> Board which areelectronically archived to permit web-based retrievaland full-text searching capability. 100% 95% 100% 95% TBD TBDContract Appeals BoardA-152FY 2013 Proposed <strong>Budget</strong> and <strong>Financial</strong> Plan
Board <strong>of</strong> Electionswww.dcboee.orgTelephone: 202-727-2525(DL0)% ChangeFY 2011 FY 2012 FY 2013 fromDescription Actual Approved Proposed FY 2012Operating <strong>Budget</strong> $6,427,928 $4,417,635 $5,961,956 35.0FTEs 43.2 59.2 59.8 0.8The Board <strong>of</strong> Elections (BOE), a chartered independent agency, iscomprised <strong>of</strong> a three-member Board along with a small but dedicatedstaff that carries out <strong>the</strong> agency’s mission. The mission <strong>of</strong> BOE is toenfranchise eligible residents, conduct elections, and assure <strong>the</strong> integrity<strong>of</strong> <strong>the</strong> electoral process. This mission is mandated by federal andlocal statutes. The schedule <strong>of</strong> <strong>the</strong> elections, which is directed by law,requires flexibility in <strong>the</strong> funding levels from year to year.Summary <strong>of</strong> ServicesBOE operates <strong>the</strong> District’s voter registration system; administers <strong>the</strong> ballot access for candidates and measures;delivers comprehensive public, media, and voter information services; maintains technical systems to support voting,ballot tabulation, and electronic mapping <strong>of</strong> election district boundaries; plans and implements each District<strong>of</strong> Columbia election; and performs legal counsel, rulemaking, and adjudication functions.The agency’s FY 2013 proposed budget is presented in <strong>the</strong> following tables:FY 2013 Proposed <strong>Budget</strong> and <strong>Financial</strong> PlanBoard <strong>of</strong> ElectionsA-153
FY 2013 Proposed Gross Funds Operating <strong>Budget</strong>, by Revenue TypeTable DL0-1 contains <strong>the</strong> proposed FY 2013 agency budget compared to <strong>the</strong> FY 2012 approved budget. It alsoprovides FY 2010 and FY 2011 actual expenditures.Table DL0-1(dollars in thousands)ChangeActual Actual Approved Proposed from PercentAppropriated Fund FY 2010 FY 2011 FY 2012 FY 2013 FY 2012 Change*General FundLocal Funds 4,995 4,536 4,268 5,812 1,544 36.2Total for General Fund 4,995 4,536 4,268 5,812 1,544 36.2Federal ResourcesFederal Payments 3,479 1,892 0 0 0 N/AFederal Grant Funds 0 0 150 150 0 0.0Total for Federal Resources 3,479 1,892 150 150 0 0.0Gross Funds 8,474 6,428 4,418 5,962 1,544 35.0*Percent change is based on whole dollars.Note: If applicable, for a breakdown <strong>of</strong> each Grant (Federal and Private), Special Purpose Revenue type and Intra-District agreement,please refer to Schedule 80 <strong>Agency</strong> Summary by Revenue Source in <strong>the</strong> FY 2013 Operating Appendices located on <strong>the</strong> <strong>Office</strong> <strong>of</strong> <strong>the</strong><strong>Chief</strong> <strong>Financial</strong> <strong>Office</strong>r’s website.FY 2013 Proposed Full-Time Equivalents, by Revenue TypeTable DL0-2 contains <strong>the</strong> proposed FY 2013 FTE level compared to <strong>the</strong> FY 2012 approved FTE level by revenuetype. It also provides FY 2010 and FY 2011 actual data.Table DL0-2ChangeActual Actual Approved Proposed from PercentAppropriated Fund FY 2010 FY 2011 FY 2012 FY 2013 FY 2012 ChangeGeneral FundLocal Funds 38.5 43.2 59.2 59.8 0.5 0.8Total for General Fund 38.5 43.2 59.2 59.8 0.5 0.8Total Proposed FTEs 38.5 43.2 59.2 59.8 0.5 0.8Board <strong>of</strong> ElectionsA-154FY 2013 Proposed <strong>Budget</strong> and <strong>Financial</strong> Plan
FY 2013 Proposed Operating <strong>Budget</strong>, by Comptroller Source GroupTable DL0-3 contains <strong>the</strong> proposed FY 2013 budget at <strong>the</strong> Comptroller Source Group (object class) level comparedto <strong>the</strong> FY 2012 approved budget. It also provides FY 2010 and FY 2011 actual expenditures.Table DL0-3(dollars in thousands)ChangeActual Actual Approved Proposed from PercentComptroller Source Group FY 2010 FY 2011 FY 2012 FY 2013 FY 2012 Change*11 - Regular Pay - Continuing Full Time 2,030 2,019 2,264 2,533 269 11.912 - Regular Pay - O<strong>the</strong>r 478 508 446 218 -228 -51.113 - Additional Gross Pay 148 57 0 0 0 N/A14 - Fringe Benefits - Current Personnel 493 519 588 649 61 10.515 - Overtime Pay 160 189 0 150 150 N/ASubtotal Personal Services (PS) 3,309 3,291 3,297 3,550 253 7.720 - Supplies and Materials 134 122 50 200 150 301.730 - Energy, Comm. and Building Rentals 136 0 0 0 0 N/A31 - Telephone, Telegraph, Telegram, Etc. 72 2 0 0 0 N/A32 - Rentals - Land and Structures 430 0 0 0 0 N/A33 - Janitorial Services 55 0 0 0 0 N/A34 - Security Services 27 0 0 0 0 N/A35 - Occupancy Fixed Costs 58 0 0 0 0 N/A40 - O<strong>the</strong>r Services and Charges 2,044 1,746 826 1,538 712 86.241 - Contractual Services - O<strong>the</strong>r 184 336 75 467 392 522.750 - Subsidies and Transfers 0 0 150 150 0 0.070 - Equipment and Equipment Rental 2,022 931 20 58 38 187.5Subtotal Nonpersonal Services (NPS) 5,165 3,137 1,121 2,412 1,291 115.2Gross Funds 8,474 6,428 4,418 5,962 1,544 35.0*Percent change is based on whole dollars.FY 2013 Proposed <strong>Budget</strong> and <strong>Financial</strong> PlanBoard <strong>of</strong> ElectionsA-155
Program DescriptionThe Board <strong>of</strong> Elections operates through <strong>the</strong> following 3 programs:Board <strong>of</strong> Supervisors – provides assistance to <strong>the</strong> BOE in carrying out <strong>the</strong>ir duties. This policy-making board managesall activities relating to <strong>the</strong> BOE, including meetings. The Board members meet a minimum <strong>of</strong> once a monthwith <strong>the</strong> <strong>Office</strong> <strong>of</strong> <strong>the</strong> General Counsel, <strong>the</strong> <strong>Office</strong> <strong>of</strong> <strong>the</strong> Executive Director, and <strong>the</strong> <strong>Office</strong> <strong>of</strong> Campaign Financeto discuss any situation or concern that <strong>the</strong> BOE may have.Election Operations – provides <strong>the</strong> administrative functions for <strong>the</strong> agency’s overall operations. This programdirects election-related program operations and support activities; conducts elections, voter registration and services;and provides voter roll maintenance, technology and information, and administration and support.This program contains <strong>the</strong> following 4 activities:■ Voter Registration – operates <strong>the</strong> voter registration system; conducts <strong>the</strong> absentee voter program, including inperson,by mail, overseas citizen services, and absentee registration and voting; maintains voter history data; disseminatesand provides access to voter registry data products; determines registration status for special ballotsand petition signatures; assists in automated ballot tabulation and recount operations; conducts <strong>the</strong> biennialvoter canvass; and executes <strong>the</strong> statutorily mandated requirements for <strong>the</strong> management and maintenance <strong>of</strong> <strong>the</strong>District’s voter registry, including data processing systems support for on-line voter registration;■ Voter Services – provides centralized voter assistance, public reception, and information services; provides candidateswith <strong>the</strong> information and documentation necessary for <strong>the</strong>m to qualify for <strong>of</strong>fice, including petitionsand declarations <strong>of</strong> candidacy; administers ballot access procedures for candidates and initiative, referendum,and recall measures; ensures petition sufficiency, voter qualification and eligibility, absentee registration and voting,and documentation for certification <strong>of</strong> election results; conducts ballot position lotteries and assists in automatedballot tabulation and recount operations; and conducts <strong>the</strong> in-person absentee voting program;■ Election Administration – ensures that all applicable federal and District <strong>of</strong> Columbia laws and regulations arefollowed with regard to pre- and post-election day activities; and■ Election Operations – provides central planning, administrative, and logistical support for all agency operations,including those directly associated with <strong>the</strong> conduct <strong>of</strong> elections and <strong>the</strong>ir subsequent clean-up. Thisactivity is responsible for resource planning and financial management, including budgeting, accounting, procurementactivity, and intra-District charges for services; contractual support for elections; and maintenance <strong>of</strong>agency facilities, specialized equipment, and o<strong>the</strong>r material. This activity also coordinates special elections andrecall activity; develops election ballot layouts and design; effects procurement, monitors production, andensures proper distribution <strong>of</strong> ballots for each voting precinct; performs comprehensive planning and supportto election operations; and ensures that elections are carried out in an open and accessible manner for voters <strong>of</strong><strong>the</strong> District <strong>of</strong> Columbia.<strong>Agency</strong> Management – provides for administrative support and <strong>the</strong> required tools to achieve operational and programmaticresults. This program is standard for all agencies using performance-based budgeting.Program Structure ChangeThe Board <strong>of</strong> Elections has no program structure changes in <strong>the</strong> FY 2013 proposed budget.Board <strong>of</strong> ElectionsA-156FY 2013 Proposed <strong>Budget</strong> and <strong>Financial</strong> Plan
FY 2013 Proposed Operating <strong>Budget</strong> and FTEs, by Program and ActivityTable DL0-4 contains <strong>the</strong> proposed FY 2013 budget by program and activity compared to <strong>the</strong> FY 2012 approved budget.It also provides <strong>the</strong> FY 2011 actual data.Table DL0-4(dollars in thousands)Dollars in ThousandsFull-Time EquivalentsChangeChangeActual Approved Proposed from Actual Approved Proposed fromProgram/Activity FY 2011 FY 2012 FY 2013 FY 2012 FY 2011 FY 2012 FY 2013 FY 2012(1000) <strong>Agency</strong> Management Program(1010) Personnel 214 136 533 397 0.0 3.5 11.8 8.3(1020) Contracting and Procurement 96 58 105 47 1.0 1.0 1.3 0.3(1030) Property Management 40 0 45 45 0.0 0.0 0.3 0.3(1040) Information Technology 407 591 705 114 4.9 10.2 7.1 -3.2(1060) Legal 482 422 434 12 4.8 3.2 3.2 0.0(1070) Fleet Management 0 27 27 -1 0.0 0.0 0.0 0.0(1080) Communication 121 190 125 -65 0.0 1.5 1.0 -0.5(1085) Customer Service 223 175 238 63 0.0 2.0 3.0 1.0(1090) Performance Management 138 265 201 -64 2.8 2.0 1.4 -0.6No Activity Assigned 1,892 0 0 0 0.0 0.0 0.0 0.0Subtotal (1000) <strong>Agency</strong> Management Program 3,613 1,865 2,412 547 13.6 23.5 29.2 5.6(3000) Board <strong>of</strong> Supervisors(3001) BOS Operations 27 5 61 56 0.2 0.0 0.1 0.1Subtotal (3000) Board <strong>of</strong> Supervisors 27 5 61 56 0.2 0.0 0.1 0.1(4000) Election Operations(4001) Voter Registration 273 463 288 -174 18.6 12.5 14.2 1.8(4002) Voter Services 442 442 412 -29 0.0 9.5 7.2 -2.3(4003) Election Administration 48 27 27 0 0.0 3.0 0.2 -2.8(4004) Election Operations 2,025 1,617 2,761 1,144 10.8 10.8 8.8 -1.9Subtotal (4000) Election Operations 2,788 2,548 3,489 941 29.4 35.8 30.5 -5.2Total Proposed Operating <strong>Budget</strong> 6,428 4,418 5,962 1,544 43.2 59.2 59.8 0.5(Change is calculated by whole numbers and numbers may not add up due to rounding)Note: For more detailed information regarding <strong>the</strong> proposed funding for <strong>the</strong> activities within this agency’s programs, please see Schedule 30-PBBProgram Summary by Activity in <strong>the</strong> FY 2013 Operating Appendices located on <strong>the</strong> <strong>Office</strong> <strong>of</strong> <strong>the</strong> <strong>Chief</strong> <strong>Financial</strong> <strong>Office</strong>r’s website.FY 2013 Proposed <strong>Budget</strong> and <strong>Financial</strong> PlanBoard <strong>of</strong> ElectionsA-157
FY 2013 Proposed <strong>Budget</strong> ChangesThe Board <strong>of</strong> Elections’ (BOE) proposed FY 2013 gross budget is $5,961,956, which represents a 35.0 increaseover its FY 2012 approved gross budget <strong>of</strong> $4,417,635. The budget is comprised <strong>of</strong> $5,811,956 in Local funds and$150,000 in Federal Grant funds.Current Services Funding LevelThe Current Services Funding Level (CSFL) is a Local funds ONLY representation <strong>of</strong> <strong>the</strong> true cost <strong>of</strong> operatingDistrict agencies, before consideration <strong>of</strong> policy decisions. The CSFL reflects changes from <strong>the</strong> FY 2012 approvedbudget across multiple programs, and it estimates how much it would cost an agency to continue its current programsand operations into <strong>the</strong> following fiscal year. The initial adjustments in <strong>the</strong> budget proposal representchanges that should be compared to <strong>the</strong> FY 2013 CSFL budget and not necessarily changes made to <strong>the</strong> FY 2012Local funds budget. The FY 2013 CSFL adjustments to <strong>the</strong> FY 2012 Local funds budget are described in table 5<strong>of</strong> this agency's budget chapter. Please see <strong>the</strong> CSFL Development section within Volume 1: Executive Summaryfor more information regarding <strong>the</strong> methodology used and components that comprise <strong>the</strong> CSFL.BOE’s FY 2013 CSFL budget is $4,137,714, which represents a $129,921, or 3.0 percent, decrease from itsFY 2012 approved Local funds budget <strong>of</strong> $4,267,635.Initial Adjusted <strong>Budget</strong>Cost Increase: Local funds – BOE increased salaries within Regular Pay – Continuing Full Time by $257,815 and0.5 FTEs, and it also added $6,337 for Fringe Benefits.Cost Decrease: Local funds – BOE decreased Regular Pay – O<strong>the</strong>r by $229,915. In addition, <strong>the</strong>re were decreases<strong>of</strong> $31,344 in O<strong>the</strong>r Services and Charges, $1,500 in Contractual Services - O<strong>the</strong>r, $994 in Supplies andMaterials, and $400 in Equipment and Equipment Rental.Additionally Adjusted <strong>Budget</strong>Technical Adjustments: Adjustment <strong>of</strong> Fringe Benefits to restore <strong>the</strong> District Government contribution foremployee health insurance from 72 percent, implemented in <strong>the</strong> FY 2011 budget, to 75 percent in FY 2013, resultingin an increase <strong>of</strong> $13,992 to Local funds.Policy InitiativesEnhance: Local funds – In preparation for <strong>the</strong> 2012 General Election, BOE received one-time increases <strong>of</strong>$491,550 for poll workers; $392,000 for Contractual Services; $290,000 for election printing; $150,000 for overtime;$150,000 for Supplies and Materials; $121,500 for Postage; $52,200 for Advertisement/Media; and $37,500for Equipment Rental.Cost Decrease: Local funds – reduced stipends for BOE Board members by $24,500.Board <strong>of</strong> ElectionsA-158FY 2013 Proposed <strong>Budget</strong> and <strong>Financial</strong> Plan
FY 2012 Approved <strong>Budget</strong> to FY 2013 Proposed <strong>Budget</strong>, by Revenue TypeTable DL0-5 itemizes <strong>the</strong> changes by revenue type between <strong>the</strong> FY 2012 approved budget and <strong>the</strong> FY 2013 proposedbudget.Table DL0-5(dollars in thousands)PROGRAM BUDGET FTELOCAL FUNDS: FY 2012 Approved <strong>Budget</strong> and FTE 4,268 59.2Removal <strong>of</strong> One-Time Funding Multiple Programs -200 0.0Fringe Benefit Rate Adjustment Multiple Programs 41 0.0Consumer Price Index Multiple Programs 15 0.0Personal Services Growth Factor Multiple Programs 14 0.0FY 2013 Current Services Funding Level <strong>Budget</strong> (CSFL) 4,138 59.2Cost Increase: Increased Regular Pay - Continuing Full Time Multiple Programs 258 0.5Cost Increase: Align Fringe Benefits with projected costs Multiple Programs 6 0.0Cost Decrease: Reduced Regular Pay - O<strong>the</strong>r Multiple Programs -230 0.0Cost Decrease: Reduce O<strong>the</strong>r Services and Charges Multiple Programs -31 0.0Cost Decrease: Reduce Contractual Services - O<strong>the</strong>r, Multiple Programs -3 0.0Supplies and Materials, and Equipment and Equipment RentalFY 2013 Initial Adjusted <strong>Budget</strong> 4,138 59.8Technical Adjustment: Health insurance contribution Multiple Programs 14 0.0FY 2013 Additionally Adjusted <strong>Budget</strong> 4,152 59.8FY 2013 Policy InitiativesEnhance: Increase O<strong>the</strong>r Services and Charges for cost Election Operations 492 0.0<strong>of</strong> poll workers - One-Time costsEnhance: Contractual Services for General Election - One-Time costs Election Operations 392 0.0Enhance: Increase Printing for General Election - One-Time costs Election Operations 290 0.0Enhance: Increase Supplies and Materials for General Election - Election Operations 150 0.0One-Time costsEnhance: Overtime for General Election - One-Time costs Election Operations 150 0.0Enhance: Increase Postage for General Election - One-Time costs Election Operations 122 0.0Enhance: Increase Advertising - One-Time costs Election Operations 52 0.0Enhance: Increase Equipment and Equipment Rental - One-Time costs Election Operations 38 0.0Cost Decrease: Reduce stipends for Board members Board <strong>of</strong> Supervisors -24 0.0LOCAL FUNDS: FY 2013 Proposed <strong>Budget</strong> and FTE 5,812 59.8FEDERAL GRANT FUNDS: FY 2012 Approved <strong>Budget</strong> and FTE 150 0.0No Change 0 0.0FY 2013 Initial Adjusted <strong>Budget</strong> 150 0.0FEDERAL GRANT FUNDS: FY 2013 Proposed <strong>Budget</strong> and FTE 150 0.0Gross for DL0 - Board <strong>of</strong> Elections 5,962 59.8(Change is calculated by whole numbers and numbers may not add up due to rounding)FY 2013 Proposed <strong>Budget</strong> and <strong>Financial</strong> PlanBoard <strong>of</strong> ElectionsA-159
<strong>Office</strong> <strong>of</strong> Campaign Finance(CJ0)www.ocf.dc.govTelephone: 202-671-0547% ChangeFY 2011 FY 2012 FY 2013 fromDescription Actual Approved Proposed FY 2012Operating <strong>Budget</strong> $1,373,762 $1,407,024 $2,601,045 84.9FTEs 17.8 16.0 31.0 93.8The mission <strong>of</strong> <strong>the</strong> <strong>Office</strong> <strong>of</strong> Campaign Finance (OCF) is to regulate<strong>the</strong> conduct <strong>of</strong> public <strong>of</strong>ficials and political campaigns to ensure publictrust in <strong>the</strong> integrity <strong>of</strong> <strong>the</strong> election process and government service.Summary <strong>of</strong> ServicesThe <strong>Office</strong> <strong>of</strong> Campaign Finance processes and maintains financial reports, for public inspection, which arerequired by law to be filed with OCF; audits and develops statistical reports and summaries <strong>of</strong> <strong>the</strong> financial reports;conducts investigations and informal hearings <strong>of</strong> alleged violations <strong>of</strong> <strong>the</strong> Campaign Finance Act (<strong>the</strong> Act); and rendersinterpretative opinions concerning <strong>the</strong> application <strong>of</strong> <strong>the</strong> Act.The agency’s FY 2013 proposed budget is presented in <strong>the</strong> following tables:FY 2013 Proposed <strong>Budget</strong> and <strong>Financial</strong> Plan<strong>Office</strong> <strong>of</strong> Campaign FinanceA-161
FY 2013 Proposed Gross Funds Operating <strong>Budget</strong>, by Revenue TypeTable CJ0-1 contains <strong>the</strong> proposed FY 2013 agency budget compared to <strong>the</strong> FY 2012 approved budget. It alsoprovides FY 2010 and FY 2011 actual expenditures.Table CJ0-1(dollars in thousands)ChangeActual Actual Approved Proposed from PercentAppropriated Fund FY 2010 FY 2011 FY 2012 FY 2013 FY 2012 Change*General FundLocal Funds 1,636 1,325 1,313 2,601 1,288 98.1Special Purpose Revenue Funds 0 49 94 0 -94 -100.0Total for General Fund 1,636 1,374 1,407 2,601 1,194 84.9Gross Funds 1,636 1,374 1,407 2,601 1,194 84.9*Percent change is based on whole dollars.Note: If applicable, for a breakdown <strong>of</strong> each Grant (Federal and Private), Special Purpose Revenue type and Intra-District agreement,please refer to Schedule 80 <strong>Agency</strong> Summary by Revenue Source in <strong>the</strong> FY 2013 Operating Appendices located on <strong>the</strong> <strong>Office</strong> <strong>of</strong> <strong>the</strong><strong>Chief</strong> <strong>Financial</strong> <strong>Office</strong>r’s website.FY 2013 Proposed Full-Time Equivalents, by Revenue TypeTable CJ0-2 contains <strong>the</strong> proposed FY 2013 FTE level compared to <strong>the</strong> FY 2012 approved FTE level by revenuetype. It also provides FY 2010 and FY 2011 actual data.Table CJ0-2ChangeActual Actual Approved Proposed from PercentAppropriated Fund FY 2010 FY 2011 FY 2012 FY 2013 FY 2012 ChangeGeneral FundLocal Funds 17.1 17.8 15.0 31.0 16.0 106.7Special Purpose Revenue Funds 0.0 0.0 1.0 0.0 -1.0 -100.0Total for General Fund 17.1 17.8 16.0 31.0 15.0 93.8Total Proposed FTEs 17.1 17.8 16.0 31.0 15.0 93.8<strong>Office</strong> <strong>of</strong> Campaign FinanceA-162FY 2013 Proposed <strong>Budget</strong> and <strong>Financial</strong> Plan
FY 2013 Proposed Operating <strong>Budget</strong>, by Comptroller Source GroupTable CJ0-3 contains <strong>the</strong> proposed FY 2013 budget at <strong>the</strong> Comptroller Source Group (object class) level comparedto <strong>the</strong> FY 2012 approved budget. It also provides FY 2010 and FY 2011 actual expenditures.Table CJ0-3(dollars in thousands)ChangeActual Actual Approved Proposed from PercentComptroller Source Group FY 2010 FY 2011 FY 2012 FY 2013 FY 2012 Change*11 - Regular Pay - Continuing Full Time 1,116 1,034 1,072 1,877 805 75.112 - Regular Pay - O<strong>the</strong>r 26 52 73 0 -73 -100.013 - Additional Gross Pay 12 16 0 0 0 N/A14 - Fringe Benefits - Current Personnel 218 220 251 561 310 123.715 - Overtime Pay 0 0 0 0 0 N/ASubtotal Personal Services (PS) 1,373 1,322 1,396 2,439 1,043 74.720 - Supplies and Materials 9 11 6 12 6 95.730 - Energy, Comm. and Building Rentals 42 0 0 0 0 N/A31 - Telephone, Telegraph, Telegram, Etc. 7 0 0 0 0 N/A33 - Janitorial Services 42 0 0 0 0 N/A34 - Security Services 17 0 0 0 0 N/A35 - Occupancy Fixed Costs 68 0 0 0 0 N/A40 - O<strong>the</strong>r Services and Charges 36 41 5 151 146 2,961.041 - Contractual Services - O<strong>the</strong>r 43 0 0 0 0 N/ASubtotal Nonpersonal Services (NPS) 264 52 11 163 151 1,370.8Gross Funds 1,636 1,374 1,407 2,601 1,194 84.9*Percent change is based on whole dollars.FY 2013 Proposed <strong>Budget</strong> and <strong>Financial</strong> Plan<strong>Office</strong> <strong>of</strong> Campaign FinanceA-163
Program DescriptionThe <strong>Office</strong> <strong>of</strong> Campaign Finance operates through <strong>the</strong> following 2 programs:Oversight Support Services – provides desk analysis reviews, investigations, hearings, field audits, statistical reports,recommendations, and summaries <strong>of</strong> all financial reports submitted by candidates, political committees, constituentservice programs, public <strong>of</strong>ficials, lobbyists, and statehood funds that focus efforts on ensuring accuratereporting and full disclosure, pursuant to <strong>the</strong> Campaign Finance Laws, so that <strong>the</strong> public is well informed and confidentin <strong>the</strong> integrity <strong>of</strong> <strong>the</strong> electoral process and government services. The program also provides public informationand educational seminars.This program contains <strong>the</strong> following 3 activities:■ Public Information and Records Management – provides public information and educational seminars,receives electronically submitted financial reports, enters financial reports received by hard copy, and compilesinformation for publication in <strong>the</strong> D.C. Register so that <strong>the</strong> public is well informed and confident in <strong>the</strong> integrity<strong>of</strong> <strong>the</strong> electoral process and government service;■ Reports Analysis and Audit Division – provides desk analysis reviews, field audits, statistical reports, and summaries<strong>of</strong> all financial reports submitted by candidates, political committees, constituent service programs, public<strong>of</strong>ficials, lobbyists, and statehood funds that focus efforts on ensuring accurate reporting and full disclosure,pursuant to <strong>the</strong> Campaign Finance Laws; and■ <strong>Office</strong> <strong>of</strong> <strong>the</strong> General Counsel – provides enforcement by conducting investigations and hearings and issuingrecommendations for decisions on charges <strong>of</strong> violations <strong>of</strong> <strong>the</strong> Campaign Finance Act. The <strong>Office</strong> drafts regulationsand interpretive opinions that focus efforts on promoting voluntary compliance with <strong>the</strong> CampaignFinance Act.<strong>Agency</strong> Management - provides for administrative support and <strong>the</strong> required tools to achieve operational and programmaticresults. This program is standard for all agencies using performance-based budgeting.Program Structure ChangesThe <strong>Office</strong> <strong>of</strong> Campaign Finance has no program structure changes in <strong>the</strong> FY 2013 proposed budget.<strong>Office</strong> <strong>of</strong> Campaign FinanceA-164FY 2013 Proposed <strong>Budget</strong> and <strong>Financial</strong> Plan
FY 2013 Proposed Operating <strong>Budget</strong> and FTEs, by Program and ActivityTable CJ0-4 contains <strong>the</strong> proposed FY 2013 budget by program and activity compared to <strong>the</strong> FY 2012 approved budget.It also provides <strong>the</strong> FY 2011 actual data.Table CJ0-4(dollars in thousands)Dollars in ThousandsFull-Time EquivalentsChangeChangeActual Approved Proposed from Actual Approved Proposed fromProgram/Activity FY 2011 FY 2012 FY 2013 FY 2012 FY 2011 FY 2012 FY 2013 FY 2012(1000) <strong>Agency</strong> Management Program(1010) Personnel 166 165 167 2 5.0 3.0 3.0 0.0(1015) Training and Development -1 0 0 0 0.0 0.0 0.0 0.0(1040) Information Technology 69 60 62 1 1.0 1.0 1.0 0.0(1090) Performance Management 190 188 189 2 1.0 1.0 1.0 0.0Subtotal (1000) <strong>Agency</strong> Management Program 423 413 418 5 6.9 5.0 5.0 0.0(2000) Oversight Support Services(2010) Public Information and Record Management 303 273 429 156 4.0 4.0 4.0 0.0(2020) Report Analysis and Audit Division 322 315 1,068 753 4.0 4.0 14.0 10.0(2030) <strong>Office</strong> <strong>of</strong> <strong>the</strong> General Counsel 325 406 686 280 3.0 3.0 8.0 5.0Subtotal (2000) Oversight Support Services 950 994 2,183 1,189 10.9 11.0 26.0 15.0Total Proposed Operating <strong>Budget</strong> 1,374 1,407 2,601 1,194 17.8 16.0 31.0 15.0(Change is calculated by whole numbers and numbers may not add up due to rounding)Note: For more detailed information regarding <strong>the</strong> proposed funding for <strong>the</strong> activities within this agency’s programs, please see Schedule 30-PBBProgram Summary by Activity in <strong>the</strong> FY 2013 Operating Appendices located on <strong>the</strong> <strong>Office</strong> <strong>of</strong> <strong>the</strong> <strong>Chief</strong> <strong>Financial</strong> <strong>Office</strong>r’s website.FY 2013 Proposed <strong>Budget</strong> ChangesThe <strong>Office</strong> <strong>of</strong> Campaign Finance’s (OCF) proposed FY 2013 gross budget is $2,601,045, which represents an 84.9percent increase over its FY 2012 approved gross budget <strong>of</strong> $1,407,024. The budget is comprised entirely <strong>of</strong> Localfunds.Current Services Funding LevelThe Current Services Funding Level (CSFL) is a Local funds ONLY representation <strong>of</strong> <strong>the</strong> true cost <strong>of</strong> operatingDistrict agencies, before consideration <strong>of</strong> policy decisions. The CSFL reflects changes from <strong>the</strong> FY 2012 approvedbudget across multiple programs, and it estimates how much it would cost an agency to continue its current programsand operations into <strong>the</strong> following fiscal year. The initial adjustments in <strong>the</strong> budget proposal represent changesthat should be compared to <strong>the</strong> FY 2013 CSFL budget and not necessarily changes made to <strong>the</strong> FY 2012 Localfunds budget. The FY 2013 CSFL adjustments to <strong>the</strong> FY 2012 Local funds budget are described in table 5 <strong>of</strong> thisagency's budget chapter. Please see <strong>the</strong> CSFL Development section within Volume 1: Executive Summary for moreinformation regarding <strong>the</strong> methodology used and components that comprise <strong>the</strong> CSFL.OCF's FY 2013 CSFL budget is $1,334,694, which represents a $21,670, or 1.7 percent, increase over <strong>the</strong> FY2012 approved Local funds budget <strong>of</strong> $1,313,024.FY 2013 Proposed <strong>Budget</strong> and <strong>Financial</strong> Plan<strong>Office</strong> <strong>of</strong> Campaign FinanceA-165
Initial Adjusted <strong>Budget</strong>Cost Increase: $47,248 in Local funds to support increased demands related to O<strong>the</strong>r Services and Charges.Cost Decrease: $47,248 in Local funds reflects an adjustment to Regular Pay - O<strong>the</strong>r and Fringe Benefits; $33,922from personal services in Special Purpose Revenue funds is due to a decline in projected revenue.Additionally Adjusted <strong>Budget</strong>Technical Adjustment: Adjustment <strong>of</strong> Fringe Benefits to restore <strong>the</strong> District Government contribution for employeehealth insurance from 72 percent, implemented in <strong>the</strong> FY 2011 budget, to 75 percent in FY 2013, resulting inan increase <strong>of</strong> $5,224 in Local funds and $234 in Special Purpose Revenue funds.Policy InitiativeCost Increase: $708,000 and 9.0 FTEs in Local funds to support increased random audits conducted on politicalcommittees, $215,000 in <strong>the</strong> Oversight Support Services program to support 4.0 additional FTEs, $134,126 and2.0 FTEs in Local funds for <strong>the</strong> costs <strong>of</strong> an Attorney Advisor and a Hearing Examiner’s position previously fundedby Special Purpose Revenue, and $104,000 in O<strong>the</strong>r Services and Charges for equipment and necessary s<strong>of</strong>twareupgrades in <strong>the</strong> Oversight Support Services program.Transfer In: $100,000 and 1.0 FTE in Local funds from <strong>the</strong> District Department <strong>of</strong> Transportation.Transfer out: $60,077 and 1.0 FTE from Special Purpose Revenue funds to <strong>the</strong> newly created Ethics Board, in <strong>the</strong>Board <strong>of</strong> Ethics and Government Accountability.<strong>Office</strong> <strong>of</strong> Campaign FinanceA-166FY 2013 Proposed <strong>Budget</strong> and <strong>Financial</strong> Plan
FY 2012 Approved <strong>Budget</strong> to FY 2013 Proposed <strong>Budget</strong>, by Revenue TypeTable CJ0-5 itemizes <strong>the</strong> changes by revenue type between <strong>the</strong> FY 2012 approved budget and <strong>the</strong> FY 2013 proposedbudget.Table CJ0-5(dollars in thousands)PROGRAM BUDGET FTELOCAL FUNDS: FY 2012 Approved <strong>Budget</strong> and FTE 1,313 15.0Fringe Benefit Rate Adjustment Multiple Programs 16 0.0Consumer Price Index Multiple Programs 0 0.0Personal Services Growth Factor Multiple Programs 5 0.0FY 2013 Current Services Funding Level <strong>Budget</strong> (CSFL) 1,335 15.0Cost Increase: In O<strong>the</strong>r Services and Charges due to Multiple Programs 47 0.0increased needsCost Decrease: In personal services to absorb <strong>the</strong> Multiple Programs -47 0.0increase in O<strong>the</strong>r Services and ChargesFY 2013 Initial Adjusted <strong>Budget</strong> 1,335 15.0Technical Adjustment: Health insurance contribution Multiple Programs 5 0.0FY 2013 Additionally Adjusted <strong>Budget</strong> 1,340 15.0FY 2013 Policy InitiativesCost Increase: To support <strong>the</strong> increased random audits Oversight Support Services 708 9.0conducted <strong>of</strong> political committeesCost Increase: To support an additional 4 FTEs Oversight Support Services 215 4.0Cost Increase: To cover <strong>the</strong> costs <strong>of</strong> an Attorney Advisor's Oversight Support Services 134 2.0and a Hearing Examiner’s positions previouslyfunded by Special Purpose Revenue fundsCost Increase: In O<strong>the</strong>r Services and Charges for Oversight Support Services 104 0.0Equipment and necessary s<strong>of</strong>tware upgradesTransfer In: From <strong>the</strong> District Department <strong>of</strong> Transportation Oversight Support Services 100 1.0LOCAL FUNDS: FY 2013 Proposed <strong>Budget</strong> and FTE 2,601 31.0SPECIAL PURPOSE REVENUE FUNDS: FY 2012 Approved <strong>Budget</strong> and FTE 94 1.0Cost Decrease: In personal services due to decline Multiple Programs -34 0.0in expected revenue projectionFY 2013 Initial Adjusted <strong>Budget</strong> 60 1.0Technical Adjustment: Health insurance contribution (less than $500) Multiple Programs 0 0.0FY 2013 Additionally Adjusted <strong>Budget</strong> 60 1.0FY 2013 Policy InitiativesTransfer Out: To <strong>the</strong> Ethics Board Oversight Support Services -60 -1.0SPECIAL PURPOSE REVENUE FUNDS: FY 2013 Proposed <strong>Budget</strong> and FTE 0 0.0Gross for CJ0 - <strong>Office</strong> <strong>of</strong> Campaign Finance 2,601 31.0(Change is calculated by whole numbers and numbers may not add up due to rounding)FY 2013 Proposed <strong>Budget</strong> and <strong>Financial</strong> Plan<strong>Office</strong> <strong>of</strong> Campaign FinanceA-167
<strong>Agency</strong> Performance PlanThe agency’s performance plan has <strong>the</strong> following objectives for FY 2013:Objective 1: Obtain full and complete disclosure <strong>of</strong> documents and actions relevant to <strong>the</strong> Campaign Finance codethrough efficient and effective educational, audit, and enforcement processes.Objective 2: Assimilate, maintain, and compile financial disclosure records received through electronic filing andby hard copy into an integrated, relational database.Objective 3: Disseminate financial disclosure records and statistical reports.<strong>Agency</strong> Performance MeasuresFY 2010 FY 2011 FY 2011 FY 2012 FY 2013 FY 2014Measure Actual Target Actual Projection Projection ProjectionPercentage <strong>of</strong> listings in <strong>the</strong> D.C. Register publishedbefore <strong>the</strong> statutory deadlines <strong>of</strong> January 15th,April 30th, June 15th, and August 15th <strong>of</strong> each year 100% 100% 100% 100% 100% 100%Percentage <strong>of</strong> informal hearings conducted and closedbefore <strong>the</strong> next filing deadline 100% 100% 86.79% 100% 100% 100%Percentage <strong>of</strong> investigative matters closed within90 days <strong>of</strong> opening 100% 100% 62.5% 100% 100% 100%Percentage <strong>of</strong> financial reports reviewed, evaluated,and analyzed before <strong>the</strong> next filing deadline 100% 100% 100% 100% 100% 100%Percentage <strong>of</strong> financial reports filed electronically 1 59.64% 70% 70.99% 75% 80% 95%Number <strong>of</strong> periodic random audits conducted <strong>of</strong>political committees following <strong>the</strong> January 31st andJuly 31st filing deadlines 2 7 6 3 6/8 6 6 6Percentage <strong>of</strong> Interpretive Opinions issued within 30 days 94% 100% 100% 100% 100% 100%Percentage <strong>of</strong> Compliance Rate 4 94.39% 100% 100% 100% 100% 100%Percentage <strong>of</strong> <strong>Financial</strong> Disclosure and Conflict <strong>of</strong>Interest Reports filed electronically 90% 60% 78.59% 70% 100% 100%Percentage <strong>of</strong> <strong>Financial</strong> Disclosure Statements filedon time 95% 96% 96% 96% 96% 96%Percentage <strong>of</strong> periodic random audits <strong>of</strong> politicalcommittees following January 31st and July 31stfiling deadlines completed before <strong>the</strong> next filing 100% 100% 100% 100% 100% 100%deadline*Per FY 2012 Performance Policy and Measure Recommendations <strong>of</strong> <strong>the</strong> GOE FY 2012 <strong>Budget</strong> Report, at Page 55, <strong>the</strong> “<strong>Office</strong> <strong>of</strong> Campaign Finance should increase <strong>the</strong> number <strong>of</strong>financial reports that are filed electronically, particularly in <strong>the</strong> lobbyist and <strong>Financial</strong> Disclosure statements, with a goal <strong>of</strong> 100 percent electronic filing by Fiscal Year 2013”; and for FY 2012,measure <strong>the</strong> “number <strong>of</strong> periodic random audits <strong>of</strong> lobbyist communications reports”. It should be noted, however, that based upon <strong>the</strong> enactment <strong>of</strong> <strong>the</strong> “Board <strong>of</strong> Ethics andGovernment Accountability Establishment and Comprehensive Ethics Reform Emergency Amendment Act <strong>of</strong> 2012”, effective January 29, 2012, <strong>the</strong> <strong>Office</strong> <strong>of</strong> Campaign Finance will nolonger be responsible for <strong>the</strong> public reporting <strong>of</strong> public <strong>of</strong>ficials, and as <strong>of</strong> October 1, 2012, will no longer administer <strong>the</strong> provisions <strong>of</strong> <strong>the</strong> “Emergency Ethics Act” pertaining to lobbyists.<strong>Office</strong> <strong>of</strong> Campaign FinanceA-168FY 2013 Proposed <strong>Budget</strong> and <strong>Financial</strong> Plan
Performance Plan Endnotes:1. As <strong>of</strong> 2008, based on <strong>the</strong> “Grading State Disclosure 2008” report, dated September 17, 2008 by <strong>the</strong> Campaign Disclosure Project,a partnership <strong>of</strong> <strong>the</strong> Center for Governmental Studies, <strong>the</strong> California Voter Foundation, and UCLA Law School, 30 states havemandatory electronic filing programs for certain campaign reports, 12 states had some form <strong>of</strong> voluntary program, and 8 stateshad no electronic filing. The District <strong>of</strong> Columbia was not included in this study. Participation rates among <strong>the</strong> voluntary statesaveraged at that time at 54 percent for statewide candidates and 43 percent for legislative candidates. The report can be found atwww.campaigndisclosure.org. OCF will attempt to determine what <strong>the</strong> current trends are in electronic filing from <strong>the</strong> Council onGovernmental Ethics Laws.2. The total number <strong>of</strong> periodic audits conducted for all filer groups was as follows: FY 2009, 8; and FY 2010, 14. OCF expects <strong>the</strong>total number <strong>of</strong> periodic audits conducted for all filer groups to be as follows: FY 2011, 8; FY 2012, 12; and FY 2013, 8.3. OCF expects to perform three audits <strong>of</strong> political committees following <strong>the</strong> January 31st filing deadline and three audits <strong>of</strong> politicalcommittees after <strong>the</strong> July 31st deadline.4. The total number <strong>of</strong> disclosure statements received compared to <strong>the</strong> number expected.FY 2013 Proposed <strong>Budget</strong> and <strong>Financial</strong> Plan<strong>Office</strong> <strong>of</strong> Campaign FinanceA-169
(CG0)Public Employee Relations Boardwww.perb.dc.govTelephone: 202-727-1822% ChangeFY 2011 FY 2012 FY 2013 fromDescription Actual Approved Proposed FY 2012Operating <strong>Budget</strong> $733,019 $950,866 $1,151,005 21.0FTEs 5.9 7.0 9.0 28.6The District <strong>of</strong> Columbia Public Employee Relations Board (PERB) isan impartial, quasi-judicial, independent agency empowered with <strong>the</strong>exclusive jurisdiction to resolve labor-management disputes betweenagencies <strong>of</strong> <strong>the</strong> District government and labor organizations representingemployees <strong>of</strong> various District agencies.Summary <strong>of</strong> ServicesThe Board determines appropriate compensation and non-compensation bargaining units. It certifies and decertifieslabor organizations as exclusive bargaining representatives and adjudicates unfair labor practice complaints. TheBoard also considers appeals <strong>of</strong> grievance arbitration awards, investigates standards-<strong>of</strong>-conduct complaints, anddetermines whe<strong>the</strong>r a particular subject or proposal is within <strong>the</strong> scope <strong>of</strong> bargaining. Lastly, <strong>the</strong> Board facilitates<strong>the</strong> resolution <strong>of</strong> impasses in contract negotiations and adopts rules and regulations for conducting <strong>the</strong> business <strong>of</strong>PERB. Consistent with <strong>the</strong> above-noted responsibilities, PERB is also authorized to issue subpoenas, conduct hearings,and retain independent counsel to represent its interests.The agency’s FY 2013 proposed budget is presented in <strong>the</strong> following tables:FY 2013 Proposed <strong>Budget</strong> and <strong>Financial</strong> PlanPublic Employee Relations BoardA-171
FY 2013 Proposed Gross Funds Operating <strong>Budget</strong>, by Revenue TypeTable CG0-1 contains <strong>the</strong> proposed FY 2013 agency budget compared to <strong>the</strong> FY 2012 approved budget. It alsoprovides FY 2010 and FY 2011 actual expenditures.Table CG0-1(dollars in thousands)ChangeActual Actual Approved Proposed from PercentAppropriated Fund FY 2010 FY 2011 FY 2012 FY 2013 FY 2012 Change*General FundLocal Funds 1,055 733 951 1,151 200 21.0Total for General Fund 1,055 733 951 1,151 200 21.0Gross Funds 1,055 733 951 1,151 200 21.0*Percent change is based on whole dollars.Note: If applicable, for a breakdown <strong>of</strong> each Grant (Federal and Private), Special Purpose Revenue type and Intra-District agreement,please refer to Schedule 80 <strong>Agency</strong> Summary by Revenue Source in <strong>the</strong> FY 2013 Operating Appendices located on <strong>the</strong> <strong>Office</strong> <strong>of</strong> <strong>the</strong><strong>Chief</strong> <strong>Financial</strong> <strong>Office</strong>r’s website.FY 2013 Proposed Full-Time Equivalents, by Revenue TypeTable CG0-2 contains <strong>the</strong> proposed FY 2013 FTE level compared to <strong>the</strong> FY 2012 approved FTE level by revenuetype. It also provides FY 2010 and FY 2011 actual data.Table CG0-2ChangeActual Actual Approved Proposed from PercentAppropriated Fund FY 2010 FY 2011 FY 2012 FY 2013 FY 2012 ChangeGeneral FundLocal Funds 5.7 5.9 7.0 9.0 2.0 28.6Total for General Fund 5.7 5.9 7.0 9.0 2.0 28.6Total Proposed FTEs 5.7 5.9 7.0 9.0 2.0 28.6Public Employee Relations BoardA-172FY 2013 Proposed <strong>Budget</strong> and <strong>Financial</strong> Plan
FY 2013 Proposed Operating <strong>Budget</strong>, by Comptroller Source GroupTable CG0-3 contains <strong>the</strong> proposed FY 2013 budget at <strong>the</strong> Comptroller Source Group (object class) level comparedto <strong>the</strong> FY 2012 approved budget. It also provides FY 2010 and FY 2011 actual expenditures.Table CG0-3(dollars in thousands)ChangeActual Actual Approved Proposed from PercentComptroller Source Group FY 2010 FY 2011 FY 2012 FY 2013 FY 2012 Change*11 - Regular Pay - Continuing Full Time 433 363 520 822 302 58.012 - Regular Pay - O<strong>the</strong>r 0 28 0 0 0 N/A13 - Additional Gross Pay 31 -30 0 0 0 N/A14 - Fringe Benefits - Current Personnel 92 70 111 192 80 72.0Subtotal Personal Services (PS) 556 431 631 1,014 382 60.520 - Supplies and Materials 3 3 3 3 0 2.031 - Telephone, Telegraph, Telegram, Etc. 3 4 2 12 10 452.532 - Rentals - Land and Structures 100 0 0 0 0 N/A40 - O<strong>the</strong>r Services and Charges 30 50 5 15 10 184.841 - Contractual Services - O<strong>the</strong>r 358 238 304 102 -202 -66.370 - Equipment and Equipment Rental 5 8 5 5 0 2.0Subtotal Nonpersonal Services (NPS) 498 302 319 137 -182 -57.0Gross Funds 1,055 733 951 1,151 200 21.0*Percent change is based on whole dollars.Program DescriptionThe Public Employee Relations Board operates through <strong>the</strong> following 2 programs:Adjudication – provides assistance in resolving labor-management disputes between <strong>the</strong> District government andlabor organizations representing employees <strong>of</strong> various District agencies.This program contains <strong>the</strong> following 3 activities:■ Legal Support – provides assistance in resolving labor-management disputes between <strong>the</strong> District governmentand labor organizations representing employees <strong>of</strong> various District agencies;■ Public Employee Relations Board – through Board meetings, provides final resolution <strong>of</strong> labor-managementdisputes between <strong>the</strong> District government and labor organizations representing employees <strong>of</strong> various Districtagencies; and■ Court Appeals and Enforcement – defends appeals filed by an aggrieved party. Also, if <strong>the</strong> Board’s order isreversed by <strong>the</strong> District <strong>of</strong> Columbia Superior Court, <strong>the</strong> Board may file an appeal with <strong>the</strong> District <strong>of</strong>Columbia Court <strong>of</strong> Appeals. Seeks enforcement <strong>of</strong> <strong>the</strong> Board’s orders.FY 2013 Proposed <strong>Budget</strong> and <strong>Financial</strong> PlanPublic Employee Relations BoardA-173
<strong>Agency</strong> Management – provides for administrative support and <strong>the</strong> required tools to achieve operational and programmaticresults. This program is standard for all agencies using performance-based budgeting.Program Structure ChangeThe Public Employee Relations Board has no program structure changes in <strong>the</strong> FY 2013 proposed budget.FY 2013 Proposed Operating <strong>Budget</strong> and FTEs, by Program and ActivityTable CG0-4 contains <strong>the</strong> proposed FY 2013 budget by program and activity compared to <strong>the</strong> FY 2012 approved budget.It also provides FY 2011 actual data.Table CG0-4(dollars in thousands)Dollars in ThousandsFull-Time EquivalentsChangeChangeActual Approved Proposed from Actual Approved Proposed fromProgram/Activity FY 2011 FY 2012 FY 2013 FY 2012 FY 2011 FY 2012 FY 2013 FY 2012(1000) <strong>Agency</strong> Management Program(1010) Personnel 0 0 0 0 1.0 0.0 0.0 0.0(1020) Contracting and Procurement 0 2 0 -2 0.0 0.0 0.0 0.0(1040) Information Technology 4 2 2 0 0.0 0.0 0.0 0.0(1090) Performance Management 29 0 165 165 1.0 1.0 1.0 0.0(1100) Public Employee Relations Board 2 0 0 0 0.0 0.0 0.0 0.0Subtotal (1000) <strong>Agency</strong> Management Program 35 4 167 163 2.0 1.0 1.0 0.0(2000) Adjudication(2001) Legal Support 294 428 574 146 0.5 1.5 5.0 3.5(2002) Court Appeals 399 516 395 -121 3.4 4.5 3.0 -1.5(2003) Public Employee Relations Board 6 3 15 12 0.0 0.0 0.0 0.0Subtotal (2000) Adjudication 698 947 984 37 3.9 6.0 8.0 2.0Total Proposed Operating <strong>Budget</strong> 733 951 1,151 200 5.9 7.0 9.0 2.0(Change is calculated by whole numbers and numbers may not add up due to rounding)Note: For more detailed information regarding <strong>the</strong> proposed funding for <strong>the</strong> activities within this agency’s programs, please see Schedule 30-PBBProgram Summary by Activity in <strong>the</strong> FY 2013 Operating Appendices located on <strong>the</strong> <strong>Office</strong> <strong>of</strong> <strong>the</strong> <strong>Chief</strong> <strong>Financial</strong> <strong>Office</strong>r’s website.FY 2013 Proposed <strong>Budget</strong> ChangesThe Public Employee Relations Board’s (PERB) proposed FY 2013 gross budget is $1,151,005, which representsa 21.0 percent increase over its FY 2012 approved gross budget <strong>of</strong> $950,866. The budget is comprised entirely <strong>of</strong>Local funds.Public Employee Relations BoardA-174FY 2013 Proposed <strong>Budget</strong> and <strong>Financial</strong> Plan
Current Services Funding LevelThe Current Services Funding Level (CSFL) is a Local funds ONLY representation <strong>of</strong> <strong>the</strong> true cost <strong>of</strong> operatingDistrict agencies, before consideration <strong>of</strong> policy decisions. The CSFL reflects changes from <strong>the</strong> FY 2012 approvedbudget across multiple programs, and it estimates how much it would cost an agency to continue its current programsand operations into <strong>the</strong> following fiscal year. The initial adjustments in <strong>the</strong> budget proposal represent changesthat should be compared to <strong>the</strong> FY 2013 CSFL budget and not necessarily changes made to <strong>the</strong> FY 2012 Localfunds budget. The FY 2013 CSFL adjustments to <strong>the</strong> FY 2012 Local funds budget are described in table 5 <strong>of</strong> thisagency's budget chapter. Please see <strong>the</strong> CSFL Development section within Volume 1: Executive Summary for moreinformation regarding <strong>the</strong> methodology used and components that comprise <strong>the</strong> CSFL.PERB's FY 2013 CSFL budget is $967,609, which represents a $16,743, or 1.8 percent, increase over <strong>the</strong> FY2012 approved Local funds budget <strong>of</strong> $950,866.Initial Adjusted <strong>Budget</strong>Cost Increase: $188,280 to align personal services with <strong>the</strong> agency’s projected need.Cost Decrease: $188,280 in Contractual Services – O<strong>the</strong>r to <strong>of</strong>fset <strong>the</strong> increase in personal services.Additionally Adjusted <strong>Budget</strong>Technical Adjustment: Adjustment <strong>of</strong> Fringe Benefits to restore <strong>the</strong> District Government contribution for employeehealth insurance from 72 percent, implemented in <strong>the</strong> FY 2011 budget, to 75 percent in FY 2013, resulting inan increase <strong>of</strong> $3,396 in Local funds.Policy InitiativeCost Increase: $180,000 in Local funds and 2.0 FTEs in <strong>the</strong> Adjudication program to reduce <strong>the</strong> agency’s backlog<strong>of</strong> cases.FY 2012 Approved <strong>Budget</strong> to FY 2013 Proposed <strong>Budget</strong>, by Revenue TypeTable CG0-5 itemizes <strong>the</strong> changes by revenue type between <strong>the</strong> FY 2012 approved budget and <strong>the</strong> FY 2013 proposedbudget.Table CG0-5(dollars in thousands)PROGRAM BUDGET FTELOCAL FUNDS: FY 2012 Approved <strong>Budget</strong> and FTE 951 7.0Fringe Benefit Rate Adjustment Multiple Programs 8 0.0Consumer Price Index Multiple Programs 6 0.0Personal Services Growth Factor Multiple Programs 3 0.0FY 2013 Current Services Funding Level <strong>Budget</strong> (CSFL) 968 7.0Cost Increase: To align personal services cost with projected need Multiple Programs 188 0.0Cost Decrease: In Contractual Services - O<strong>the</strong>r to <strong>of</strong>fset Multiple Programs -188 0.0<strong>the</strong> increase in personal servicesFY 2013 Initial Adjusted <strong>Budget</strong> 968 7.0Technical Adjustment: Health insurance contribution Multiple Programs 3 0.0FY 2013 Additionally Adjusted <strong>Budget</strong> 971 7.0FY 2013 Policy InitiativeCost Increase: To reduce <strong>the</strong> agency’s backlog <strong>of</strong> cases Adjudication 180 2.0LOCAL FUNDS: FY 2013 Proposed <strong>Budget</strong> and FTE 1,151 9.0Gross for CG0 - Public Employee Relations Board 1,151 9.0(Change is calculated by whole numbers and numbers may not add up due to rounding)FY 2013 Proposed <strong>Budget</strong> and <strong>Financial</strong> PlanPublic Employee Relations BoardA-175
<strong>Agency</strong> Performance PlanThe agency’s performance plan has <strong>the</strong> following objectives for FY 2013:Objective 1: Satisfy statutory responsibilities by efficiently resolving labor management disputes between agencies<strong>of</strong> <strong>the</strong> District government and <strong>the</strong> labor organizations.Objective 2: Maintain and/or increase <strong>the</strong> number <strong>of</strong> matters that are settled through <strong>the</strong> voluntary and mandatory“mediation program.”Objective 3: Maintain a high rate <strong>of</strong> success concerning matters that are appealed to ei<strong>the</strong>r <strong>the</strong> D.C. Superior Courtor <strong>the</strong> D.C. Court <strong>of</strong> Appeals.Objective 4: Continue to review PERB’s rules in order to determine if PERB needs to amend its rules or promulgatenew rules.<strong>Agency</strong> Performance MeasuresFY 2010 FY 2011 FY 2011 FY 2012 FY 2013 FY 2014Measure Actual Target Actual Projection Projection ProjectionPercentage <strong>of</strong> cases decided within 120 days <strong>of</strong>submission to PERB. 37% 2 33% 44.9% 100% 100% TBDPercentage <strong>of</strong> decisions transmitted to <strong>the</strong> D.C. Not NotRegister for publication within 60 days <strong>of</strong> issuance. Available Available 100% 100% 100% TBDPercentage <strong>of</strong> compensation impasse resolutioncases that meet statutory time targets(e.g., mediation within 30 days, arbitration within45 days after <strong>the</strong> panel has been established). 100% 100% 100% 100% 100% TBDNot NotNumber <strong>of</strong> decisions issued by local courts. 2 2 - Available Available TBDPercentage <strong>of</strong> cases in which <strong>the</strong> courts affirmed PERB. 85% 100% 100% 100% 100% TBDPerformance Plan Endnotes:1. Industry Standard Measure - PERB surveyed sixteen (16) o<strong>the</strong>r state public employee relations agencies operating pursuant to a statute similar to <strong>the</strong> District <strong>of</strong> ColumbiaComprehensive Merit Personnel Act (CMPA). Specifically, PERB’s staff examined <strong>the</strong> types <strong>of</strong> information tracked by <strong>the</strong> surveyed state agencies. The majority <strong>of</strong> <strong>the</strong>se agenciestrack workload data, which PERB currently tracks. A minority <strong>of</strong> <strong>the</strong> state agencies surveyed track performance measures by which <strong>the</strong> timeliness and effectiveness <strong>of</strong> service canbe evaluated. These agencies base <strong>the</strong>ir performance measure on <strong>the</strong> percentage <strong>of</strong> decisions issued in compliance with <strong>the</strong>ir respective statutory guidelines. PERB also currentlytracks this information as evidenced by <strong>the</strong> data noted above in <strong>the</strong> “Proposed Key Performance Indicators”. In particular, PERB tracks: (1) <strong>the</strong> percentage <strong>of</strong> cases issued within 120days after being submitted to <strong>the</strong> Board; and (2) <strong>the</strong> percentage <strong>of</strong> compensation impasse resolution cases that meet statutory time targets.2. The Board could not hold a meeting from June 2008 through July 2009 because it did not have <strong>the</strong> three members necessary to “constitute a quorum for <strong>the</strong> transaction <strong>of</strong> business.”(D.C. Code § 1-605.01(1). As a result, <strong>the</strong> percentage noted concerning <strong>the</strong> number <strong>of</strong> cases decided within 120 days <strong>of</strong> submission to <strong>the</strong> Board, is not an accuraterepresentation <strong>of</strong> <strong>the</strong> baseline data.Public Employee Relations BoardA-176FY 2013 Proposed <strong>Budget</strong> and <strong>Financial</strong> Plan
(CH0)<strong>Office</strong> <strong>of</strong> Employee Appealshttp://oea.dc.govTelephone: 202-727-0004% ChangeFY 2011 FY 2012 FY 2013 fromDescription Actual Approved Proposed FY 2012Operating <strong>Budget</strong> $1,115,574 $1,359,735 $1,468,441 8.0FTEs 11.2 13.0 14.0 7.7The mission <strong>of</strong> <strong>the</strong> <strong>Office</strong> <strong>of</strong> Employee Appeals (OEA) is to renderimpartial, legally sufficient, and timely decisions on appeals filed byDistrict <strong>of</strong> Columbia government employees. OEA has jurisdictionover appeals in which an employee has been removed as a result <strong>of</strong> anadverse action for cause, placed on enforced leave for 10 days or more,suspended for 10 days or more, reduced in grade, or subjected to areduction in force.Summary <strong>of</strong> ServicesOEA <strong>of</strong>fers District government agencies and employees <strong>the</strong> following three-part appeal process: mediation, adjudication,and petitions for review. The mediation process allows <strong>the</strong> employee and <strong>the</strong> agency an opportunity toresolve <strong>the</strong>ir disputes without going through <strong>the</strong> lengthy and costly adjudication process. The adjudication processresults in disputes being resolved by an administrative judge who issues an initial decision and finds in favor <strong>of</strong> ei<strong>the</strong>r<strong>the</strong> agency or employee. The petition for review process provides an impartial review <strong>of</strong> initial decisions by OEA’sBoard.The agency’s FY 2013 proposed budget is presented in <strong>the</strong> following tables:FY 2013 Proposed <strong>Budget</strong> and <strong>Financial</strong> Plan<strong>Office</strong> <strong>of</strong> Employee AppealsA-177
FY 2013 Proposed Gross Funds Operating <strong>Budget</strong>, by Revenue TypeTable CH0-1 contains <strong>the</strong> proposed FY 2013 agency budget compared to <strong>the</strong> FY 2012 approved budget. It alsoprovides FY 2010 and FY 2011 actual expenditures.Table CH0-1(dollars in thousands)ChangeActual Actual Approved Proposed from PercentAppropriated Fund FY 2010 FY 2011 FY 2012 FY 2013 FY 2012 Change*General FundsLocal Funds 1,753 1,116 1,360 1,468 109 8.0Total for General Fund 1,753 1,116 1,360 1,468 109 8.0Gross Funds 1,753 1,116 1,360 1,468 109 8.0*Percent change is based on whole dollars.Note: If applicable, for a breakdown <strong>of</strong> each Grant (Federal and Private), Special Purpose Revenue type and Intra-District agreement,please refer to Schedule 80 <strong>Agency</strong> Summary by Revenue Source in <strong>the</strong> FY 2013 Operating Appendices located on <strong>the</strong> <strong>Office</strong> <strong>of</strong> <strong>the</strong><strong>Chief</strong> <strong>Financial</strong> <strong>Office</strong>r’s website.FY 2013 Proposed Full-Time Equivalents, by Revenue TypeTable CH0-2 contains <strong>the</strong> proposed FY 2013 FTE level compared to <strong>the</strong> FY 2012 approved FTE level by revenuetype. It also provides FY 2010 and FY 2011 actual data.Table CH0-2ChangeActual Actual Approved Proposed from PercentAppropriated Fund FY 2010 FY 2011 FY 2012 FY 2013 FY 2012 ChangeGeneral FundLocal Funds 10.7 11.2 13.0 14.0 1.0 7.7Total for General Fund 10.7 11.2 13.0 14.0 1.0 7.7Total Proposed FTEs 10.7 11.2 13.0 14.0 1.0 7.7<strong>Office</strong> <strong>of</strong> Employee AppealsA-178FY 2013 Proposed <strong>Budget</strong> and <strong>Financial</strong> Plan
FY 2013 Proposed Operating <strong>Budget</strong>, by Comptroller Source GroupTable CH0-3 contains <strong>the</strong> proposed FY 2013 budget at <strong>the</strong> Comptroller Source Group (object class) level comparedto <strong>the</strong> FY 2012 approved budget. It also provides FY 2010 and FY 2011 actual expenditures.Table CH0-3(dollars in thousands)ChangeActual Actual Approved Proposed from PercentComptroller Source Group FY 2010 FY 2011 FY 2012 FY 2013 FY 2012 Change*11 - Regular Pay - Continuing Full Time 883 761 1,008 1,045 37 3.612 - Regular Pay - O<strong>the</strong>r 19 86 92 93 1 1.513 - Additional Gross Pay 89 13 0 0 0 N/A14 - Fringe Benefits - Current Personnel 168 157 179 201 22 12.5Subtotal Personal Services (PS) 1,159 1,017 1,279 1,340 60 4.720 - Supplies and Materials 5 18 10 15 5 50.031 - Telephone, Telegraph, Telegram, Etc. 6 5 0 0 0 N/A32 - Rentals - Land and Structures 468 0 0 0 0 N/A35 - Occupancy Fixed Costs 3 0 0 0 0 N/A40 - O<strong>the</strong>r Services and Charges 22 40 45 59 14 30.841 - Contractual Services - O<strong>the</strong>r 66 31 15 35 20 126.470 - Equipment and Equipment Rental 24 5 10 20 10 100.0Subtotal Nonpersonal Services (NPS) 594 99 80 129 48 60.1Gross Funds 1,753 1,116 1,360 1,468 109 8.0*Percent change is based on whole dollars.FY 2013 Proposed <strong>Budget</strong> and <strong>Financial</strong> Plan<strong>Office</strong> <strong>of</strong> Employee AppealsA-179
Program DescriptionThe <strong>Office</strong> <strong>of</strong> Employee Appeals operates through <strong>the</strong> following 2 programs:Adjudication – provides mediation sessions, impartial hearings, and adjudication appeals for District governmentemployees who challenge an agency’s final decision on personnel matters.This program contains <strong>the</strong> following 3 activities:■ Mediation – provides both parties an opportunity to resolve or settle disputes without going through <strong>the</strong>lengthy and costly adjudication process;■ Adjudication Process – provides impartial, fair decisions to employees for timely resolution <strong>of</strong> <strong>the</strong>ir appeal; and■ Appeals – provides an impartial review by <strong>the</strong> <strong>Office</strong> <strong>of</strong> Employee Appeals Board <strong>of</strong> <strong>the</strong> decisions filed.<strong>Agency</strong> Management – provides for administrative support and <strong>the</strong> required tools to achieve operational and programmaticresults. This program is standard for all agencies using performance-based budgeting.Program Structure ChangeThe <strong>Office</strong> <strong>of</strong> Employee Appeals has no program structure changes in <strong>the</strong> FY 2013 proposed budget.FY 2013 Proposed Operating <strong>Budget</strong> and FTEs, by Program and ActivityTable CH0-4 contains <strong>the</strong> proposed FY 2013 budget by program and activity compared to <strong>the</strong> FY 2012 approved budget.It also provides <strong>the</strong> FY 2011 actual data.Table CH0-4(dollars in thousands)Dollars in ThousandsFull-Time EquivalentsChangeChangeActual Approved Proposed from Actual Approved Proposed fromProgram/Activity FY 2011 FY 2012 FY 2013 FY 2012 FY 2011 FY 2012 FY 2013 FY 2012(1000) <strong>Agency</strong> Management Program(1040) Information Technology 57 55 56 1 0.9 1.0 1.0 0.0(1085) Customer Service 51 42 43 2 0.9 1.0 1.0 0.0(1090) Performance Management 9 160 162 2 0.9 1.0 1.0 0.0(1100) <strong>Office</strong> <strong>of</strong> Employee Appeals 551 560 543 -16 6.1 5.5 5.5 0.0Subtotal (1000) <strong>Agency</strong> Management Program 668 817 805 -11 8.9 8.5 8.5 0.0(2000) Adjudication(2001) Adjudication Process 349 463 534 -12 2.3 4.5 5.5 1.0(2002) Appeals 99 80 129 48 0.0 0.0 0.0 0.0Subtotal (2000) Adjudication 448 543 663 120 2.3 4.5 5.5 1.0Total Proposed Operating <strong>Budget</strong> 1,116 1,360 1,468 109 11.2 13.0 14.0 1.0(Change is calculated by whole numbers and numbers may not add up due to rounding)Note: For more detailed information regarding <strong>the</strong> proposed funding for <strong>the</strong> activities within this agency’s programs, please see Schedule 30-PBBProgram Summary by Activity in <strong>the</strong> FY 2013 Operating Appendices located on <strong>the</strong> <strong>Office</strong> <strong>of</strong> <strong>the</strong> <strong>Chief</strong> <strong>Financial</strong> <strong>Office</strong>r’s website.<strong>Office</strong> <strong>of</strong> Employee AppealsA-180FY 2013 Proposed <strong>Budget</strong> and <strong>Financial</strong> Plan
FY 2013 Proposed <strong>Budget</strong> ChangesThe <strong>Office</strong> <strong>of</strong> Employee Appeals’ (OEA) proposed FY 2013 gross budget is $1,468,441, which represents a 8.0percent increase over its FY 2012 approved gross budget <strong>of</strong> $1,359,735. The budget is comprised entirely <strong>of</strong> Localfunds.Current Services Funding LevelThe Current Services Funding Level (CSFL) is a Local funds ONLY representation <strong>of</strong> <strong>the</strong> true cost <strong>of</strong> operatingDistrict agencies, before consideration <strong>of</strong> policy decisions. The CSFL reflects changes from <strong>the</strong> FY 2012 approvedbudget across multiple programs, and it estimates how much it would cost an agency to continue its current programsand operations into <strong>the</strong> following fiscal year. The initial adjustments in <strong>the</strong> budget proposal representschanges that should be compared to <strong>the</strong> FY 2013 CSFL budget and not necessarily changes made to <strong>the</strong> FY 2012Local funds budget. The FY 2013 CSFL adjustments to <strong>the</strong> FY 2012 Local funds budget are described in table 5<strong>of</strong> this agency's budget chapter. Please see <strong>the</strong> CSFL Development section within Volume 1: Executive Summaryfor more information regarding <strong>the</strong> methodology used and components that comprise <strong>the</strong> CSFL.OEA’s FY 2013 CSFL budget is $1,379,374, which represents a $19,639, or 1.4 percent, increase over <strong>the</strong> FY2012 approved Local funds budget <strong>of</strong> 1,359,735.Initial Adjusted <strong>Budget</strong>Cost Increase: Additional $46,785 in Local funds to cover <strong>the</strong> cost <strong>of</strong> Contractual Services and Equipment purchases.Cost Decrease: A reduction <strong>of</strong> $46,785 in Local funds due to realignment <strong>of</strong> personal services costs to <strong>of</strong>fset increasesto Contractual Services and Equipment purchases.Additionally Adjusted <strong>Budget</strong>Technical Adjustment: Adjustment <strong>of</strong> Fringe Benefits to restore <strong>the</strong> District Government contribution for employeehealth insurance from 72 percent, implemented in <strong>the</strong> FY 2011 budget, to 75 percent in FY 2013, resulting inan increase <strong>of</strong> $4,067 in Local funds.Policy InitiativesCost Increase: $85,000 in Local funds to support <strong>the</strong> salary <strong>of</strong> an Administrative Law Judge position.FY 2013 Proposed <strong>Budget</strong> and <strong>Financial</strong> Plan<strong>Office</strong> <strong>of</strong> Employee AppealsA-181
FY 2012 Approved <strong>Budget</strong> to FY 2013 Proposed <strong>Budget</strong>, by Revenue TypeTable CH0-5 itemizes <strong>the</strong> changes by revenue type between <strong>the</strong> FY 2012 approved budget and <strong>the</strong> FY 2013 proposedbudget.Table CH0-5(dollars in thousands)PROGRAM BUDGET FTELOCAL FUNDS: FY 2012 Approved <strong>Budget</strong> and FTE 1,360 13.0Fringe Benefit Rate Adjustment Multiple Programs 13 0.0Consumer Price Index Multiple Programs 2 0.0Personal Services Growth Factor Multiple Programs 6 0.0FY 2013 Current Services Funding Level <strong>Budget</strong> (CSFL) 1,379 13.0Cost Increase: Contractual Services, Equipment Purchases Multiple Programs 47 0.0and O<strong>the</strong>r Services and ChargesCost Decrease: Savings from <strong>the</strong> realignment Multiple Programs -47 0.0<strong>of</strong> personal servicesFY 2013 Initial Adjusted <strong>Budget</strong> 1,379 13.0Technical Adjustment: Health insurance contribution Multiple Programs 4 0.0FY 2013 Additionally Adjusted <strong>Budget</strong> 1,383 13.0FY 2013 Policy InitiativesCost Increase: To support <strong>the</strong> salary <strong>of</strong> an Administrative Adjudication 85 1.0Law Judge positionLOCAL FUNDS: FY 2013 Proposed <strong>Budget</strong> and FTE 1,468 14.0Gross for CH0 - <strong>Office</strong> <strong>of</strong> Employee Appeals 1,468 14.0(Change is calculated by whole numbers and numbers may not add up due to rounding)<strong>Office</strong> <strong>of</strong> Employee AppealsA-182FY 2013 Proposed <strong>Budget</strong> and <strong>Financial</strong> Plan
<strong>Agency</strong> Performance PlanThe agency’s performance plan has <strong>the</strong> following objectives for FY 2013:Objective 1: Render impartial, legally sound decisions in a timely manner.Objective 2: Timely process appeals that are subject to mandatory mediation.Objective 3: Maintain a system to allow <strong>the</strong> public to have access to all decisions rendered by <strong>the</strong> <strong>of</strong>fice.<strong>Agency</strong> Performance MeasuresFY 2010 FY 2011 FY 2011 FY 2012 FY 2013 FY 2014Measure Actual Target Actual Projection Projection ProjectionNumber <strong>of</strong> initial decisions issued 156 180 188 200 200 200Number <strong>of</strong> opinions and orders issued 35 35 50 35 35 35Mean length <strong>of</strong> time required to completeadjudications 1 9.5 months 9.5 months 13 months 13 months 13 months 13 monthsMean length <strong>of</strong> time required to resolve petitionsfor review 2 17 months 17 months 11 months 11 months 11 months 11 monthsPercentage <strong>of</strong> cases reversing agency decisions 13.6% 3 Not 5.8% 4 Not Not NotAvailable Available Available AvailablePercentage <strong>of</strong> OEA decisions upheld by <strong>the</strong>D.C. Superior Court and D.C. Court <strong>of</strong> Appeals 100% 5 100% 100% 6 99% 99% 99%Performance Plan Endnotes:1 The months indicated represent <strong>the</strong> time from which an appeal is filed with OEA until an initial decision is issued by an Administrative Judge.2 The months indicated represent <strong>the</strong> time from which an appeal is filed with <strong>the</strong> OEA Board until a final decision is rendered.3 In FY 2010, OEA reversed 26 agency decisions <strong>of</strong> <strong>the</strong> 191 total cases decided.4 In FY 2011, OEA reversed 14 agency decisions <strong>of</strong> <strong>the</strong> 238 total cases decided.5 Of <strong>the</strong> 191 total decisions issued by OEA in FY 2010, <strong>the</strong> D.C. Superior Court issued 2 decisions upholding OEA. The D.C. Court <strong>of</strong> Appeals issued1 decision upholding OEA.6 Of <strong>the</strong> 238 total decisions issued by OEA in FY 2011, <strong>the</strong> D.C. Superior Court issued 2 decisions upholding OEA. The D.C. Court <strong>of</strong> Appeals issued2 decisions upholding OEA.FY 2013 Proposed <strong>Budget</strong> and <strong>Financial</strong> Plan<strong>Office</strong> <strong>of</strong> Employee AppealsA-183
Metropolitan WashingtonCouncil <strong>of</strong> Governments(EA0)www.mwcog.orgTelephone: 202-962-3200% ChangeFY 2011 FY 2012 FY 2013 fromDescription Actual Approved Proposed FY 2012Operating <strong>Budget</strong> $494,929 $395,943 $407,943 3.0The mission <strong>of</strong> <strong>the</strong> Metropolitan Washington Council <strong>of</strong>Governments (MWCOG) is to enhance <strong>the</strong> quality <strong>of</strong> life and competitiveadvantages <strong>of</strong> <strong>the</strong> Washington metropolitan region in <strong>the</strong>global economy by providing a forum for consensus building and policy-making;implementing intergovernmental policies, plans, and programs;and supporting <strong>the</strong> region as an expert information resource.In <strong>the</strong> District’s budget, <strong>the</strong> MWCOG agency represents <strong>the</strong> District’s annual payment to MWCOG.FY 2013 Proposed <strong>Budget</strong> and <strong>Financial</strong> PlanMetropolitan Washington Council <strong>of</strong> GovernmentsA-185
The agency’s FY 2013 proposed budget is presented in <strong>the</strong> following tables:FY 2013 Proposed Gross Funds Operating <strong>Budget</strong>, by Revenue TypeTable EA0-1 contains <strong>the</strong> proposed FY 2013 agency budget compared to <strong>the</strong> FY 2012 approved budget. It alsoprovides FY 2010 and FY 2011 actual expenditures.Table EA0-1(dollars in thousands)ChangeActual Actual Approved Proposed from PercentAppropriated Fund FY 2010 FY 2011 FY 2012 FY 2013 FY 2012 Change*General FundLocal Funds 297 495 396 408 12 3.0Total for General Fund 297 495 396 408 12 3.0Gross Funds 297 495 396 408 12 3.0*Percent change is based on whole dollars.Note: If applicable, for a breakdown <strong>of</strong> each Grant (Federal and Private), Special Purpose Revenue type and Intra-District agreement,please refer to Schedule 80 <strong>Agency</strong> Summary by Revenue Source in <strong>the</strong> FY 2013 Operating Appendices located on <strong>the</strong> <strong>Office</strong> <strong>of</strong> <strong>the</strong><strong>Chief</strong> <strong>Financial</strong> <strong>Office</strong>r’s website.FY 2013 Proposed Operating <strong>Budget</strong>, by Comptroller Source GroupTable EA0-2 contains <strong>the</strong> proposed FY 2013 budget at <strong>the</strong> Comptroller Source Group (object class) level comparedto <strong>the</strong> FY 2012 approved budget. It also provides FY 2010 and FY 2011 actual expenditures.Table EA0-2(dollars in thousands)ChangeActual Actual Approved Proposed from PercentComptroller Source Group FY 2010 FY 2011 FY 2012 FY 2013 FY 2012 Change*50 - Subsidies and Transfers 297 495 396 408 12 3.0Subtotal Nonpersonal Services (NPS) 297 495 396 408 12 3.0Gross Funds 297 495 396 408 12 3.0*Percent change is based on whole dollars.Metropolitan Washington Council <strong>of</strong> GovernmentsA-186FY 2013 Proposed <strong>Budget</strong> and <strong>Financial</strong> Plan
Program DescriptionThe District’s payment to <strong>the</strong> Metropolitan Washington Council <strong>of</strong> Governments is reflected as one program in<strong>the</strong> District’s financial system. However, MWCOG operates through <strong>the</strong> following 9 programs:Transportation Planning - provides transportation planning for <strong>the</strong> metropolitan Washington area through <strong>the</strong>Transportation Planning Board, in cooperation with <strong>the</strong> area's local governments and federal, state, and regionalagencies responsible for funding and implementing highway, bridge, transit, and o<strong>the</strong>r projects.Commuter Connections - coordinates programs aimed at alleviating road congestion and reducing vehicle emissionsthrough ride-matching services, employer outreach, telecommuting programs, integrated ride-share informationkiosks, and mass marketing campaigns, to encourage alternatives to driving alone.Metropolitan Planning and Economic Development - assists local governments in developing <strong>the</strong> planning databasesand analytic tools needed to analyze regional economic and demographic change. The program providesMWCOG member jurisdictions with analyses <strong>of</strong> current and projected growth trends and provides data to <strong>the</strong>Transportation Planning Board as it develops transportation plans for <strong>the</strong> region.Housing Opportunities and Community Management - covers an array <strong>of</strong> issues that are important to <strong>the</strong> policydevelopments <strong>of</strong> area local governments and <strong>the</strong>ir housing authorities. The program provides data on <strong>the</strong> region'shousing stock, Section 8 housing, homelessness, and housing affordability.Child Welfare - facilitates regional foster care and adoption initiatives to help area children lead happy, healthy, andproductive lives.Public Safety, Health and Homeland Security - coordinates regional programs and policies on a broad range <strong>of</strong>issues, including law enforcement, fire safety, public health, and emergency preparedness. The program helps tokeep <strong>the</strong> region safe and healthy by supporting innovative regional policies and programs, developing regionalmutual aid agreements, providing technical assistance and training to public safety and health <strong>of</strong>ficials, and developingpublic education and prevention measures.Water Resources Planning and Management - facilitates efforts to clean <strong>the</strong> region's waterways including <strong>the</strong>Chesapeake Bay, <strong>the</strong> Anacostia River watershed, and <strong>the</strong> Potomac River. The program includes water quality managementpolicy, technical analysis, storm water management, water health issues, drought coordination, and waterrelatedhomeland security planning.Environmental Resources - provides support to local government programs in <strong>the</strong> region that address solid wastemanagement, recycling, energy, airport noise, pollution, and alternative fuels.Air Quality Planning - supports <strong>the</strong> Metropolitan Washington Air Quality Committee, which is certified to preparefederally mandated plans to clean <strong>the</strong> region's air. This program also tracks pollution levels on a daily basisthrough <strong>the</strong> Air Quality Index, provides seasonal forecasts, and organizes public education campaigns.Program Structure ChangeThe Metropolitan Washington Council <strong>of</strong> Governments has no program structure changes in <strong>the</strong> FY 2013 proposedbudget.FY 2013 Proposed <strong>Budget</strong> and <strong>Financial</strong> PlanMetropolitan Washington Council <strong>of</strong> GovernmentsA-187
FY 2013 Proposed Operating <strong>Budget</strong> and FTEs, by Program and ActivityTable EA0-3 contains <strong>the</strong> proposed FY 2013 budget by program and activity compared to <strong>the</strong> FY 2012 approved budget.It also provides <strong>the</strong> FY 2011 actual data.Table EA0-3(dollars in thousands)Dollars in ThousandsFull-Time EquivalentsChangeChangeActual Approved Proposed from Actual Approved Proposed fromProgram/Activity FY 2011 FY 2012 FY 2013 FY 2012 FY 2011 FY 2012 FY 2013 FY 2012(1000) Metropolitan Washington Council <strong>of</strong> Governments(1100) Metropolitan Washington Council <strong>of</strong> Governments 495 396 408 12 0.0 0.0 0.0 0.0Subtotal (1000) Metropolitan Washington Council <strong>of</strong> Governments 495 396 408 12 0.0 0.0 0.0 0.0Total Proposed Operating <strong>Budget</strong> 495 396 408 12 0.0 0.0 0.0 0.0(Change is calculated by whole numbers and numbers may not add up due to rounding)Note: For more detailed information regarding <strong>the</strong> proposed funding for <strong>the</strong> activities within this agency’s programs, please see Schedule 30-PBBProgram Summary by Activity in <strong>the</strong> FY 2013 Operating Appendices located on <strong>the</strong> <strong>Office</strong> <strong>of</strong> <strong>the</strong> <strong>Chief</strong> <strong>Financial</strong> <strong>Office</strong>r’s website.FY 2013 Proposed <strong>Budget</strong> ChangesThe Metropolitan Washington Council <strong>of</strong> Governments (MWGOG) proposed FY 2013 gross budget is$407,943, which represents a 3.0 percent increase over its FY 2012 approved gross budget <strong>of</strong> $395,943. The budgetis comprised entirely <strong>of</strong> Local funds.Current Services Funding LevelThe Current Services Funding Level (CSFL) is a Local funds ONLY representation <strong>of</strong> <strong>the</strong> true cost <strong>of</strong> operatingDistrict agencies, before consideration <strong>of</strong> policy decisions. The CSFL reflects changes from <strong>the</strong> FY 2012 approvedbudget across multiple programs, and it estimates how much it would cost an agency to continue its current programsand operations into <strong>the</strong> following fiscal year. The initial adjustments in <strong>the</strong> budget proposal representchanges that should be compared to <strong>the</strong> FY 2013 CSFL budget and not necessarily changes made to <strong>the</strong> FY 2012Local funds budget. The FY 2013 CSFL adjustments to <strong>the</strong> FY 2012 Local funds budget are described in table 4<strong>of</strong> this agency's budget chapter. Please see <strong>the</strong> CSFL Development section within Volume 1: Executive Summaryfor more information regarding <strong>the</strong> methodology used and components that comprise <strong>the</strong> CSFL.Metropolitan Washington Council <strong>of</strong> Government’s FY 2013 CSFL budget is $395,943, which is no change from<strong>the</strong> FY 2012 approved Local funds budget <strong>of</strong> $395,943.Initial Adjusted <strong>Budget</strong>Cost Increase: Additional funding <strong>of</strong> $12,000 in Local funds accounts for <strong>the</strong> newly adopted MetropolitanWashington Council <strong>of</strong> Governments membership assessment rate.Metropolitan Washington Council <strong>of</strong> GovernmentsA-188FY 2013 Proposed <strong>Budget</strong> and <strong>Financial</strong> Plan
FY 2012 Approved <strong>Budget</strong> to FY 2013 Proposed <strong>Budget</strong>, by Revenue TypeTable EA0-4 itemizes <strong>the</strong> changes by revenue type between <strong>the</strong> FY 2012 approved budget and <strong>the</strong> FY 2013 proposedbudget.Table EA0-4(dollars in thousands)PROGRAM BUDGET FTELOCAL FUNDS: FY 2012 Approved <strong>Budget</strong> and FTE 396 0.0No Changes 0 0.0FY 2013 Current Services Funding Level <strong>Budget</strong> (CSFL) 396 0.0Cost Increase: Accounts for newly adopted MWCOG Metropolitan Washington 12 0.0membership assessment rateCouncil <strong>of</strong> GovernmentsFY 2013 Initial Adjusted <strong>Budget</strong> 408 0.0LOCAL FUNDS: FY 2013 Proposed <strong>Budget</strong> and FTE 408 0.0Gross for EA0 - Metropolitan Washington Council <strong>of</strong> Governments 408 0.0(Change is calculated by whole numbers and numbers may not add up due to rounding)FY 2013 Proposed <strong>Budget</strong> and <strong>Financial</strong> PlanMetropolitan Washington Council <strong>of</strong> GovernmentsA-189
Municipal Facilities:Non-Capital(ZX0)www.dres.dc.govTelephone: 202-724-4400% ChangeFY 2011 FY 2012 FY 2013 fromDescription Actual Approved Proposed FY 2012Operating <strong>Budget</strong> $265,156,964 $0 $0 N/AFTEs 215.4 0.0 0.0 N/AThe Municipal Facilities: Non-Capital (MFNC) agency was absorbedinto <strong>the</strong> Department <strong>of</strong> General Services (DGS). Its mission, funding,and all full-time equivalents (FTEs) were transferred in FY 2012.The proposed programs and projects for FY 2013 are shown in <strong>the</strong>Department <strong>of</strong> General Services budget chapter within <strong>the</strong>Governmental Direction and Support section <strong>of</strong> <strong>the</strong> budget.FY 2013 Proposed <strong>Budget</strong> and <strong>Financial</strong> PlanMunicipal Facilities: Non-CapitalA-191
The agency’s FY 2013 proposed budget is presented in <strong>the</strong> following tables:FY 2013 Proposed Gross Funds Operating <strong>Budget</strong>, by Revenue TypeTable ZX0-1 contains <strong>the</strong> proposed FY 2013 agency budget compared to <strong>the</strong> FY 2012 approved budget. It alsoprovides FY 2010 and FY 2011 actual expenditures.Table ZX0-1(dollars in thousands)ChangeActual Actual Approved Proposed from PercentAppropriated Fund FY 2010 FY 2011 FY 2012 FY 2013 FY 2012 Change*General FundLocal Funds 0 122,657 0 0 0 N/ASpecial Purpose Revenue Funds 0 969 0 0 0 N/ATotal for General Fund 0 123,627 0 0 0 N/AIntra-District FundsIntra-District Funds 0 141,530 0 0 0 N/ATotal for Intra-District Funds 0 141,530 0 0 0 N/AGross Funds 0 265,157 0 0 0 N/A*Percent change is based on whole dollars.Note: If applicable, for a breakdown <strong>of</strong> each Grant (Federal and Private), Special Purpose Revenue type and Intra-District agreement,please refer to Schedule 80 <strong>Agency</strong> Summary by Revenue Source in <strong>the</strong> FY 2013 Operating Appendices located on <strong>the</strong> <strong>Office</strong> <strong>of</strong> <strong>the</strong><strong>Chief</strong> <strong>Financial</strong> <strong>Office</strong>r’s website.FY 2013 Proposed Full-Time Equivalents, by Revenue TypeTable ZX0-2 contains <strong>the</strong> proposed FY 2013 FTE level compared to <strong>the</strong> FY 2012 approved FTE level by revenuetype. It also provides FY 2010 and FY 2011 actual data.Table ZX0-2ChangeActual Actual Approved Proposed from PercentAppropriated Fund FY 2010 FY 2011 FY 2012 FY 2013 FY 2012 ChangeGeneral FundLocal Funds 0.0 215.4 0.0 0.0 0.0 N/ATotal for General Fund 0.0 215.4 0.0 0.0 0.0 N/ATotal Proposed FTEs 0.0 215.4 0.0 0.0 0.0 N/AMunicipal Facilities: Non-CapitalA-192FY 2013 Proposed <strong>Budget</strong> and <strong>Financial</strong> Plan
FY 2013 Proposed Operating <strong>Budget</strong>, by Comptroller Source GroupTable ZX0-3 contains <strong>the</strong> proposed FY 2013 budget at <strong>the</strong> Comptroller Source Group (object class) level comparedto <strong>the</strong> FY 2012 approved budget. It also provides FY 2010 and FY 2011 actual expenditures.Table ZX0-3(dollars in thousands)ChangeActual Actual Approved Proposed from PercentComptroller Source Group FY 2010 FY 2011 FY 2012 FY 2013 FY 2012 Change*11 - Regular Pay - Cont Full Time 0 8,868 0 0 0 N/A12 - Regular Pay - O<strong>the</strong>r 0 2,421 0 0 0 N/A13 - Additional Gross Pay 0 435 0 0 0 N/A14 - Fringe Benefits - Curr Personnel 0 2,642 0 0 0 N/A15 - Overtime Pay 0 888 0 0 0 N/ASubtotal Personal Services (PS) 0 15,254 0 0 0 N/A20 - Supplies and Materials 0 153 0 0 0 N/A30 - Energy, Comm. and Bldg Rentals 0 94,073 0 0 0 N/A32 - Rentals - Land and Structures 0 124,483 0 0 0 N/A40 - O<strong>the</strong>r Services and Charges 0 601 0 0 0 N/A41 - Contractual Services - O<strong>the</strong>r 0 30,335 0 0 0 N/A70 - Equipment and Equipment Rental 0 258 0 0 0 N/ASubtotal Nonpersonal Services (NPS) 0 249,903 0 0 0 N/AGross Funds 0 265,157 0 0 0 N/A*Percent change is based on whole dollars.Program DescriptionPlease see <strong>the</strong> Department <strong>of</strong> General Services budget chapter for a description <strong>of</strong> programs related to <strong>the</strong> priorfunctions <strong>of</strong> Municipal Facilities: Non-Capital.FY 2013 Proposed <strong>Budget</strong> and <strong>Financial</strong> PlanMunicipal Facilities: Non-CapitalA-193
FY 2013 Proposed Operating <strong>Budget</strong> and FTEs, by Program and ActivityTable ZX0-4 contains <strong>the</strong> proposed FY 2013 budget by program and activity compared to <strong>the</strong> FY 2012 approved budget.It also provides <strong>the</strong> FY 2011 actual data.Table ZX0-4(dollars in thousands)Dollars in ThousandsFull-Time EquivalentsChangeChangeActual Approved Proposed from Actual Approved Proposed fromProgram/Activity FY 2011 FY 2012 FY 2013 FY 2012 FY 2011 FY 2012 FY 2013 FY 2012(2000) Energy(2001) Fuel 15,901 0 0 0 0.0 0.0 0.0 0.0(2002) Natural Gas 14,083 0 0 0 0.0 0.0 0.0 0.0(2003) Electricity 51,692 0 0 0 0.0 0.0 0.0 0.0(2004) Steam 1,657 0 0 0 0.0 0.0 0.0 0.0(2005) Water 10,740 0 0 0 0.0 0.0 0.0 0.0Subtotal (2000) Energy 94,073 0 0 0 0.0 0.0 0.0 0.0(3000) Building Services(3001) Rent 124,483 0 0 0 0.0 0.0 0.0 0.0(3002) Janitorial 6,083 0 0 0 5.7 0.0 0.0 0.0(3003) Occupancy 15,966 0 0 0 109.6 0.0 0.0 0.0(3004) Security 24,553 0 0 0 100.1 0.0 0.0 0.0Subtotal (3000) Building Services 171,084 0 0 0 215.4 0.0 0.0 0.0Total Proposed Operating <strong>Budget</strong> 265,157 0 0 0 215.4 0.0 0.0 0.0(Changes calculated by whole numbers and numbers may not add up due to rounding)Note: For more detailed information regarding <strong>the</strong> proposed funding for <strong>the</strong> activities within this agency’s programs, please see Schedule 30-PBBProgram Summary by Activity in <strong>the</strong> FY 2013 Operating Appendices located on <strong>the</strong> <strong>Office</strong> <strong>of</strong> <strong>the</strong> <strong>Chief</strong> <strong>Financial</strong> <strong>Office</strong>r’s website.Municipal Facilities: Non-CapitalA-194FY 2013 Proposed <strong>Budget</strong> and <strong>Financial</strong> Plan
<strong>Office</strong> <strong>of</strong> <strong>the</strong> Attorney General for <strong>the</strong>District <strong>of</strong> Columbiawww.oag.dc.govTelephone: 202-727-3400(CB0)% ChangeFY 2011 FY 2012 FY 2013 fromDescription Actual Approved Proposed FY 2012Operating <strong>Budget</strong> $85,496,743 $94,531,748 $96,650,369 2.2FTEs 721.1 728.7 732.8 0.6The mission <strong>of</strong> <strong>the</strong> <strong>Office</strong> <strong>of</strong> <strong>the</strong> Attorney General (OAG) is to enforce<strong>the</strong> laws <strong>of</strong> <strong>the</strong> District <strong>of</strong> Columbia and to provide legal services to<strong>the</strong> District government.Summary <strong>of</strong> ServicesOAG is charged with conducting <strong>the</strong> District’s legal business. To discharge <strong>the</strong>se duties, OAG is divided into thirteendivisions: <strong>the</strong> <strong>Office</strong> <strong>of</strong> <strong>the</strong> Solicitor General; Child Support Services; Civil Litigation; Commercial; FamilyServices; Public Interest; Legal Counsel; Public Safety; Personnel, Labor and Employment; and <strong>Agency</strong>Management; <strong>Agency</strong> <strong>Financial</strong> Operations; Support Services; and <strong>Office</strong> <strong>of</strong> <strong>the</strong> Attorney General. OAG represents<strong>the</strong> District in virtually all civil litigation, prosecutes certain criminal <strong>of</strong>fenses on <strong>the</strong> District’s behalf and represents<strong>the</strong> District in a variety <strong>of</strong> administrative hearings and o<strong>the</strong>r proceedings. In addition, OAG is responsiblefor advising <strong>the</strong> Executive <strong>Office</strong> <strong>of</strong> <strong>the</strong> Mayor, <strong>the</strong> District Council, <strong>the</strong> D.C. Courts, and various Boards andCommissions; for reviewing legislation and regulations; and for supervising lawyers working in <strong>the</strong> general counsel<strong>of</strong>fices <strong>of</strong> 28 agencies. All told, <strong>the</strong> Attorney General supervises <strong>the</strong> legal work <strong>of</strong> about 350 attorneys and anadditional 350 administrative/pr<strong>of</strong>essional staff.The agency’s FY 2013 proposed budget is presented in <strong>the</strong> following tables:FY 2013 Proposed <strong>Budget</strong> and <strong>Financial</strong> Plan<strong>Office</strong> <strong>of</strong> <strong>the</strong> Attorney General for <strong>the</strong> District <strong>of</strong> ColumbiaA-195
FY 2013 Proposed Gross Funds Operating <strong>Budget</strong>, by Revenue TypeTable CB0-1 contains <strong>the</strong> proposed FY 2013 agency budget compared to <strong>the</strong> FY 2012 approved budget. It alsoprovides <strong>the</strong> FY 2010 and FY 2011 actual expenditures.Table CB0-1(dollars in thousands)ChangeActual Actual Approved Proposed from PercentAppropriated Fund FY 2010 FY 2011 FY 2012 FY 2013 FY 2012 Change*General FundLocal Funds 56,039 48,936 56,661 58,688 2,027 3.6Special Purpose Revenue Funds 3,813 5,592 1,624 1,810 186 11.5Total for General Funds 59,852 54,528 58,284 60,498 2,214 3.8Federal ResourcesFederal Grant Funds 18,598 17,452 19,613 20,257 643 3.3Total for Federal Resources 18,598 17,452 19,613 20,257 643 3.3Private FundsPrivate Grant Funds 102 126 144 0 -144 -100.0Total for Private Funds 102 126 144 0 -144 -100.0Intra-District FundsIntra-District Funds 14,065 13,390 16,490 15,896 -594 -3.6Total for Intra-District Funds 14,065 13,390 16,490 15,896 -594 -3.6Gross Funds 92,616 85,497 94,532 96,650 2,119 2.2*Percent change is based on whole dollars.Note: If applicable, for a breakdown <strong>of</strong> each Grant (Federal and Private), Special Purpose Revenue type and Intra-District agreement,please refer to Schedule 80 <strong>Agency</strong> Summary by Revenue Source in <strong>the</strong> FY 2013 Operating Appendices located on <strong>the</strong> <strong>Office</strong> <strong>of</strong> <strong>the</strong><strong>Chief</strong> <strong>Financial</strong> <strong>Office</strong>r’s website.<strong>Office</strong> <strong>of</strong> <strong>the</strong> Attorney General for <strong>the</strong> District <strong>of</strong> ColumbiaA-196FY 2013 Proposed <strong>Budget</strong> and <strong>Financial</strong> Plan
FY 2013 Proposed Full-Time Equivalents, by Revenue TypeTable CB0-2 contains <strong>the</strong> proposed FY 2013 FTE level compared to <strong>the</strong> FY 2012 approved FTE level by revenuetype. It also provides FY 2010 and FY 2011 actual data.Table CB0-2ChangeActual Actual Approved Proposed from PercentAppropriated Fund FY 2010 FY 2011 FY 2012 FY 2013 FY 2012 Change*General FundLocal Funds 441.6 413.4 453.1 462.3 9.1 2.0Special Purpose Revenue Funds 32.0 36.9 0.4 3.4 3.0 745.0Total for General Funds 473.7 450.3 453.5 465.6 12.1 2.7Federal ResourcesFederal Grant Funds 151.0 130.0 132.0 139.6 7.6 5.8Total for Federal Resources 151.0 130.0 132.0 139.6 7.6 5.8Private FundsPrivate Grant Funds 0.0 2.9 3.0 0.0 -3.0 -100.0Total for Private Funds 0.0 2.9 3.0 0.0 -3.0 -100.0Intra-District FundsIntra-District Funds 111.5 137.8 140.2 127.6 -12.6 -9.0Total for Intra-District Funds 111.5 137.8 140.2 127.6 -12.6 -9.0Total Proposed FTEs 736.2 721.1 728.7 732.8 4.1 0.6*Percent change is based on whole dollars.FY 2013 Proposed <strong>Budget</strong> and <strong>Financial</strong> Plan<strong>Office</strong> <strong>of</strong> <strong>the</strong> Attorney General for <strong>the</strong> District <strong>of</strong> ColumbiaA-197
FY 2013 Proposed Operating <strong>Budget</strong>, by Comptroller Source GroupTable CB0-3 contains <strong>the</strong> proposed FY 2013 budget at <strong>the</strong> Comptroller Source Group (object class) level comparedto <strong>the</strong> FY 2012 approved budget. It also provides FY 2010 and FY 2011 actual expenditures.Table CB0-3(dollars in thousands)ChangeActual Actual Approved Proposed from PercentController Source Group FY 2010 FY 2011 FY 2012 FY 2013 FY 2012 Change*11 - Regular Pay - Continuing Full Time 51,497 48,905 51,957 52,650 693 1.312 - Regular Pay - O<strong>the</strong>r 9,264 9,445 10,737 10,428 -309 -2.913 - Additional Gross Pay 539 518 143 143 0 0.014 - Fringe Benefits - Current Personnel 11,387 11,060 12,531 13,680 1,148 9.215 - Overtime Pay 22 2 0 0 0 N/ASubtotal Personal Services (PS) 72,708 69,929 75,367 76,900 1,533 2.020 - Supplies and Materials 336 223 420 426 6 1.430 - Energy, Comm. and Building Rentals 751 1,294 730 934 204 27.931 - Telephone, Telegraph, Telegram, Etc. 354 342 350 376 26 7.532 - Rentals - Land and Structures 559 567 588 0 -588 -100.033 - Janitorial Services 373 308 397 0 -397 -100.034 - Security Services 302 319 308 392 84 27.435 - Occupancy Fixed Costs 486 389 209 1,130 922 441.340 - O<strong>the</strong>r Services and Charges 1,871 1,649 2,802 2,833 31 1.141 - Contractual Services - O<strong>the</strong>r 13,002 9,609 11,540 11,833 293 2.550 - Subsidies and Transfers 1,537 686 1,475 1,475 0 0.070 - Equipment and Equipment Rental 338 117 346 351 5 1.591 - Expense Not <strong>Budget</strong>ed O<strong>the</strong>rs 0 64 0 0 0 N/ASubtotal Nonpersonal Services (NPS) 19,908 15,567 19,164 19,750 586 3.1Gross Funds 92,616 85,497 94,532 96,650 2,119 2.2*Percent change is based on whole dollars.Division DescriptionThe <strong>Office</strong> <strong>of</strong> <strong>the</strong> Attorney General operates through <strong>the</strong> following 13 divisions:Solicitor General – manages <strong>the</strong> District’s civil and criminal appellate litigation and practices most frequently before<strong>the</strong> District <strong>of</strong> Columbia Court <strong>of</strong> Appeals, <strong>the</strong> United States Court <strong>of</strong> Appeals for <strong>the</strong> District <strong>of</strong> ColumbiaCircuit, and <strong>the</strong> Supreme Court <strong>of</strong> <strong>the</strong> United States. The docket includes appeals in a wide variety <strong>of</strong> civil, family,criminal, juvenile, tax, and administrative cases from trial courts and petitions for review from District agencies.This division contains <strong>the</strong> following 3 activities:■ Civil and Administrative Appeals - provides appellate services in a wide variety <strong>of</strong> civil and administrative cases;■ Criminal and Juvenile Appeals - provides appellate services in criminal and juvenile cases; and■ <strong>Office</strong> <strong>of</strong> <strong>the</strong> Division Deputy - provides supervision <strong>of</strong>, and support to, divisional activities.<strong>Office</strong> <strong>of</strong> <strong>the</strong> Attorney General for <strong>the</strong> District <strong>of</strong> ColumbiaA-198FY 2013 Proposed <strong>Budget</strong> and <strong>Financial</strong> Plan
Child Support Services – authorized under Title IV-D <strong>of</strong> <strong>the</strong> Social Security Act, this division provides child supportservices to citizens <strong>of</strong> <strong>the</strong> District to enhance <strong>the</strong> lives <strong>of</strong> all District children by establishing support orders,enforcing <strong>the</strong>m when necessary, and collecting and distributing <strong>the</strong> amounts collected to <strong>the</strong> custodial parents and<strong>the</strong> children.This division contains <strong>the</strong> following 3 activities:■ Child Support Enforcement Division (CSED) Establishment – provides intake interview and investigatoryservices to custodial parents so that <strong>the</strong>y can establish paternity, child support, and medical support orders;■ CSED Enforcement – provides support order enforcement services to custodial parents and o<strong>the</strong>r legal payeesso that <strong>the</strong>y can receive support due under child support orders; and■ Administration Customer Service – provides support and supervision services to <strong>the</strong> Child Support Servicesdivision to enable <strong>the</strong>m to meet <strong>the</strong>ir goals.Civil Litigation – provides representation for <strong>the</strong> District <strong>of</strong> Columbia, its agencies, and employees in civil lawsuits,both jury and non-jury, filed in federal and local courts. Its cases range from simple slip-and fall and auto accidentclaims to extremely serious lawsuits, such as medical malpractice resulting in quadriplegia and brain damage. Thisdivision handles constitutional challenges to government actions; civil rights actions under 42 U.S.C. § 1983 arisingfrom alleged police misconduct, as well as related common law claims <strong>of</strong> false arrest and excessive force; andcivil rights cases brought by employees and o<strong>the</strong>rs under Title VII <strong>of</strong> <strong>the</strong> 1964 Civil Rights Act (as amended), <strong>the</strong>Americans with Disabilities Act, and o<strong>the</strong>r federal and local anti-discrimination laws. This division also focuses on<strong>the</strong> <strong>of</strong>fice’s efforts to use affirmative civil litigation to advance <strong>the</strong> public interest. It prosecutes judicial and administrativelitigation in areas <strong>of</strong> vital importance to <strong>the</strong> District’s citizenry, including consumer protection, antitrustenforcement, environmental protection, and licensing <strong>of</strong> businesses and pr<strong>of</strong>essionals.This division contains <strong>the</strong> following 6 activities:■ General Litigation Sections – provides litigation avoidance, representation, and advice services to <strong>the</strong> Districtgovernment, its agencies, and employees so that liability exposure can be managed and reduced in <strong>the</strong> numerouscivil actions filed against <strong>the</strong> District and its employees every year;■ Taxicab <strong>Agency</strong> Counsel - provides in-house legal advice on all District <strong>of</strong> Columbia taxicab legal issues, includingenforcement actions and cases before <strong>the</strong> <strong>Office</strong> <strong>of</strong> Administrative Hearings; personnel and labor relations;information and privacy (pursuant to <strong>the</strong> Freedom <strong>of</strong> Information Act); drafting legislation and rulemaking;and a range <strong>of</strong> o<strong>the</strong>r issues;■ Insurance <strong>Agency</strong> Counsel - provides comprehensive legal support to <strong>the</strong> Department <strong>of</strong> Insurance, Securitiesand Banking (DISB), whose mission is to provide fair and effective regulation for financial service industries in<strong>the</strong> District <strong>of</strong> Columbia while also protecting consumers and maintaining a vibrant financial service marketin <strong>the</strong> District;■ Alcoholic Beverage Regulatory Counsel – provides legal services to <strong>the</strong> Alcoholic Beverage RegulationAdministration;■ <strong>Office</strong> <strong>of</strong> <strong>the</strong> Division Deputy – provides supervision <strong>of</strong>, and support to, divisional activities; and■ Child and Family Services – provides legal advice and assistance to <strong>the</strong> Child and Family Services <strong>Agency</strong>.Commercial – provides legal services and advice for numerous core governmental functions, from <strong>the</strong> procurement<strong>of</strong> essential goods and services and acquisition <strong>of</strong> real estate through support <strong>of</strong> economic development efforts andgovernment property management, to <strong>the</strong> financing <strong>of</strong> government operations through bonds and collection <strong>of</strong>taxes.This division contains <strong>the</strong> following 17 activities:■ Land Use – provides legal assistance to District agencies with respect to land use planning, zoning, historicpreservation, transportation, motor vehicle regulation, and <strong>the</strong> use <strong>of</strong> public space;FY 2013 Proposed <strong>Budget</strong> and <strong>Financial</strong> Plan<strong>Office</strong> <strong>of</strong> <strong>the</strong> Attorney General for <strong>the</strong> District <strong>of</strong> ColumbiaA-199
■■■■■■■■■■■■■■■■Economic Development – provides legal advice, legal opinions, and preparation and review <strong>of</strong> transactionaldocuments for <strong>the</strong> District government, including <strong>the</strong> Department <strong>of</strong> Housing and CommunityDevelopment, for compliance with federal regulatory requirements for expenditure <strong>of</strong> federal funding;Procurement – provides legal services, including legal review and advice to <strong>the</strong> District government and its contracting<strong>of</strong>ficials, so that it can enter into legally defensible contracts;Real Estate – provides legal advice, legal opinions, preparation and review <strong>of</strong> transactional documents, and realestate litigation services to <strong>the</strong> District government;Transportation – provides legal services to <strong>the</strong> Department <strong>of</strong> Transportation;Motor Vehicles – provides legal services to <strong>the</strong> Department <strong>of</strong> Motor Vehicles;Public Works – provides legal advice and support to <strong>the</strong> Department <strong>of</strong> Public Works;Cable Television and Telecommunications – provides legal services to <strong>the</strong> <strong>Office</strong> <strong>of</strong> Cable Television andTelecommunications;Contracting and Procurement – provides legal services to <strong>the</strong> <strong>Office</strong> <strong>of</strong> Contracting and Procurement;Technology -– provides legal assistance to <strong>the</strong> <strong>Office</strong> <strong>of</strong> <strong>the</strong> <strong>Chief</strong> Technology <strong>Office</strong>r;Parks and Recreation – provides legal services to <strong>the</strong> Department <strong>of</strong> Parks and Recreation;Small and Local Business Development <strong>Agency</strong> Counsel – provides legal services to <strong>the</strong> Department <strong>of</strong> Smalland Local Business Development;<strong>Office</strong> <strong>of</strong> Public Education Facilities Modernization <strong>Agency</strong> Counsel – provides legal services to <strong>the</strong> schoolsconstruction program within Department <strong>of</strong> General Services;Tax and Finance – provides tax litigation and bond preparation legal services to <strong>the</strong> District government so thatit can obtain better financial documents and can recover funds owed from taxes;Land Acquisition and Bankruptcy – provides land acquisition and bankruptcy legal services to <strong>the</strong> District governmentso that it can recover funds owed from bankruptcy proceedings;<strong>Office</strong> <strong>of</strong> <strong>the</strong> Division Deputy – provides supervision <strong>of</strong>, and support to, divisional activities; andDepartment <strong>of</strong> General Services – provides legal services and advice for Department <strong>of</strong> General Services for<strong>the</strong> procurement <strong>of</strong> essential goods and services and acquisition <strong>of</strong> real estate.Family Services – works on behalf <strong>of</strong> <strong>the</strong> District’s most vulnerable citizens, including abused and neglected children,domestic violence victims, and incapacitated adults who are being abused or who are self-neglecting.This division contains <strong>the</strong> following 4 activities:■ Child Protection – provides services to children at risk for abuse and neglect by <strong>the</strong>ir caretakers in <strong>the</strong> District<strong>of</strong> Columbia, to reduce <strong>the</strong>ir risk <strong>of</strong> harm and protect <strong>the</strong>ir rights;■ Domestic Violence Prosecution – provides services to domestic violence victims in <strong>the</strong> District <strong>of</strong> Columbiato reduce <strong>the</strong>ir risk <strong>of</strong> harm and protect <strong>the</strong>ir rights, <strong>the</strong>reby enhancing <strong>the</strong>ir quality <strong>of</strong> life;■ <strong>Office</strong> <strong>of</strong> <strong>the</strong> Division Deputy – provides supervision <strong>of</strong>, and support to, divisional activities; and■ Mental Health – provides representation to <strong>the</strong> Department <strong>of</strong> Mental Health (DMH) and <strong>the</strong> Departmenton Disability Services (DDS) in litigating cases in Family Court. Attorneys in <strong>the</strong> Mental Health Section representDMH in all parts <strong>of</strong> <strong>the</strong> civil commitment process and represent DDS at admission hearings, commissionhearings, annual reviews, and guardianship hearings.Public Interest Division – is a new division created to group toge<strong>the</strong>r <strong>the</strong> functions that concern complex and publicinterest litigation.This division contains <strong>the</strong> following 11 activities:■ Equity Litigation – defends <strong>the</strong> District government in complex equity actions seeking temporary, preliminary,and permanent injunctive relief that may impact <strong>the</strong> operations <strong>of</strong> an agency’s program;■ Civil Enforcement – provides enforcement, protection, representation, and advisory services to <strong>the</strong> District governmentand residents so that <strong>the</strong>y can enjoy reduced risk <strong>of</strong> harm, protection <strong>of</strong> rights, and monetary recovery;<strong>Office</strong> <strong>of</strong> <strong>the</strong> Attorney General for <strong>the</strong> District <strong>of</strong> ColumbiaA-200FY 2013 Proposed <strong>Budget</strong> and <strong>Financial</strong> Plan
■■■■■■■■■Public Advocacy – investigates and prosecutes violations <strong>of</strong> consumer protection and antitrust laws, receivesand responds to consumer complaints against merchants, and represents <strong>the</strong> public interest in <strong>the</strong> protection<strong>of</strong> charitable organizations and assets;Consumer and Regulatory Affairs <strong>Agency</strong> Counsel – provides legal advice and assistance to <strong>the</strong> Department<strong>of</strong> Consumer and Regulatory Affairs;Environment <strong>Agency</strong> Counsel – provides legal advice to <strong>the</strong> District Department <strong>of</strong> <strong>the</strong> Environment(DDOE) to enable it to carry out its functions in accordance with District and federal law, and to assist DDOEwith enforcement <strong>of</strong>, and ensuring compliance with, District <strong>of</strong> Columbia and federal environmental law andregulations;Youth Rehabilitative Services – provides legal advice and assistance to <strong>the</strong> Department <strong>of</strong> Youth andRehabilitative Services;Department <strong>of</strong> Mental Health <strong>Agency</strong> Counsel – provides legal advice to <strong>the</strong> Department <strong>of</strong> Mental Healthregarding all facets <strong>of</strong> <strong>the</strong> agency’s operations and policies;Department on Disability Services <strong>Agency</strong> Counsel – provides legal advice and assistance to <strong>the</strong> Departmenton Disability Services;<strong>Office</strong> <strong>of</strong> State Superintendent <strong>of</strong> Education <strong>Agency</strong> Counsel – provides legal advice to <strong>the</strong> <strong>Office</strong> <strong>of</strong> <strong>the</strong> StateSuperintendent <strong>of</strong> Education;D.C. Public Schools <strong>Agency</strong> Counsel – provides legal advice and assistance to <strong>the</strong> District <strong>of</strong> Columbia PublicSchools; and<strong>Office</strong> <strong>of</strong> <strong>the</strong> Division Deputy – provides supervision <strong>of</strong>, and support to, divisional activities.Legal Counsel – provides legal research and advice to <strong>the</strong> Executive <strong>Office</strong> <strong>of</strong> <strong>the</strong> Mayor (EOM), <strong>the</strong> AttorneyGeneral, department and agency heads, and occasionally, <strong>the</strong> Council <strong>of</strong> <strong>the</strong> District <strong>of</strong> Columbia; and draftsstatutes and regulations for <strong>the</strong> EOM and <strong>the</strong> agencies.This division contains <strong>the</strong> following 4 activities:■ Legal Advice – provides legal guidance, counseling, and legal sufficiency certification services to <strong>the</strong> Districtgovernment and its employees so that <strong>the</strong>y can legally and efficiently accomplish <strong>the</strong> District government’s missionwhile minimizing risk <strong>of</strong> adverse legal consequences;■ Rulemaking – provides for <strong>the</strong> review and certification <strong>of</strong> rulemaking, legislation monitoring, management,and training in <strong>the</strong> areas <strong>of</strong> administrative and regulatory law and procedure;■ <strong>Office</strong> <strong>of</strong> <strong>the</strong> Division Deputy – provides supervision <strong>of</strong>, and support to, divisional activities; and■ Health Care Finance <strong>Agency</strong> Counsel – provides legal advice and assistance to <strong>the</strong> Department <strong>of</strong> Health CareFinance.Public Safety – prosecutes juveniles charged with law violations. The division is also responsible for <strong>the</strong> prosecution<strong>of</strong> misdemeanor criminal charges within <strong>the</strong> jurisdiction <strong>of</strong> <strong>the</strong> <strong>Office</strong> <strong>of</strong> <strong>the</strong> Attorney General. The divisionalso protects neighborhoods by prosecuting nuisance property <strong>of</strong>fenses, and it assists victims <strong>of</strong> crimes.This division contains <strong>the</strong> following 8 activities:■ Criminal Section – provides prosecution services, consultation, and o<strong>the</strong>r legal representation services to <strong>the</strong>District government to enhance <strong>the</strong> safety <strong>of</strong> <strong>the</strong> residents <strong>of</strong> <strong>the</strong> District <strong>of</strong> Columbia through <strong>the</strong> appropriateresolution <strong>of</strong> cases;■ Juvenile Section – provides prosecution services <strong>of</strong> juvenile matters, consultation, and o<strong>the</strong>r legal representationservices to <strong>the</strong> District government to enhance <strong>the</strong> safety <strong>of</strong> <strong>the</strong> residents <strong>of</strong> <strong>the</strong> District <strong>of</strong> Columbiathrough <strong>the</strong> appropriate resolution <strong>of</strong> cases;■ Neighborhood and Victims’ Services – provides services to <strong>the</strong> Neighborhood Services Initiative and victims<strong>of</strong> crime in <strong>the</strong> District <strong>of</strong> Columbia so that <strong>the</strong>y can enjoy reduced risk <strong>of</strong> harm and <strong>the</strong> protection <strong>of</strong> <strong>the</strong>irrights, and necessary services, <strong>the</strong>reby enhancing <strong>the</strong> achievement <strong>of</strong> program goals and <strong>the</strong> residents’ quality <strong>of</strong>life;FY 2013 Proposed <strong>Budget</strong> and <strong>Financial</strong> Plan<strong>Office</strong> <strong>of</strong> <strong>the</strong> Attorney General for <strong>the</strong> District <strong>of</strong> ColumbiaA-201
■■■■■Fire and Emergency Medical – provides legal services to Fire and Emergency Medical Services;Police Enforcement – provides legal services to <strong>the</strong> Metropolitan Police Department;Medical Examiner – provides legal services to <strong>the</strong> <strong>Office</strong> <strong>of</strong> <strong>the</strong> <strong>Chief</strong> Medical Examiner;Department <strong>of</strong> Corrections <strong>Agency</strong> Counsel - provides legal services to <strong>the</strong> Department <strong>of</strong> Corrections; and<strong>Office</strong> <strong>of</strong> <strong>the</strong> Division Deputy – provides supervision <strong>of</strong>, and support to, divisional activities.Personnel, Labor and Employment – defends agencies in personnel-related matters such as suspensions, terminationsfor employee misconduct, and reductions-in-force; provides training and pr<strong>of</strong>essional development for allOAG employees in order to more effectively fulfill its mission; hires and maintains excellent and diverse staffthrough on-campus interviews, interviews at job fairs, and traditional acceptance <strong>of</strong> applications; ensures fairnessand diversity in <strong>the</strong> workplace; processes all grievances discipline; and serves as OAG’s chief negotiator on collectivebargaining issues for <strong>the</strong> attorney union.This division contains <strong>the</strong> following 4 activities:■ Personnel and Labor Litigation - provides litigation representation and advice services to <strong>the</strong> District governmentagencies so that <strong>the</strong>y can manage and reduce liability exposure with respect to personnel decisions and tominimize fiscal and programmatic impact;■ Human Resources <strong>Agency</strong> Counsel - provides comprehensive human resource management services to <strong>the</strong>Department <strong>of</strong> Human Resources and subordinate agencies in support <strong>of</strong> <strong>the</strong> District government personnelinitiatives to streng<strong>the</strong>n individual and organizational performances and enable <strong>the</strong> District government toattract, develop, and retain a highly qualified and diverse workforce;■ Human Rights <strong>Agency</strong> Counsel – investigates, adjudicates, and issues decisions in response to complaints <strong>of</strong>discrimination in employment, public accommodation, housing, and education; and prepares appropriate regulationsinterpreting and implementing <strong>the</strong> District’s Human Rights Act; and■ <strong>Office</strong> <strong>of</strong> <strong>the</strong> Division Deputy – provides supervision <strong>of</strong>, and support to, divisional activities, and processes allgrievances and unfair labor practice charges brought by <strong>the</strong> attorneys’ union.<strong>Office</strong> <strong>of</strong> <strong>the</strong> Attorney General – provides overall supervision and guidance to <strong>the</strong> entire <strong>of</strong>fice, including <strong>the</strong> legalservices provided through <strong>the</strong> General Counsels to <strong>the</strong> various subordinate agencies.This division contains <strong>the</strong> following 4 activities:■ Human Services Counsel – provides legal services to <strong>the</strong> Department <strong>of</strong> Human Services;■ Health Services – provides legal advice and representation to <strong>the</strong> Department <strong>of</strong> Health on health law issues;■ Employment Services <strong>Agency</strong> Counsel – provides legal services to <strong>the</strong> Department <strong>of</strong> Employment Services;and■ Immediate <strong>Office</strong> – provides overall supervision and guidance to <strong>the</strong> entire <strong>of</strong>fice, including <strong>the</strong> legal servicesprovided through <strong>the</strong> General Counsels to <strong>the</strong> various subordinate agencies.Support Services – provides for administrative support in <strong>the</strong> agency including investigative services.This division contains <strong>the</strong> following 2 activities:■ Support Services and Operations – provides administrative support not included in <strong>the</strong> <strong>Agency</strong> Managementprogram, including procurement; and■ Investigations – provides investigation support for <strong>the</strong> <strong>of</strong>fice including child protection matters.<strong>Office</strong> <strong>of</strong> <strong>the</strong> Attorney General for <strong>the</strong> District <strong>of</strong> ColumbiaA-202FY 2013 Proposed <strong>Budget</strong> and <strong>Financial</strong> Plan
<strong>Agency</strong> Management – provides for administrative support and <strong>the</strong> required tools to achieve operational and programmaticresults. This division is standard for all agencies using performance-based budgeting.<strong>Agency</strong> <strong>Financial</strong> Operations – provides comprehensive and efficient financial management services to, and onbehalf <strong>of</strong>, District agencies so that <strong>the</strong> financial integrity <strong>of</strong> <strong>the</strong> District <strong>of</strong> Columbia is maintained. This divisionis standard for all agencies using performance-based budgeting.Division Structure ChangeThe <strong>Office</strong> <strong>of</strong> <strong>the</strong> Attorney General has one division structure change in <strong>the</strong> FY 2013 proposed budget; <strong>the</strong> formerHealth and Human Services Division is replaced by <strong>the</strong> Public Interest Division, and certain activities are movedto o<strong>the</strong>r divisions.FY 2013 Proposed Operating <strong>Budget</strong> and FTEs, by Division and ActivityTable CB0-4 contains <strong>the</strong> proposed FY 2013 budget by division and activity compared to <strong>the</strong> FY 2012 approved budget.It also provides <strong>the</strong> FY 2011 actual data.Table CB0-4(dollars in thousands)Dollars in ThousandsFull-Time EquivalentsChangeChangeActual Approved Proposed from Actual Approved Proposed fromProgram/Activity FY 2011 FY 2012 FY 2013 FY 2012 FY 2011 FY 2012 FY 2013 FY 2012(1000) <strong>Agency</strong> Management(1010) AMP Personnel 337 376 371 -5 4.9 4.0 4.0 0.0(1015) AMP Training and Employee Development 133 450 495 45 2.0 2.0 2.0 0.0(1030) AMP Property Management 2,594 2,122 2,443 321 0.0 0.0 0.0 0.0(1040) AMP IT 1,400 1,570 1,679 109 5.9 6.0 6.0 0.0Subtotal (1000) <strong>Agency</strong> Management 4,465 4,518 4,987 469 12.8 12.0 12.0 0.0(100F) <strong>Agency</strong> <strong>Financial</strong> Operations(110F) <strong>Budget</strong> Operations 130 132 138 6 1.0 1.0 1.0 0.0(120F) Accounting Operations 750 770 792 22 6.8 7.0 7.0 0.0Subtotal (100F) <strong>Agency</strong> <strong>Financial</strong> Operations 880 901 929 28 7.8 8.0 8.0 0.0(1200) Personnel Labor and Employment Division(1201) Personnel and Labor Litigation Activity 1,704 1,511 1,639 127 12.8 13.0 14.0 1.0(1202) Human Resources <strong>Agency</strong> Counsel 576 518 521 3 3.9 4.0 4.0 0.0(1203) Human Rights <strong>Agency</strong> Counsel 281 266 272 6 2.0 2.0 2.0 0.0(1204) <strong>Office</strong> <strong>of</strong> Division Deputy 337 579 591 12 3.9 5.0 5.0 0.0Subtotal (1200) Personnel Labor and Employment Div. 2,898 2,875 3,024 149 22.6 24.0 25.0 1.0(2100) Commercial Division(2101) Land Use 644 695 608 -87 4.7 4.8 4.0 -0.8(Continued on next page)FY 2013 Proposed <strong>Budget</strong> and <strong>Financial</strong> Plan<strong>Office</strong> <strong>of</strong> <strong>the</strong> Attorney General for <strong>the</strong> District <strong>of</strong> ColumbiaA-203
Table CB0-4 (Continued)(dollars in thousands)Dollars in ThousandsFull-Time EquivalentsChangeChangeActual Approved Proposed from Actual Approved Proposed fromProgram/Activity FY 2011 FY 2012 FY 2013 FY 2012 FY 2011 FY 2012 FY 2013 FY 2012(2102) Economic Development 1,272 1,496 1,650 154 8.8 13.0 13.0 0.0(2103) Procurement 540 528 683 155 3.8 3.4 4.9 1.5(2104) Real Estate 273 292 299 6 5.9 2.0 2.0 0.0(2105) Tax, Bankruptcy and Finance 5 0 0 0 0.0 0.0 0.0 0.0(2106) Transportation 1,154 1,173 1,180 7 9.8 9.0 9.0 0.0(2107) Motor Vehicles 196 253 243 -10 2.0 2.0 2.0 0.0(2108) Public Works 480 503 511 9 3.9 4.0 4.0 0.0(2109) Cable Television and Telecommunications 386 477 353 -124 3.9 4.0 3.0 -1.0(2110) Contracting and Procurement 444 468 478 10 3.0 3.0 3.0 0.0(2111) Technology 179 193 196 3 1.0 1.0 1.0 0.0(2112) Parks and Recreation 258 250 242 -9 2.0 2.0 2.0 0.0(2114) Small, Local, Business Development Counsel 142 146 148 2 0.0 1.0 1.0 0.0(2115) Property Management <strong>Agency</strong> Counsel 429 544 0 -544 4.9 4.0 0.0 -4.0(2116) <strong>Office</strong> <strong>of</strong> Facilities Modernization Counsel 221 399 298 -100 2.0 3.0 2.0 -1.0(2117) Tax and Finance 800 890 882 -7 6.7 7.3 7.3 0.0(2118) Land Acquisition and Bankruptcy 529 530 390 -141 4.7 3.8 2.8 -1.0(2119) <strong>Office</strong> <strong>of</strong> Division Deputy 276 347 353 5 2.0 2.0 2.0 0.0(2120) Department <strong>of</strong> General Services <strong>Agency</strong> Counsel 0 0 442 442 0.0 0.0 3.0 3.0Subtotal (2100) Commercial Division 8,230 9,186 8,956 -229 69.1 69.2 66.0 -3.2(3100) Legal Counsel Division(3101) Legal Advice 1,644 1,515 1,586 71 13.4 11.6 11.6 0.0(3102) Rulemaking 159 165 168 2 1.0 1.0 1.0 0.0(3103) <strong>Office</strong> <strong>of</strong> Division Deputy 230 174 177 3 1.0 1.0 1.0 0.0(3104) Health Care Finance <strong>Agency</strong> Counsel 0 0 492 492 0.0 0.0 4.0 4.0Subtotal (3100) Legal Counsel Division 2,033 1,855 2,423 568 15.3 13.6 17.6 4.0(4000) Child Support Services Division(4001) CSED Establishment 5,902 7,504 7,485 -19 60.6 66.3 65.0 -1.3(4002) CSED Enforcement 9,308 10,736 10,969 233 71.4 69.0 70.0 1.0(4103) Administration Customer Service 10,464 10,917 11,401 483 63.4 64.7 72.0 7.3Subtotal (4000) Child Support Services Division 25,674 29,157 29,854 697 195.4 200.0 207.0 7.0(5100) Civil Litigation Division(5101) General Litigation Sections 4,529 5,795 5,769 -25 43.2 47.8 48.0 0.2(5102) Equity Litigation 1 2,366 2,083 0 -2,083 16.7 15.0 0.0 -15.0(5103) Equity Litigation 11 637 0 0 0 5.9 0.0 0.0 0.0(5106) Civil Enforcement 1,461 1,541 0 -1,541 12.5 13.0 0.0 -13.0(Continued on next page)<strong>Office</strong> <strong>of</strong> <strong>the</strong> Attorney General for <strong>the</strong> District <strong>of</strong> ColumbiaA-204FY 2013 Proposed <strong>Budget</strong> and <strong>Financial</strong> Plan
Table CB0-4 (Continued)(dollars in thousands)Dollars in ThousandsFull-Time EquivalentsChangeChangeActual Approved Proposed from Actual Approved Proposed fromProgram/Activity FY 2011 FY 2012 FY 2013 FY 2012 FY 2011 FY 2012 FY 2013 FY 2012(5107) Public Advocacy 1,258 1,359 0 -1,359 10.6 11.0 0.0 -11.0(5108) Consumer and Regulatory Affairs <strong>Agency</strong> Counsel 1,028 1,200 0 -1,200 10.7 11.0 0.0 -11.0(5109) Taxicab <strong>Agency</strong> Counsel 180 174 176 3 1.0 1.0 1.0 0.0(5110) Environment <strong>Agency</strong> Counsel 1,232 1,666 0 -1,666 11.8 14.0 0.0 -14.0(5111) Insurance <strong>Agency</strong> Counsel 1,087 1,258 1,283 26 9.8 10.0 10.0 0.0(5112) Alcoholic Beverage Regulatory Counsel 303 318 337 19 3.0 3.0 3.0 0.0(5113) <strong>Office</strong> <strong>of</strong> Division Deputy 328 432 445 14 3.9 4.0 4.0 0.0(5114) Child and Family Services <strong>Agency</strong> Counsel 0 0 1,096 1,096 0.0 0.0 9.0 9.0Subtotal (5100) Civil Litigation Division 14,408 15,826 9,108 -6,718 129.1 129.8 75.0 -54.8(5200) Public Interest Division(5201) Equity Division 0 0 2,185 2,185 0.0 0.0 17.0 17.0(5202) Civil Enforcement 0 0 1,568 1,568 0.0 0.0 13.0 13.0(5203) Public Advocacy 0 0 1,418 1,418 0.0 0.0 11.0 11.0(5204) Consumer and Regulatory Affairs <strong>Agency</strong> Counsel 0 0 1,015 1,015 0.0 0.0 9.0 9.0(5205) Environment <strong>Agency</strong> Counsel 0 0 1,641 1,641 0.0 0.0 13.2 13.2(5206) Youth Rehabilitative Services Counsel 0 0 368 368 0.0 0.0 3.0 3.0(5207) Department <strong>of</strong> Mental Health <strong>Agency</strong> Counsel 0 0 616 616 0.0 0.0 4.5 4.5(5208) Disability Services <strong>Agency</strong> Counsel 0 0 1,064 1,064 0.0 0.0 9.0 9.0(5209) OSSE <strong>Agency</strong> Counsel 0 0 1,241 1,241 0.0 0.0 8.0 8.0(5210) D.C. Public Schools <strong>Agency</strong> Counsel 0 0 2,525 2,525 0.0 0.0 23.0 23.0(5211) <strong>Office</strong> <strong>of</strong> <strong>the</strong> Division Deputy 0 0 187 187 0.0 0.0 1.0 1.0Subtotal (5200) Public Interest Division 0 0 13,828 13,828 0.0 0.0 111.8 111.8(6100) Public Safety Division(6101) Criminal Section 2,569 2,284 2,386 102 26.3 26.0 25.0 -1.0(6102) Juvenile Section 3,006 3,148 3,325 176 29.5 31.0 32.0 1.0(6103) Consumer and Trade Protection 13 0 0 0 0.0 0.0 0.0 0.0(6104) Neighborhood and Victims' Services 894 1,130 1,170 39 10.3 11.0 11.0 0.0(6105) Civil Enforcement 4 0 0 0 0.0 0.0 0.0 0.0(6106) Consumer and Regulatory Affairs 0 0 0 0 0.0 0.0 0.0 0.0(6107) Fire and Emergency Medical 404 343 446 103 2.0 2.0 3.0 1.0(6108) Police Enforcement 1,254 1,116 1,232 117 7.9 8.0 9.0 1.0(6109) Medical Examiner 128 132 134 2 1.0 1.0 1.0 0.0(6112) Department <strong>of</strong> Corrections <strong>Agency</strong> Counsel 398 330 328 -1 3.0 3.0 3.0 0.0(6113) <strong>Office</strong> <strong>of</strong> Division Deputy 414 564 586 22 4.9 5.0 5.0 0.0Subtotal (6100) Public Safety Division 9,085 9,047 9,607 560 84.8 87.0 89.0 2.0(Continued on next page)FY 2013 Proposed <strong>Budget</strong> and <strong>Financial</strong> Plan<strong>Office</strong> <strong>of</strong> <strong>the</strong> Attorney General for <strong>the</strong> District <strong>of</strong> ColumbiaA-205
Table CB0-4 (Continued)(dollars in thousands)Dollars in ThousandsFull-Time EquivalentsChangeChangeActual Approved Proposed from Actual Approved Proposed fromProgram/Activity FY 2011 FY 2012 FY 2013 FY 2012 FY 2011 FY 2012 FY 2013 FY 2012(7000) Solicitor General Division(7001) Civil and Administrative Appeals 1,341 1,462 1,488 26 9.6 11.0 11.0 0.0(7002) Criminal and Juvenile Appeals 480 567 411 -156 3.9 4.0 3.0 -1.0(7003) <strong>Office</strong> <strong>of</strong> Division Deputy 138 156 159 2 1.0 1.0 1.0 0.0Subtotal (7000) Solicitor General Division 1,959 2,185 2,057 -128 14.5 16.0 15.0 -1.0(7100) Appellate Program(7101) Affirmative Appellate 9 0 0 0 0.0 0.0 0.0 0.0Subtotal (7100) Appellate Program 9 0 0 0 0.0 0.0 0.0 0.0(7200) Health and Human Services Division(7201) Human Services Counsel 1,146 1,573 0 -1,573 10.8 16.0 0.0 -16.0(7202) Child and Family Services 841 1,066 0 -1,066 7.9 9.0 0.0 -9.0(7203) Mental Health 594 577 0 -577 6.9 5.0 0.0 -5.0(7204) Health Services 1,062 1,554 0 -1,554 10.6 11.0 0.0 -11.0(7205) Youth Rehabilitative Services 245 376 0 -376 3.0 3.0 0.0 -3.0(7207) Department <strong>of</strong> Mental Health <strong>Agency</strong> Counsel 608 697 0 -697 4.9 5.0 0.0 -5.0(7208) Employment Services <strong>Agency</strong> Counsel 336 384 0 -384 3.0 3.0 0.0 -3.0(7209) Department on Disability Services <strong>Agency</strong> Counsel 1,013 1,057 0 -1,057 7.9 9.0 0.0 -9.0(7210) OSSE <strong>Agency</strong> Counsel -398 1,117 0 -1,117 7.9 8.0 0.0 -8.0(7211) D.C. Public Schools <strong>Agency</strong> Counsel 2,395 2,327 0 -2,327 25.6 21.0 0.0 -21.0(7212) Health Care Finance <strong>Agency</strong> Counsel 404 508 0 -508 3.9 4.0 0.0 -4.0(7213) <strong>Office</strong> <strong>of</strong> Division Deputy 137 173 0 -173 1.0 1.0 0.0 -1.0Subtotal (7200) Health and Human Services Division 8,384 11,408 0 -11,408 93.3 95.0 0.0 -95.0(8100) Family Services Division(8101) Child Protection 3,747 3,441 3,644 203 37.0 31.6 32.0 0.4(8102) Mental Health Prosecution 35 0 0 0 0.0 0.0 0.0 0.0(8103) Domestic Violence Prosecution 399 726 732 6 6.9 7.5 7.5 0.0(8104) <strong>Office</strong> <strong>of</strong> Division Deputy 115 515 465 -49 1.0 4.4 5.0 0.6(8105) Mental Health 0 0 656 656 0.0 0.0 6.0 6.0Subtotal (8100) Family Services Division 4,296 4,681 5,496 815 44.9 43.5 50.5 7.0(9100) Policy and Operations Oversight Program(9101) Policy Management 561 0 0 0 0.0 0.0 0.0 0.0(9102) Investigations 93 0 0 0 0.0 0.0 0.0 0.0Subtotal (9100) Policy and Operations Oversight Program 655 0 0 0 0.0 0.0 0.0 0.0(9200) Support Services Division(9201) Support Services and Operations 985 1,126 1,121 -5 15.8 15.6 15.5 -0.1(9202) Investigations 958 962 978 17 10.8 10.0 10.0 0.0Subtotal (9200) Support Services Division 1,943 2,087 2,099 12 26.6 25.6 25.5 -0.1(Continued on next page)<strong>Office</strong> <strong>of</strong> <strong>the</strong> Attorney General for <strong>the</strong> District <strong>of</strong> ColumbiaA-206FY 2013 Proposed <strong>Budget</strong> and <strong>Financial</strong> Plan
Table CB0-4 (Continued)(dollars in thousands)Dollars in ThousandsFull-Time EquivalentsChangeChangeActual Approved Proposed from Actual Approved Proposed fromProgram/Activity FY 2011 FY 2012 FY 2013 FY 2012 FY 2011 FY 2012 FY 2013 FY 2012(9300) <strong>Office</strong> <strong>of</strong> <strong>the</strong> Attorney General(9301) Immediate <strong>Office</strong> 579 805 1,163 357 4.9 5.0 7.5 2.5(9302) Human Services Counsel 0 0 1,133 1,133 0.0 0.0 9.0 9.0(9303) Health Counsel 0 0 1,574 1,574 0.0 0.0 11.0 11.0(9304) Employment Services <strong>Agency</strong> Counsel 0 0 412 412 0.0 0.0 3.0 3.0Subtotal (9300) <strong>Office</strong> <strong>of</strong> <strong>the</strong> Attorney General 579 805 4,281 3,476 4.9 5.0 30.5 25.5Total Proposed Operating <strong>Budget</strong> 85,497 94,532 96,650 2,119 721.1 728.7 732.8 4.1(Change is calculated by whole numbers and numbers may not add due to rounding.)Note: For more detailed information regarding <strong>the</strong> proposed funding for <strong>the</strong> activities within this agency’s Divisions, please see Schedule30-PBB Program Summary by Activity in <strong>the</strong> FY 2013 Operating Appendices located on <strong>the</strong> <strong>Office</strong> <strong>of</strong> <strong>the</strong> <strong>Chief</strong> <strong>Financial</strong> <strong>Office</strong>r’swebsite.FY 2013 Proposed <strong>Budget</strong> ChangesThe <strong>Office</strong> <strong>of</strong> <strong>the</strong> Attorney General’s (OAG) proposed FY 2013 gross budget is $96,650,369 which represents a2.2 percent increase over its FY 2012 approved gross budget <strong>of</strong> $94,531,748. The budget is comprised <strong>of</strong>$58,687,900 in Local funds, $20,256,683 in Federal Grants funds, $1,810,090 in Special Purpose Revenue funds,and $15,895,696 in Intra-District funds.Current Services Funding LevelThe Current Services Funding Level (CSFL) is a Local funds ONLY representation <strong>of</strong> <strong>the</strong> true cost <strong>of</strong> operatingDistrict agencies, before consideration <strong>of</strong> policy decisions. The CSFL reflects changes from <strong>the</strong> FY 2012 approvedbudget across multiple programs, and it estimates how much it would cost an agency to continue its current programsand operations into <strong>the</strong> following fiscal year. The initial adjustments in <strong>the</strong> budget proposal represent changesthat should be compared to <strong>the</strong> FY 2013 CSFL budget and not necessarily changes made to <strong>the</strong> FY 2012 Localfunds budget. The FY 2013 CSFL adjustments to <strong>the</strong> FY 2012 Local funds budget are described in table 5 <strong>of</strong> thisagency's budget chapter. Please see <strong>the</strong> CSFL Development section within Volume 1: Executive Summary for moreinformation regarding <strong>the</strong> methodology used and components that comprise <strong>the</strong> CSFL.OAG's FY 2013 CSFL budget is $57,512,987, which represents a $852,264, or 1.5 percent, increase over <strong>the</strong> FY2012 approved Local funds budget <strong>of</strong> $56,660,723.Major CSFL Cost DriversThe FY 2013 CSFL calculated for OAG included o<strong>the</strong>r adjustment entries that are not described in detail on table5. A reduction <strong>of</strong> $1,876,223 was made to remove one-time funding in <strong>the</strong> FY 2012 budget for a portion <strong>of</strong> <strong>the</strong>local match requirement for <strong>the</strong> child support grant. The match was intended to be paid with Special PurposeRevenue funds in future years. During <strong>the</strong> development <strong>of</strong> <strong>the</strong> CSFL, it was determined that this is, in fact, a recurringneed in <strong>the</strong> Local funds budget, thus this amount was added back to <strong>the</strong> CSFL.FY 2013 Proposed <strong>Budget</strong> and <strong>Financial</strong> Plan<strong>Office</strong> <strong>of</strong> <strong>the</strong> Attorney General for <strong>the</strong> District <strong>of</strong> ColumbiaA-207
Initial Adjusted <strong>Budget</strong>Cost Increase: $264,712 in Local funds to support an increase in Occupancy Fixed Costs; $625,128 and 7.6 FTEsin Federal Grant funds because <strong>of</strong> additional grant funding; $252,557 and 3.0 FTEs in Special Purpose Revenuefunds to support matching requirements for new grant positions; and $3,016 in Intra-District funds reflectingchanges in O<strong>the</strong>r Services and Charges and Contractual Services adjustments.Cost Decrease: $264,712 in Local funds reflects changes in personal services attributed to vacancy savings, $14,097in fixed cost due to a decrease in Federal grants requirement, $67,192 in Special Purpose Revenue funds due to adecrease in projected revenue in FY 2013, and $630,484 and 12.6 FTEs for a decrease in Intra-District agreementswith various agencies for legal services.Correct: OAG’s FTEs increased by 0.2 FTE in Local funds due to an error correction in a split-funded position inFY 2013.Eliminate: OAG eliminated $144,407 and 3.0 FTEs in Private Grant funds as a result <strong>of</strong> discontinuance <strong>of</strong> fundingfor <strong>the</strong> Child Support Program Erasing Borders project with <strong>the</strong> State <strong>of</strong> Maryland.Additionally Adjusted <strong>Budget</strong>Technical Adjustment: Adjustment <strong>of</strong> Fringe Benefits to restore <strong>the</strong> District Government contribution for employeehealth insurance from 72 percent, implemented in <strong>the</strong> FY 2011 budget, to 75 percent in FY 2013, resulting inan increase <strong>of</strong> $191,496 in Local funds, $32,364 in Federal Grant funds, $993 in Special Purpose Revenue funds,and $33,568 in Intra-District funds.Policy InitiativeCost Increase: $115,417 and 1.0 FTE in Family Services Division to cover <strong>the</strong> salary and Fringe Benefits <strong>of</strong> aMental Health Attorney, $50,000 to cover <strong>the</strong> costs <strong>of</strong> remote access for telework initiative, $198,000 and 2.0 FTEsto support enforcement <strong>of</strong> <strong>the</strong> "Student Residency Fraud Prevention Amendment Act <strong>of</strong> 2011,” $300,000 and 3.0FTEs to increase personal services in <strong>the</strong> Public Safety Division to support juvenile and criminal victim services,and $200,000 in Contractual Services for civil litigation support.Technical Adjustment: $120,000 and 3.0 FTEs to support <strong>the</strong> Charles Ruff Fellow program.<strong>Office</strong> <strong>of</strong> <strong>the</strong> Attorney General for <strong>the</strong> District <strong>of</strong> ColumbiaA-208FY 2013 Proposed <strong>Budget</strong> and <strong>Financial</strong> Plan
FY 2013 Approved <strong>Budget</strong> to FY 2013 Proposed <strong>Budget</strong>, by Revenue TypeTable CB0-5 itemizes <strong>the</strong> changes by revenue type between <strong>the</strong> FY 2012 approved budget and <strong>the</strong> FY 2013 proposedbudgetTable CB0-5(dollars in thousands)PROGRAM BUDGET FTELOCAL FUNDS: FY 2012 Approved <strong>Budget</strong> and FTE 56,661 453.1Removal <strong>of</strong> One-Time funding Multiple Programs -1,876 0.0Recurring budget items Multiple Programs 1,876 0.0Fringe Benefit rate adjustment Multiple Programs 572 0.0Consumer price index Multiple Programs 82 0.0Personal Services growth factor Multiple Programs 198 0.0FY 2013 Current Services Funding Level <strong>Budget</strong> (CSFL): 57,513 453.1Cost Increase: In nonpersonal services due to increase in Fixed Costs <strong>Agency</strong> Management 265 0.0Cost Decrease: In personal services Multiple Programs -265 0.0Correct: Increase <strong>of</strong> FTE Multiple Programs 0 0.2FY 2013 Initial Adjusted <strong>Budget</strong>: 57,513 453.3Technical Adjustment: Health insurance contribution Multiple Programs 191 0.0FY 2013 Additionally Adjusted <strong>Budget</strong>: 57,704 453.3FY 2013 Policy InitiativesCost Increase: To cover <strong>the</strong> Salary and Fringe Benefits Family Services Division 115 1.0<strong>of</strong> a Mental Health AttorneyCost Increase: To cover <strong>the</strong> cost <strong>of</strong> remote access for telework initiative <strong>Agency</strong> Management 50 0.0Cost Increase: To support enforcement <strong>of</strong> <strong>the</strong> "Student Residency Public Interest 198 2.0Fraud Prevention Amendment Act <strong>of</strong> 2011Cost Increase: In personal services to support juvenile Public Safety Division 300 3.0and criminal victim servicesCost Increase: In Contractual Services for civil Multiple Programs 200 0.0litigation supportTechnical Adjustments: To support Charles Ruff Fellows program Multiple Programs 120 3.0LOCAL FUNDS: FY 2013 Proposed <strong>Budget</strong> and FTE 58,688 462.3FEDERAL GRANT FUNDS: FY 2012 Approved <strong>Budget</strong> and FTE 19,613 132.0Cost Decrease: In Fixed Costs due to federal grant Child Support Services Division -14 0.0match requirementsCost Increase: In personal services due to increased Child Support Services Division 625 7.6Federal grant fundingFY 2013 Initial Adjusted <strong>Budget</strong>: 20,224 139.6Technical Adjustment: Health insurance contribution Multiple Programs 32 0.0FY 2013 Additionally Adjusted <strong>Budget</strong>: 20,257 139.6FEDERAL GRANT FUNDS: FY 2013 Proposed <strong>Budget</strong> and FTE 20,257 139.6PRIVATE GRANT FUNDS: FY 2012 Approved <strong>Budget</strong> and FTE 144 3.0Eliminate: State <strong>of</strong> Maryland Child Support Enforcement Grant Child Support Services Division -144 -3.0FY 2013 Initial Adjusted <strong>Budget</strong>: 0 0.0PRIVATE GRANT FUNDS: FY 2013 Proposed <strong>Budget</strong> and FTE 0 0.0(Continued on next page)FY 2013 Proposed <strong>Budget</strong> and <strong>Financial</strong> Plan<strong>Office</strong> <strong>of</strong> <strong>the</strong> Attorney General for <strong>the</strong> District <strong>of</strong> ColumbiaA-209
Table CB0-5 (continued)(dollars in thousands)DIVISION BUDGET FTESPECIAL PURPOSE REVENUE FUNDS: FY 2012 Approved <strong>Budget</strong> and FTE 1,624 0.4Cost Increase: In personal services due to expected revenue increase Multiple Programs 253 3.0Cost Decrease: In projected revenue Commercial Division -67 0.0FY 2013 Initial Adjusted <strong>Budget</strong>: 1,809 3.4Technical Adjustment: Health insurance contribution Multiple Programs 1 0.0FY 2013 Additionally Adjusted <strong>Budget</strong>: 1,810 3.4SPECIAL PURPOSE REVENUE FUNDS: FY 2013 Proposed <strong>Budget</strong> and FTE 1,810 3.4INTRA-DISTRICT FUNDS: FY 2012 Approved <strong>Budget</strong> and FTE 16,490 140.2Cost Increase: In O<strong>the</strong>r Services and Charges and Contractual Multiple Programs 3 0.0Service adjustmentsCost Decrease: In personal services due to decrease Multiple Programs -630 -12.6in Intra-District arrangements with various agenciesFY 2013 Initial Adjusted <strong>Budget</strong>: 15,862 127.6Technical Adjustment: Health insurance contribution Multiple Programs 34 0.0FY 2013 Additionally Adjusted <strong>Budget</strong>: 15,896 127.6INTRA-DISTRICT FUNDS: FY 2013 Proposed <strong>Budget</strong> and FTE 15,896 127.6Gross for CB0 - <strong>Office</strong> <strong>of</strong> <strong>the</strong> Attorney General for <strong>the</strong> District <strong>of</strong> Columbia 96,650 732.8(Change is calculated by whole numbers and numbers may not add up due to rounding)<strong>Office</strong> <strong>of</strong> <strong>the</strong> Attorney General for <strong>the</strong> District <strong>of</strong> ColumbiaA-210FY 2013 Proposed <strong>Budget</strong> and <strong>Financial</strong> Plan
<strong>Agency</strong> Performance PlanThe agency’s performance plan has <strong>the</strong> following objectives for FY 2013:Child Support Services DivisionObjective 1: The objective <strong>of</strong> <strong>the</strong> Child Support Services Division is to increase <strong>the</strong> percentage <strong>of</strong> out-<strong>of</strong>-wedlockbirths with paternity established for children in foster care cases; increase <strong>the</strong> amount <strong>of</strong> children and parents receivingchild support by increasing <strong>the</strong> number <strong>of</strong> child support orders established; improve customer service andincrease customer access to child support case information by expanding on-line and automated child support services;and reduce <strong>the</strong> poverty level <strong>of</strong> non-custodial parents by establishing an employment services initiative.Proposed Key Performance Indicators - Child Support Services DivisionFY 2010 FY 2011 FY 2011 FY 2012 FY 2013 FY 2014Measure Actual Target Actual Projection Projection ProjectionPaternity establishment percentageNot88.13% 90% 80.05% 85% 90% AvailableNumber <strong>of</strong> non-custodial parents enrolled inemployment services program 263 200 251 255 225NotAvailableNumber <strong>of</strong> parents newly registered to access <strong>the</strong>iron-line payment histories 1,240 1,000 1,708 1,500 1,750NotAvailableNumber <strong>of</strong> child support orders established2,347 2,679 2,254 2,350 2,500 NotAvailableCivil Litigation DivisionObjective 1: The Civil Litigation Division’s objective is to provide <strong>the</strong> District <strong>of</strong> Columbia, its agencies and itsemployees a defense in civil litigation that is filed in <strong>the</strong> Superior Court <strong>of</strong> <strong>the</strong> District <strong>of</strong> Columbia and in <strong>the</strong>United States District Court for <strong>the</strong> District <strong>of</strong> Columbia.Proposed Key Performance Indicators - Civil Litigation Division 1FY 2010 FY 2011 FY 2011 FY 2012 FY 2013 FY 2014Measure Actual Target Actual Projection Projection ProjectionNumber <strong>of</strong> civil litigation closed cases 289 300 304 310 316 NotAvailablePercentage <strong>of</strong> completed settled cases submittedwithin 10 business days <strong>of</strong> receipt <strong>of</strong> all requiredforms for paymentNotAvailableNotAvailableNotAvailable 75% 2 NotAvailableNotAvailableNumber <strong>of</strong> closed public school system special Not Not Not Not Noteducation cases closed per attorney FTE Available Available Available 15 Available AvailableFY 2013 Proposed <strong>Budget</strong> and <strong>Financial</strong> Plan<strong>Office</strong> <strong>of</strong> <strong>the</strong> Attorney General for <strong>the</strong> District <strong>of</strong> ColumbiaA-211
Commercial DivisionObjective 1: The Commercial Division objectives are to provide legal advice and transactional and litigation supportto <strong>the</strong> District government in <strong>the</strong> core areas <strong>of</strong> community and economic development, real estate, procurement,tax and finance, land use and public works, and bankruptcy.Proposed Key Performance Indicators - Commercial DivisionFY 2010 FY 2011 FY 2011 FY 2012 FY 2013 FY 2014Measure Actual Target Actual Projection Projection ProjectionPercentage <strong>of</strong> Legal sufficiency reviews performedNotby Land Use and Public Works Section timelycompleted 73% 85% 90% 87.5% 93% AvailablePercentage <strong>of</strong> Real Estate Transactions Sectiontransactional documents prepared and/or reviewedfor legal sufficiency within 60 days 96% 95% 94% 95% 93%NotAvailableNumber <strong>of</strong> litigation successes by <strong>the</strong> Tax andFinance Section per FTE 14.4 15 27 20 15NotAvailablePercentage <strong>of</strong> litigation success by <strong>the</strong> LandAcquisition and Bankruptcy Section 3 94.82% 90% 95% 92.5% 96%NotAvailablePercentage <strong>of</strong> Procurement Section non-emergencyprocurement reviews completed within 60 days 4 94% 90% 95% 92.5% 93%NotAvailableFamily Services DivisionObjective 1: To ensure safety, permanency and well-being <strong>of</strong> allegedly neglected children, and to seek guardianshipsor conservatorships for allegedly neglected, abused or exploited vulnerable adults.Proposed Key Performance Indicators - Family Services DivisionFY 2010 FY 2011 FY 2011 FY 2012 FY 2013 FY 2014Measure Actual Target Actual Projection Projection ProjectionPercentage <strong>of</strong> favorable resolution in all cases whichreach adjudication in <strong>the</strong> division 99% 97.5% 98 % 98% 98%NotAvailablePercentage <strong>of</strong> children whose first permanencyhearing is held within 12 months <strong>of</strong> <strong>the</strong> child’s entryinto foster care 88.5% 90% 90.8% 91% 93%NotAvailablePercentage <strong>of</strong> cases filed for termination <strong>of</strong> parentalright by <strong>the</strong> Child Protection Sections within 45 days<strong>of</strong> <strong>the</strong> child’s goal becoming adoption 92.5% 92.5% 88.5% 90% 89%NotAvailableSuccessfully resolved criminal contempt motionshandled by <strong>the</strong> Domestic Violence Section per FTEper quarter 4.38 4.5 4.24 4.5 15%NotAvailable<strong>Office</strong> <strong>of</strong> <strong>the</strong> Attorney General for <strong>the</strong> District <strong>of</strong> ColumbiaA-212FY 2013 Proposed <strong>Budget</strong> and <strong>Financial</strong> Plan
Public Interest DivisionObjective 1: The Public Interest Division seeks through civil and administrative litigation to protect both <strong>the</strong> generalpublic and <strong>the</strong> District from violations <strong>of</strong> <strong>the</strong> District’s laws and regulations, to collect funds owed to <strong>the</strong>District, and to defend <strong>the</strong> District, its agencies, and <strong>of</strong>ficials in a variety <strong>of</strong> civil litigation, including individual andsystemic constitutional and statutory challenges to its laws, regulations, policies and procedures.Proposed Key Performance Indicators - Public Interest DivisionFY 2010 FY 2011 FY 2011 FY 2012 FY 2013 FY 2014Measure Actual Target Actual Projection Projection ProjectionMoney collected by <strong>the</strong> Civil EnforcementSection per Attorney FTE $101,413 $103,000 $144,267 $130,000 $270,000NotAvailableMoney collected by <strong>the</strong> Public Advocacy Sectionexcluding Tobacco Settlement $2,418,052 $2,700,000 $2,611,641 $2,700,000 $2,700,000NotAvailableNumber <strong>of</strong> closed cases in <strong>the</strong> Equity Section 5 82 85 76 40 80 NotAvailableLegal Counsel DivisionObjective 1: The Legal Counsel Division’s objectives are to assist <strong>the</strong> Executive <strong>Office</strong> <strong>of</strong> <strong>the</strong> Mayor and all agencies<strong>of</strong> <strong>the</strong> District government by providing legal research and advice, reviewing for legal sufficiency all enrolledbills presented for action by <strong>the</strong> Mayor, reviewing for legal sufficiency all draft Executive bills, rulemakings, Mayor’sOrders, and inter-agency MOUs, preparing Executive legislation and rulemakings, preparing formal opinions,legal memoranda, letters, and <strong>Office</strong> Orders for <strong>the</strong> Attorney General, and serving as attorney-advisor to <strong>the</strong>Advisory Neighborhood Commissions (ANCs).Proposed Key Performance Indicators - Legal Counsel DivisionFY 2010 FY 2011 FY 2011 FY 2012 FY 2013 FY 2014Measure Actual Target Actual Projection Projection ProjectionNumber <strong>of</strong> rulemaking projects completed for clientagencies 50.00 50.00 36.00 40 46NotAvailablePercentage <strong>of</strong> written assignments completed bydeadline given by client agency, or 30 days if nodeadline given 99% 99% 99.04% 99% 98%NotAvailableNumber <strong>of</strong> completed written assignment per FTE 212.00 215.00 180 215 200 NotAvailableNumber <strong>of</strong> high-pr<strong>of</strong>ile lawsuits directly assisted 20.00 20.00 15.00 20 15 NotAvailableNumber <strong>of</strong> written opinions issued to ANCs 25.00 25.00 17.00 20 20 NotAvailableFY 2013 Proposed <strong>Budget</strong> and <strong>Financial</strong> Plan<strong>Office</strong> <strong>of</strong> <strong>the</strong> Attorney General for <strong>the</strong> District <strong>of</strong> ColumbiaA-213
<strong>Office</strong> <strong>of</strong> <strong>the</strong> Solicitor GeneralObjective 1: The <strong>Office</strong> <strong>of</strong> <strong>the</strong> Solicitor General strives to provide <strong>the</strong> best possible representation to <strong>the</strong> District<strong>of</strong> Columbia government in matters before appellate courts, including <strong>the</strong> District <strong>of</strong> Columbia Court <strong>of</strong> Appeals,<strong>the</strong> United States Court <strong>of</strong> Appeals for <strong>the</strong> District <strong>of</strong> Columbia Circuit, and <strong>the</strong> United States Supreme Court,and to provide guidance and expertise to o<strong>the</strong>r parts <strong>of</strong> <strong>the</strong> District <strong>of</strong> Columbia government that require advicein o<strong>the</strong>r matters that may reach appellate courts.Proposed Key Performance Indicators - <strong>Office</strong> <strong>of</strong> <strong>the</strong> Solicitor GeneralFY 2010 FY 2011 FY 2011 FY 2012 FY 2013 FY 2014Measure Actual Target Actual Projection Projection ProjectionPercentage <strong>of</strong> favorable resolution in defensiveappeals cases 90% 91% 94% 92% 93%NotAvailablePercentage <strong>of</strong> regular calendar arguments in whicha moot court was held 100% 95% 100% 100% 93%NotAvailableMotions for summary disposition filed per FTE 1.09 2.00 2 2.1 2 NotAvailablePersonnel, Labor and Employment DivisionObjective 1: The Personnel Labor and Employment Division’s objective is to defend agencies against administrativechallenges to adverse actions, public sector workers’ compensation and discrimination claims; hire and retainexcellent diverse attorneys and interns while maintaining a diverse environment; ensure no person is a victim <strong>of</strong>workplace discrimination; and provide meaningful training and pr<strong>of</strong>essional development for all OAG employees.Proposed Key Performance Indicators - Personnel, Labor and Employment DivisionFY 2010 FY 2011 FY 2011 FY 2012 FY 2013 FY 2014Measure Actual Target Actual Projection Projection ProjectionNumber <strong>of</strong> attorneys who left <strong>the</strong> agency 36 50 29 35 40 NotAvailableNumber <strong>of</strong> interns assisting attorneys and staff onan annual basis 224 225 256 250 200NotAvailableNumber <strong>of</strong> in-house training hours taken per legal FTE 16.35 17.00 33.5 25 12 NotAvailable<strong>Office</strong> <strong>of</strong> <strong>the</strong> Attorney General for <strong>the</strong> District <strong>of</strong> ColumbiaA-214FY 2013 Proposed <strong>Budget</strong> and <strong>Financial</strong> Plan
Public Safety DivisionObjective 1: The objective <strong>of</strong> <strong>the</strong> Public Safety Division’s three Sections (Juvenile, Criminal and Neighborhoodand Victim Services) is to take appropriate legal action on behalf <strong>of</strong> <strong>the</strong> District <strong>of</strong> Columbia and to enforce Districtlaws and regulations. Whe<strong>the</strong>r through civil or criminal prosecution to enforce <strong>the</strong> District’s laws, <strong>the</strong> Divisioninitiates legal claims to protect <strong>the</strong> public and to seek restitution, where applicable, for those who have been harmed,including <strong>the</strong> Government <strong>of</strong> <strong>the</strong> District <strong>of</strong> Columbia.Proposed Key Performance Indicators - Public Safety DivisionFY 2010 FY 2011 FY 2011 FY 2012 FY 2013 FY 2014Measure Actual Target Actual Projection Projection ProjectionNumber <strong>of</strong> Nuisance Property ProsecutionsNot24 25 11 15 39 AvailableNotJuveniles referred for rehabilitation 91% 91% 89% 90 93% AvailableSuccessful criminal cases per FTENot58.00 60.00 72 65 30 Available1 Due to an <strong>of</strong>fice reorganization effective August 2011, <strong>the</strong> Civil Litigation no longer encompasses <strong>the</strong> function measured in prior KPI for Civil Enforcement Section, Public Advocacy Section <strong>of</strong><strong>the</strong> Equity Section.2 During a reorganization <strong>of</strong> <strong>the</strong> <strong>Office</strong> <strong>of</strong> <strong>the</strong> Attorney General, <strong>the</strong> structure and responsibilities <strong>of</strong> <strong>the</strong> CLD were changed such that only one <strong>of</strong> <strong>the</strong> prior measures for CLD was applicable for2012. Therefore, new measures had to be constructed. They are included herein.3 Due to a reorganization <strong>of</strong> responsibilities by OEM, <strong>the</strong> Economic Development Section is no longer associated with <strong>the</strong> Commercial Division. This necessitated replacement <strong>of</strong> a KPI for thisDivision. This is a new reported measure, even though <strong>the</strong> Division has previously kept this measure internally.4 See endnote 3.5 Due to a reorganization <strong>of</strong> responsibilities effective August 2011, one-half <strong>of</strong> <strong>the</strong> Equity Section’s responsibilities were transferred to <strong>the</strong> Civil Litigation Division. This affected <strong>the</strong> number <strong>of</strong>closed cases during <strong>the</strong> current fiscal year, and will substantially decrease <strong>the</strong> number <strong>of</strong> closed Equity Section cases during <strong>the</strong> entire next fiscal year.FY 2013 Proposed <strong>Budget</strong> and <strong>Financial</strong> Plan<strong>Office</strong> <strong>of</strong> <strong>the</strong> Attorney General for <strong>the</strong> District <strong>of</strong> ColumbiaA-215
District <strong>of</strong> Columbia Board <strong>of</strong> Ethicsand Government Accountability(AG0)% ChangeFY 2011 FY 2012 FY 2013 fromDescription Actual Approved Proposed FY 2012Operating <strong>Budget</strong> $0 $350,000 $1,039,000 196.9FTEs 0.0 3.0 9.0 200.0The mission <strong>of</strong> <strong>the</strong> District <strong>of</strong> Columbia Board <strong>of</strong> Ethics andGovernment Accountability (BEGA) is to administer and enforce <strong>the</strong>Code <strong>of</strong> Conduct and maintain an Ethics Board that receives, investigates,and adjudicates violations <strong>of</strong> <strong>the</strong> Code <strong>of</strong> Conduct; to monitor<strong>the</strong> District’s compliance with <strong>the</strong> Freedom <strong>of</strong> Information Act(FOIA) to assist <strong>the</strong> public and promote effective use <strong>of</strong> <strong>the</strong> District’sFOIA; and to resolve disputes between agencies and requesters regardingaccess to government records.The District <strong>of</strong> Columbia Board <strong>of</strong> Ethics and Government Accountability is an independent agency that replaces<strong>the</strong> District <strong>of</strong> Columbia Open Government <strong>Office</strong>. BEGA will implement <strong>the</strong> duties and responsibility establishedpursuant to D.C. Act 19-318, <strong>the</strong> “Board <strong>of</strong> Ethics and Government Accountability Establishment andComprehensive Ethics Reform Emergency Amendment Act <strong>of</strong> 2012.” The new agency also incorporates <strong>the</strong> functions,responsibilities and funding <strong>of</strong> <strong>the</strong> District <strong>of</strong> Columbia Open Government <strong>Office</strong>, which will be an independent<strong>Office</strong> within <strong>the</strong> agency, charged with ensuring that District agencies comply with <strong>the</strong> District’s FOIAand Open Meetings Act.The agency’s FY 2013 proposed budget is presented in <strong>the</strong> following tables:FY 2013 Proposed <strong>Budget</strong> and <strong>Financial</strong> PlanD.C. Board <strong>of</strong> Ethics and Government AccountabilityA-217
FY 2013 Proposed Gross Funds Operating <strong>Budget</strong>, by Revenue TypeTable AG0-1 contains <strong>the</strong> proposed FY 2013 agency budget compared to <strong>the</strong> FY 2012 approved budget.Table AG0-1(dollars in thousands)ChangeActual Actual Approved Proposed from PercentAppropriated Fund FY 2010 FY 2011 FY 2012 FY 2013 FY 2012 Change*General FundLocal Funds 0 0 350 979 629 179.7Special Purpose Revenue Funds 0 0 0 60 60 N/ATotal for General Fund 0 0 350 1,039 689 196.9Gross Funds 0 0 350 1,039 689 196.9*Percent change is based on whole dollars.Note: If applicable, for a breakdown <strong>of</strong> each Grant (Federal and Private), Special Purpose Revenue type and Intra-District agreement,please refer to Schedule 80 <strong>Agency</strong> Summary by Revenue Source in <strong>the</strong> FY 2013 Operating Appendices located on <strong>the</strong> <strong>Office</strong> <strong>of</strong> <strong>the</strong><strong>Chief</strong> <strong>Financial</strong> <strong>Office</strong>r’s website.FY 2013 Proposed Full-Time Equivalents, by Revenue TypeTable AG0-2 contains <strong>the</strong> proposed FY 2013 FTE level compared to <strong>the</strong> FY 2012 approved FTE level by revenuetype.Table AG0-2ChangeActual Actual Approved Proposed from PercentAppropriated Fund FY 2010 FY 2011 FY 2012 FY 2013 FY 2012 ChangeGeneral FundLocal Funds 0.0 0.0 3.0 9.0 6.0 200.0Total for General Fund 0.0 0.0 3.0 9.0 6.0 200.0Total Proposed FTEs 0.0 0.0 3.0 9.0 6.0 200.0D.C. Board <strong>of</strong> Ethics and Government AccountabilityA-218FY 2013 Proposed <strong>Budget</strong> and <strong>Financial</strong> Plan
FY 2013 Proposed Operating <strong>Budget</strong>, by Comptroller Source GroupTable AG0-3 contains <strong>the</strong> proposed FY 2013 budget at <strong>the</strong> Comptroller Source Group (object class) level comparedto <strong>the</strong> FY 2012 approved budget.Table AG0-3(dollars in thousands)ChangeActual Actual Approved Proposed from PercentComptroller Source Group FY 2010 FY 2011 FY 2012 FY 2013 FY 2012 Change*11 - Regular Pay - Continuing Full Time 0 0 253 752 499 197.614 - Fringe Benefits - Current Personnel 0 0 45 148 102 224.9Subtotal Personal Services (PS) 0 0 298 900 601 201.720 - Supplies and Materials 0 0 5 2 -2 -50.032 - Rentals - Land and Structures 0 0 0 22 22 N/A40 - O<strong>the</strong>r Services and Charges 0 0 47 112 65 138.070 - Equipment and Equipment Rental 0 0 0 3 3 N/ASubtotal Nonpersonal Services (NPS) 0 0 52 139 88 168.8Gross Funds 0 0 350 1,039 689 196.9*Percent change is based on whole dollars.Program DescriptionThe District <strong>of</strong> Columbia Board <strong>of</strong> Ethics and Government Accountability (BEGA) operates through <strong>the</strong> following2 programs:<strong>Office</strong> <strong>of</strong> Open Government – administers and enforces <strong>the</strong> Code <strong>of</strong> Conduct through <strong>the</strong> Ethics Board, monitors<strong>the</strong> District’s compliance with <strong>the</strong> Freedom <strong>of</strong> Information Act (FOIA), assists <strong>the</strong> public and promotes effectiveuse <strong>of</strong> <strong>the</strong> District’s FOIA, and resolves disputes between agencies and requesters regarding access to governmentrecords.Board <strong>of</strong> Ethics – receives, investigates, assesses and adjudicates violations <strong>of</strong> <strong>the</strong> Code <strong>of</strong> Conduct; providesmandatory ethics training; issues rules and regulations governing <strong>the</strong> ethical conduct <strong>of</strong> employees and public <strong>of</strong>ficials;and provides for an anonymous and confidential receipt <strong>of</strong> information related to violations <strong>of</strong> <strong>the</strong> Code <strong>of</strong>Conduct or o<strong>the</strong>r information with regard to its administration or enforcement.Program Structure ChangePursuant to D.C. Act 19-318, <strong>the</strong> “Board <strong>of</strong> Ethics and Government Accountability Establishment and ComprehensiveEthics Reform Emergency Amendment Act <strong>of</strong> 2012” (<strong>the</strong> Ethics Act), <strong>the</strong> District <strong>of</strong> Columbia <strong>Office</strong> <strong>of</strong> OpenGovernment was absorbed into <strong>the</strong> District <strong>of</strong> Columbia Board <strong>of</strong> Ethics and Government Accountability in <strong>the</strong> FY 2013proposed budget. This change expands <strong>the</strong> responsibilities <strong>of</strong> <strong>the</strong> previous agency and expands <strong>the</strong> agency programstructure to include <strong>the</strong> <strong>Office</strong> <strong>of</strong> Open Government and <strong>the</strong> Board <strong>of</strong> Ethics. It is anticipated that <strong>the</strong> agency willbegin its operations in FY 2012.FY 2013 Proposed <strong>Budget</strong> and <strong>Financial</strong> PlanD.C. Board <strong>of</strong> Ethics and Government AccountabilityA-219
FY 2013 Proposed Operating <strong>Budget</strong> and FTEs, by Program and ActivityTable AG0-4 contains <strong>the</strong> proposed FY 2013 budget by program and activity compared to <strong>the</strong> FY 2012 approved budget.Table AG0-4(dollars in thousands)Dollars in ThousandsFull-Time EquivalentsChangeChangeActual Approved Proposed from Actual Approved Proposed fromProgram/Activity FY 2011 FY 2012 FY 2013 FY 2012 FY 2011 FY 2012 FY 2013 FY 2012(1000) <strong>Office</strong> <strong>of</strong> Open Government(1100) <strong>Office</strong> <strong>of</strong> Open Government 0 350 835 485 0.0 3.0 8.0 5.0(1100) <strong>Office</strong> <strong>of</strong> Open Government 0 0 2 2 0.0 2.0 0.0 -2.0Subtotal (1000) <strong>Office</strong> <strong>of</strong> Open Government 0 350 835 485 0.0 3.0 8.0 5.0(2000) Board <strong>of</strong> Ethics(2010) Board <strong>of</strong> Ethics 0 0 204 204 0.0 0.0 1.0 1.0Subtotal (2000) Board <strong>of</strong> Ethics 0 0 204 204 0.0 0.0 1.0 1.0Total Proposed Operating <strong>Budget</strong> 0 350 1,039 689 0.0 3.0 9.0 6.0(Change is calculated by whole numbers and numbers may not add up due to rounding)Note: For more detailed information regarding <strong>the</strong> proposed funding for <strong>the</strong> activities within this agency’s programs, please see Schedule 30-PBBProgram Summary by Activity in <strong>the</strong> FY 2013 Operating Appendices located on <strong>the</strong> <strong>Office</strong> <strong>of</strong> <strong>the</strong> <strong>Chief</strong> <strong>Financial</strong> <strong>Office</strong>r’s website.FY 2013 Proposed <strong>Budget</strong> ChangesThe District <strong>of</strong> Columbia Board <strong>of</strong> Ethics and Government Accountability’s (BEGA) proposed FY 2013 gross budgetis $1,039,000, which represents a 196.9 percent increase over its FY 2012 approved gross funds budget <strong>of</strong>$350,000. The budget is comprised <strong>of</strong> $979,000 in Local funds and $60,000 in Special Purpose Revenue funds.The Ethics Act establishes two nonlapsing funds that shall be administered by <strong>the</strong> Ethics Board. The Board <strong>of</strong>Ethics and Government Accountability Fund (Accountability Fund) collects fees and fines imposed by <strong>the</strong> EthicsBoard for civil and criminal violations <strong>of</strong> <strong>the</strong> Code <strong>of</strong> Conduct. The Lobbyist Administration and EnforcementFund (Lobbyist Fund) collects a registration fee from lobbyists who have dealings with <strong>the</strong> District <strong>of</strong> Columbiagovernment.Pursuant to legislation, <strong>the</strong> Lobbyist Fund, which was within <strong>the</strong> <strong>Office</strong> <strong>of</strong> Campaign Finance and includes itscertified fund balance and budget FY 2013 anticipated revenue, will transfer in to BEGA once <strong>the</strong> agency is <strong>of</strong>ficiallyestablished. The Accountability Fund will be created in BEGA when <strong>the</strong> agency is established and <strong>the</strong> anticipatedrevenue is certified.D.C. Board <strong>of</strong> Ethics and Government AccountabilityA-220FY 2013 Proposed <strong>Budget</strong> and <strong>Financial</strong> Plan
Current Services Funding LevelThe Current Services Funding Level (CSFL) is a Local funds ONLY representation <strong>of</strong> <strong>the</strong> true cost <strong>of</strong> operatingDistrict agencies, before consideration <strong>of</strong> policy decisions. The CSFL reflects changes from <strong>the</strong> FY 2012 approvedbudget across multiple programs, and it estimates how much it would cost an agency to continue its current programsand operations into <strong>the</strong> following fiscal year. The initial adjustments in <strong>the</strong> budget proposal representchanges that should be compared to <strong>the</strong> FY 2013 CSFL budget and not necessarily changes made to <strong>the</strong> FY 2012Local funds budget. The FY 2013 CSFL adjustments to <strong>the</strong> FY 2012 Local funds budget are described in table 5<strong>of</strong> this agency's budget chapter. Please see <strong>the</strong> CSFL Development section within Volume 1: Executive Summaryfor more information regarding <strong>the</strong> methodology used and components that comprise <strong>the</strong> CSFL.The BEGA’s FY 2013 CSFL budget is $355,481, which represents a $5,481, or 1.6 percent, increase over <strong>the</strong>FY 2012 approved Local funds budget <strong>of</strong> $350,000.Initial Adjusted <strong>Budget</strong>Cost Increase: The agency allocated $1,509 in Local funds to support Contractual Services costs related to satisfyingFreedom <strong>of</strong> Information Act (FOIA) requests.Cost Decrease: A reduction <strong>of</strong> $1,509 in Local funds reflects changes in starting salaries for certain agency positionsand cost adjustments for Supplies and Materials.Additionally Adjusted <strong>Budget</strong>Technical Adjustment: Adjustments <strong>of</strong> Fringe Benefits to restore <strong>the</strong> District Government contribution foremployee health insurance from 72 percent, implemented in <strong>the</strong> FY 2011 budget, to 75 percent in FY 2013, resultingin an increase <strong>of</strong> $1,066 in Local funds.Policy InitiativesCreate: An increase <strong>of</strong> $450,467 and 5.0 FTEs in Local funds reflects <strong>the</strong> creation <strong>of</strong> a new structure based on <strong>the</strong>Ethics Act, which includes funding for a Director <strong>of</strong> <strong>the</strong> <strong>Office</strong> <strong>of</strong> Open Government as well as operational staffing.In addition, an increase <strong>of</strong> $144,000 and 1.0 FTE in <strong>the</strong> Board <strong>of</strong> Ethics program to support a new Ethics BoardDirector position.Cost Increase: An increase <strong>of</strong> $22,376 in Rent costs supports <strong>the</strong> acquisition <strong>of</strong> <strong>of</strong>fice space for <strong>the</strong> new agency.Also, an increase <strong>of</strong> $4,656 in O<strong>the</strong>r Services and Charges supports compensation costs for members <strong>of</strong> <strong>the</strong> Board<strong>of</strong> Ethics and <strong>the</strong> Chairman <strong>of</strong> <strong>the</strong> Ethics Board. This increase complies with an Ethics Act provision, which statesthat <strong>the</strong> board compensation budget is to total $51,500 per year. Members receive an amount no greater than$12,500 and <strong>the</strong> Chairman an amount no greater than $26,500.Cost Decrease: A decrease <strong>of</strong> $2,500 in Local funds reflects cost savings in Supplies and Materials.Transfer In: An increase <strong>of</strong> $60,000 reflects <strong>the</strong> transfer <strong>of</strong> <strong>the</strong> Lobbyist Administration and Enforcement fundfrom <strong>the</strong> <strong>Office</strong> <strong>of</strong> Campaign Finance to support <strong>the</strong> functions <strong>of</strong> <strong>the</strong> Board <strong>of</strong> Ethics program.FY 2013 Proposed <strong>Budget</strong> and <strong>Financial</strong> PlanD.C. Board <strong>of</strong> Ethics and Government AccountabilityA-221
FY 2012 Approved <strong>Budget</strong> to FY 2013 Proposed <strong>Budget</strong>, by Revenue TypeTable AG0-5 itemizes <strong>the</strong> changes by revenue type between <strong>the</strong> FY 2012 approved budget and <strong>the</strong> FY 2013 proposedbudget.Table AG0-5(dollars in thousands)PROGRAM BUDGET FTELOCAL FUNDS: FY 2012 Approved <strong>Budget</strong> and FTE 350 3.0Fringe Benefit Rate Adjustment <strong>Office</strong> <strong>of</strong> Open Government 3 0.0Consumer Price Index <strong>Office</strong> <strong>of</strong> Open Government 1 0.0Personal Services Growth Factor <strong>Office</strong> <strong>of</strong> Open Government 1 0.0FY 2013 Current Services Funding Level <strong>Budget</strong> (CSFL) 355 3.0Cost Increase: Compliance costs associated with FOIA <strong>Office</strong> <strong>of</strong> Open Government 2 0.0requestsCost Decrease: Personal services-related adjustments <strong>Office</strong> <strong>of</strong> Open Government -2 0.0FY 2013 Initial Adjusted <strong>Budget</strong> 355 3.0Technical Adjustment: Health insurance contribution Multiple Programs 1 0.0FY 2013 Additionally Adjusted <strong>Budget</strong> 357 3.0FY 2013 Policy InitiativesCreate: Salary and fringe costs <strong>of</strong> new agency <strong>Office</strong> <strong>of</strong> Open Government 450 5.0Create: Ethics Board Director Board <strong>of</strong> Ethics 144 1.0Cost Increase: Rent / Lease costs <strong>Office</strong> <strong>of</strong> Open Government 22 0.0Cost Increase: Stipend costs for Ethics Board members <strong>Office</strong> <strong>of</strong> Open Government 5 0.0Cost Increase: Equipment costs for new staff <strong>Office</strong> <strong>of</strong> Open Government 3 0.0Cost Decrease: Supply cost savings <strong>Office</strong> <strong>of</strong> Open Government -2 0.0LOCAL FUNDS: FY 2013 Proposed <strong>Budget</strong> and FTE 979 9.0SPECIAL PURPOSE REVENUE FUNDS: FY 2012 Approved <strong>Budget</strong> and FTE 0 0.0FY 2013 Policy InitiativeTransfer In: Lobbyist fund Board <strong>of</strong> Ethics 60 0.0SPECIAL PURPOSE REVENUE FUNDS: FY 2013 Proposed <strong>Budget</strong> and FTE 60 0.0Gross for AG0 - District <strong>of</strong> Columbia Board <strong>of</strong> Ethics and Government Accountability 1,039 9.0(Change is calculated by whole numbers and numbers may not add up due to rounding)D.C. Board <strong>of</strong> Ethics and Government AccountabilityA-222FY 2013 Proposed <strong>Budget</strong> and <strong>Financial</strong> Plan
Access to Justice(AJ0)% ChangeFY 2011 FY 2012 FY 2013 fromDescription Actual Approved Proposed FY 2012Operating <strong>Budget</strong> $2,951,000 $0 $0 N/AThe Access to Justice agency was absorbed into <strong>the</strong> Deputy Mayor forPublic Safety. Its mission and funding was transferred. The total fundingamount transferred, based on <strong>the</strong> FY 2011 Approved <strong>Budget</strong>, is$2,951,000. The proposed programs and projects for FY 2013 areshown in <strong>the</strong> Access to Justice program in <strong>the</strong> Deputy Mayor forPublic Safety and Justice budget chapter.The agency’s FY 2011 actual expenditures and FY 2012 and FY 2013 budgets are presented in <strong>the</strong> following tables:FY 2013 Proposed <strong>Budget</strong> and <strong>Financial</strong> PlanAccess to JusticeA-223
FY 2013 Proposed Gross Funds Operating <strong>Budget</strong>, by Revenue TypeTable AJ0-1 contains <strong>the</strong> proposed FY 2013 agency budget compared to <strong>the</strong> FY 2012 approved budget. It alsoprovides FY 2010 and FY 2011 actual expenditures.Table AJ0-1(dollars in thousands)ChangeActual Actual Approved Proposed from PercentAppropriated Fund FY 2010 FY 2011 FY 2012 FY 2013 FY 2012 Change*General FundLocal Funds 0 2,951 0 0 0 N/ATotal for General Fund 0 2,951 0 0 0 N/AGross Funds 0 2,951 0 0 0 N/A*Percent change is based on whole dollars.Note: If applicable, for a breakdown <strong>of</strong> each Grant (Federal and Private), Special Purpose Revenue type and Intra-District agreement,please refer to Schedule 80 <strong>Agency</strong> Summary by Revenue Source in <strong>the</strong> FY 2013 Operating Appendices located on <strong>the</strong> <strong>Office</strong> <strong>of</strong> <strong>the</strong><strong>Chief</strong> <strong>Financial</strong> <strong>Office</strong>r’s website.FY 2013 Proposed Operating <strong>Budget</strong>, by Comptroller Source GroupTable AJ0-2 contains <strong>the</strong> proposed FY 2013 budget at <strong>the</strong> Comptroller Source Group (object class) level comparedto <strong>the</strong> FY 2012 approved budget. It also provides FY 2010 and FY 2011 actual expenditures.Table AJ0-2(dollars in thousands)ChangeActual Actual Approved Proposed from PercentComptroller Source Group FY 2010 FY 2011 FY 2012 FY 2013 FY 2012 Change*41 - Contractual Services - O<strong>the</strong>r 0 2,951 0 0 0 N/ASubtotal Nonpersonal Services (NPS) 0 2,951 0 0 0 N/AGross Funds 0 2,951 0 0 0 N/A*Percent change is based on whole dollars.Program DescriptionPlease see <strong>the</strong> Deputy Mayor for Public Safety and Justice budget chapter for a description <strong>of</strong> programs related to<strong>the</strong> prior functions <strong>of</strong> Access to Justice.Access to JusticeA-224FY 2013 Proposed <strong>Budget</strong> and <strong>Financial</strong> Plan
FY 2013 Proposed Operating <strong>Budget</strong> and FTEs, by Program and ActivityTable AJ0-3 contains <strong>the</strong> proposed FY 2013 budget by program and activity compared to <strong>the</strong> FY 2012 approved budget.It also provides <strong>the</strong> FY 2011 actual data.Table AJ0-3(dollars in thousands)Dollars in ThousandsFull-Time EquivalentsChangeChangeActual Approved Proposed from Actual Approved Proposed fromProgram/Activity FY 2011 FY 2012 FY 2013 FY 2012 FY 2011 FY 2012 FY 2013 FY 2012(1000) Access to Justice (AJ0)(1001) Access to Justice (AJ0) 2,951 0 0 0 0.0 0.0 0.0 0.0Subtotal (1000) Access to Justice (AJ0) 2,951 0 0 0 0.0 0.0 0.0 0.0Total Proposed Operating <strong>Budget</strong> 2,951 0 0 0 0.0 0.0 0.0 0.0(Change is calculated by whole numbers and numbers may not add up due to rounding)Note: For more detailed information regarding <strong>the</strong> proposed funding for <strong>the</strong> activities within this agency’s programs, please see Schedule 30-PBBProgram Summary by Activity in <strong>the</strong> FY 2013 Operating Appendices located on <strong>the</strong> <strong>Office</strong> <strong>of</strong> <strong>the</strong> <strong>Chief</strong> <strong>Financial</strong> <strong>Office</strong>r’s website.Program Structure ChangeIn FY 2012, <strong>the</strong> Access to Justice agency transferred its entire budget <strong>of</strong> $2,951,000 and 0.0 FTE to <strong>the</strong> DeputyMayor for Public Safety and Justice (DMPSJ). All functions and responsibilities that formerly existed in Access toJustice currently resides within DMPSJ. The program description, structure, and o<strong>the</strong>r information about <strong>the</strong> consolidationare presented in <strong>the</strong> Deputy Mayor for Public Safety and Justice agency budget chapter.FY 2013 Proposed <strong>Budget</strong> and <strong>Financial</strong> PlanAccess to JusticeA-225
<strong>Office</strong> <strong>of</strong> <strong>the</strong> Inspector General(AD0)http://oig.dc.govTelephone: 202-727-2540% ChangeFY 2011 FY 2012 FY 2013 fromDescription Actual Approved Proposed FY 2012Operating <strong>Budget</strong> $14,099,638 $15,393,352 $15,685,662 1.9FTEs 106.3 112.0 112.0 0.0The mission <strong>of</strong> <strong>the</strong> <strong>Office</strong> <strong>of</strong> <strong>the</strong> Inspector General (OIG) is to conductindependent audits, investigations, and inspections to detect andprevent fraud, waste, and mismanagement, and to help <strong>the</strong> District <strong>of</strong>Columbia government improve its programs and operations by promotingeconomy, efficiency, and effectiveness.Summary <strong>of</strong> ServicesOIG initiates and conducts independent financial and performance audits, inspections, and investigations <strong>of</strong>District government operations; serves as <strong>the</strong> principal liaison between <strong>the</strong> District government and <strong>the</strong> U.S.Government Accountability <strong>Office</strong>; conducts o<strong>the</strong>r special audits, assignments, and investigations; audits procurementand contract administration on a continual basis; forwards to <strong>the</strong> appropriate authorities evidence <strong>of</strong> criminalwrongdoing that is discovered as <strong>the</strong> result <strong>of</strong> audits, inspections, or investigations conducted by <strong>the</strong> <strong>Office</strong>;enters into a contract with an outside audit firm to perform <strong>the</strong> annual audit <strong>of</strong> <strong>the</strong> District government’s financialoperations with <strong>the</strong> results published in <strong>the</strong> Comprehensive Annual <strong>Financial</strong> Report (CAFR); and chairs <strong>the</strong>CAFR oversight committee.The agency’s FY 2013 proposed budget is presented in <strong>the</strong> following tables:FY 2013 Proposed <strong>Budget</strong> and <strong>Financial</strong> Plan<strong>Office</strong> <strong>of</strong> <strong>the</strong> Inspector GeneralA-227
FY 2013 Proposed Gross Funds Operating <strong>Budget</strong>, by Revenue TypeTable AD0-1 contains <strong>the</strong> proposed FY 2013 agency budget compared to <strong>the</strong> FY 2012 approved budget. It alsoprovides FY 2010 and FY 2011 actual expenditures.Table AD0-1(dollars in thousands)ChangeActual Actual Approved Proposed from PercentAppropriated Fund FY 2010 FY 2011 FY 2012 FY 2013 FY 2012 Change*General FundLocal Funds 14,880 12,401 13,048 13,308 261 2.0Total for General Fund 14,880 12,401 13,048 13,308 261 2.0Federal ResourcesFederal Grant Funds 1,752 1,696 2,346 2,377 31 1.3Total for Federal Resources 1,752 1,696 2,346 2,377 31 1.3Intra-District FundsIntra-District Funds 0 3 0 0 0 N/ATotal for Intra-District Funds 0 3 0 0 0 N/AGross Funds 16,632 14,100 15,393 15,686 292 1.9*Percent change is based on whole dollars.Note: If applicable, for a breakdown <strong>of</strong> each Grant (Federal and Private), Special Purpose Revenue type and Intra-District agreement,please refer to Schedule 80 <strong>Agency</strong> Summary by Revenue Source in <strong>the</strong> FY 2013 Operating Appendices located on <strong>the</strong> <strong>Office</strong> <strong>of</strong> <strong>the</strong><strong>Chief</strong> <strong>Financial</strong> <strong>Office</strong>r’s website.FY 2013 Proposed Full-Time Equivalents, by Revenue TypeTable AD0-2 contains <strong>the</strong> proposed FY 2013 FTE level compared to <strong>the</strong> FY 2012 approved FTE level by revenuetype. It also provides FY 2010 and FY 2011 actual data.Table AD0-2ChangeActual Actual Approved Proposed from PercentAppropriated Fund FY 2010 FY 2011 FY 2012 FY 2013 FY 2012 ChangeGeneral FundLocal Funds 99.5 89.1 94.8 94.8 0.0 0.0Total for General Fund 99.5 89.1 94.8 94.8 0.0 0.0Federal ResourcesFederal Grant Funds 14.5 17.2 17.2 17.2 0.0 0.0Total for Federal Resources 14.5 17.2 17.2 17.2 0.0 0.0Total Proposed FTEs 114.0 106.3 112.0 112.0 0.0 0.0<strong>Office</strong> <strong>of</strong> <strong>the</strong> Inspector GeneralA-228FY 2013 Proposed <strong>Budget</strong> and <strong>Financial</strong> Plan
FY 2013 Proposed Operating <strong>Budget</strong>, by Comptroller Source GroupTable AD0-3 contains <strong>the</strong> proposed FY 2013 budget at <strong>the</strong> Comptroller Source Group (object class) level comparedto <strong>the</strong> FY 2012 approved budget. It also provides FY 2010 and FY 2011 actual expenditures.Table AD0-3(dollars in thousands)ChangeActual Actual Approved Proposed from PercentComptroller Source Group FY 2010 FY 2011 FY 2012 FY 2013 FY 2012 Change*11 - Regular Pay - Continuing Full Time 8,769 8,504 9,524 9,565 41 0.413 - Additional Gross Pay 169 53 0 0 0 N/A14 - Fringe Benefits - Current Personnel 1,647 1,616 1,942 2,121 179 9.215 - Overtime Pay 0 2 0 0 0 N/ASubtotal Personal Services (PS) 10,584 10,175 11,466 11,686 220 1.920 - Supplies and Materials 12 7 30 31 1 2.030 - Energy, Comm. and Building Rentals 0 1 1 1 0 0.031 - Telephone, Telegraph, Telegram, Etc. 76 19 13 13 0 0.032 - Rentals - Land and Structures 1,403 228 228 228 0 0.035 - Occupancy Fixed Costs 9 1 1 1 0 0.040 - O<strong>the</strong>r Services and Charges 3,881 3,411 3,406 3,478 72 2.141 - Contractual Services - O<strong>the</strong>r 599 0 0 0 0 N/A50 - Subsidies and Transfers 0 1 236 236 0 0.070 - Equipment and Equipment Rental 70 256 13 13 0 0.0Subtotal Nonpersonal Services (NPS) 6,048 3,925 3,927 4,000 73 1.8Gross Funds 16,632 14,100 15,393 15,686 292 1.9*Percent change is based on whole dollars.FY 2013 Proposed <strong>Budget</strong> and <strong>Financial</strong> Plan<strong>Office</strong> <strong>of</strong> <strong>the</strong> Inspector GeneralA-229
Program DescriptionThe <strong>Office</strong> <strong>of</strong> <strong>the</strong> Inspector General operates through <strong>the</strong> following 3 programs:Accountability, Control, and Compliance - provides audits and inspections <strong>of</strong> and for <strong>the</strong> District governmentthat focus efforts on mitigating risks that pose <strong>the</strong> most serious challenges to District agencies and o<strong>the</strong>r stakeholders.Through this work, District government entities can better maintain fiscal integrity and operational readinessto reduce fraud, waste, and mismanagement.This program contains <strong>the</strong> following 2 activities:■ Audit – conducts audits, reviews and analysis <strong>of</strong> financial, operational, and programmatic functions; and■ Inspections and Evaluations – is responsible for inspections and evaluations <strong>of</strong> District agencies in accordancewith defined performance criteria. Management and programs are evaluated, and recommendations are maderelating to improving overall efficiency and effectiveness.Law Enforcement and Compliance – conducts investigations <strong>of</strong> allegations <strong>of</strong> waste, fraud, and abuse relating to<strong>the</strong> programs and operations <strong>of</strong> <strong>the</strong> District government.This program contains <strong>the</strong> following 3 activities:■ Investigations – investigates fraud and o<strong>the</strong>r misconduct by District government employees and contractorsdoing business with <strong>the</strong> District <strong>of</strong> Columbia;■ Medicaid Fraud Control Unit (MFCU) 25% Match – represents <strong>the</strong> Local match associated with <strong>the</strong> MFCUFederal Grant; and■ Medicaid Fraud Control Unit – investigates and prosecutes cases <strong>of</strong> patient abuse and neglect and cases <strong>of</strong>Medicaid fraud by health care providers.<strong>Agency</strong> Management – provides for administrative support and <strong>the</strong> required tools to achieve operational and programmaticresults. This program is standard for all agencies using performance-based budgeting.Program Structure ChangeThe <strong>Office</strong> <strong>of</strong> <strong>the</strong> Inspector General has no program structure changes in <strong>the</strong> FY 2013 proposed budget.<strong>Office</strong> <strong>of</strong> <strong>the</strong> Inspector GeneralA-230FY 2013 Proposed <strong>Budget</strong> and <strong>Financial</strong> Plan
FY 2013 Proposed Operating <strong>Budget</strong> and FTEs, by Program and ActivityTable AD0-4 contains <strong>the</strong> proposed FY 2013 budget by program and activity compared to <strong>the</strong> FY 2012 approvedbudget. It also provides <strong>the</strong> FY 2011 actual data.Table AD0-4(dollars in thousands)Dollars in ThousandsFull-Time EquivalentsChangeChangeActual Approved Proposed from Actual Approved Proposed fromProgram/Activity FY 2011 FY 2012 FY 2013 FY 2012 FY 2011 FY 2012 FY 2013 FY 2012(1000) <strong>Agency</strong> Management(1010) Personnel 306 220 225 5 1.3 1.5 1.5 0.0(1020) Contracting and Procurement 227 287 323 36 2.2 2.5 2.5 0.0(1030) Property Management 14 36 36 0 0.0 0.0 0.0 0.0(1040) Information Technology 653 422 433 11 3.2 3.5 3.5 0.0(1050) <strong>Financial</strong> Management 261 288 298 10 2.2 2.5 2.5 0.0(1060) Legal 640 662 676 15 5.0 5.5 5.5 0.0(1070) Fleet Management 9 5 8 2 0.0 0.0 0.0 0.0(1085) Customer Service 111 109 112 4 1.2 1.3 1.3 0.0Subtotal (1000) <strong>Agency</strong> Management 2,221 2,028 2,111 83 15.1 16.6 16.6 0.0(2000) Accountability, Control, and Compliance(2010) Audit 5,951 6,158 6,247 89 31.4 31.5 31.5 0.0(2020) Investigations 11 0 0 0 0.0 0.0 0.0 0.0(2030) Inspections and Evaluations 1,252 1,375 1,400 25 13.2 13.5 13.5 0.0Subtotal (2000) Accountability, Control, and Compliance 7,215 7,533 7,647 114 44.6 45.0 45.0 0.0(3000) Law Enforcement and Compliance(3010) Investigations 2,488 2,868 2,918 50 24.1 27.5 27.5 0.0(3020) Medicaid Fraud Control Unit 25% Match 480 618 633 14 5.2 5.8 5.8 0.0(3030) Medicaid Fraud Control Unit 1,696 2,346 2,377 31 17.2 17.2 17.2 0.0Subtotal (3000) Law Enforcement and Compliance 4,664 5,832 5,928 96 46.6 50.5 50.5 0.0Total Proposed Operating <strong>Budget</strong> 14,100 15,393 15,686 292 106.3 112.0 112.0 0.0(Change is calculated by whole numbers and numbers may not add up due to rounding)Note: For more detailed information regarding <strong>the</strong> proposed funding for <strong>the</strong> activities within this agency’s programs, please see Schedule 30-PBBProgram Summary by Activity in <strong>the</strong> FY 2013 Operating Appendices located on <strong>the</strong> <strong>Office</strong> <strong>of</strong> <strong>the</strong> <strong>Chief</strong> <strong>Financial</strong> <strong>Office</strong>r’s website.FY 2013 Proposed <strong>Budget</strong> and <strong>Financial</strong> Plan<strong>Office</strong> <strong>of</strong> <strong>the</strong> Inspector GeneralA-231
FY 2013 Proposed <strong>Budget</strong> ChangesThe <strong>Office</strong> <strong>of</strong> <strong>the</strong> Inspector General’s (OIG) proposed FY 2013 gross budget is $15,685,662, which represents a1.9 percent increase over its FY 2012 approved gross budget <strong>of</strong> $15,393,352. The budget is comprised <strong>of</strong>$13,308,492 in Local funds and $2,377,170 in Federal Grant funds.Current Services Funding LevelThe Current Services Funding Level (CSFL) is a Local funds ONLY representation <strong>of</strong> <strong>the</strong> true cost <strong>of</strong> operatingDistrict agencies, before consideration <strong>of</strong> policy decisions. The CSFL reflects changes from <strong>the</strong> FY 2012 approvedbudget across multiple programs, and it estimates how much it would cost an agency to continue its current programsand operations into <strong>the</strong> following fiscal year. The initial adjustments in <strong>the</strong> budget proposal representchanges that should be compared to <strong>the</strong> FY 2013 CSFL budget and not necessarily changes made to <strong>the</strong> FY 2012Local funds budget. The FY 2013 CSFL adjustments to <strong>the</strong> FY 2012 Local funds budget are described in table 5<strong>of</strong> this agency's budget chapter. Please see <strong>the</strong> CSFL Development section within Volume 1: Executive Summaryfor more information regarding <strong>the</strong> methodology used and components that comprise <strong>the</strong> CSFL.OIG’s FY 2013 CSFL budget is $13,269,486, which represents a $221,954, or 1.7 percent, increase over <strong>the</strong>FY 2012 approved Local funds budget <strong>of</strong> $13,047,532.Initial Adjusted <strong>Budget</strong>Cost Increase: Local funds - OIG increased Salaries by $276 and Fringe Benefits by $161 in support <strong>of</strong> projectedstep increases. Federal Grant funds - OIG increased Fringe Benefits by $18,612; O<strong>the</strong>r Services and Charges by$12,555 for additional <strong>of</strong>fice support; Supplies and Materials by $157; and Energy, Communications, andBuilding Rentals by $25.Cost Decrease: Local funds - OIG reduced O<strong>the</strong>r Services and Charges by $412 and Energy, Communication,and Building Rentals by $25 to <strong>of</strong>fset increases for steps and fringe benefits.Additionally Adjusted <strong>Budget</strong>Technical Adjustments: Adjustment <strong>of</strong> Fringe Benefits to restore <strong>the</strong> District Government contribution foremployee health insurance from 72 percent, implemented in <strong>the</strong> FY 2011 budget, to 75 percent in FY 2013, resultingin an increase <strong>of</strong> $39,006 to OIG’s Local Funds and $5,372 to Federal Grant funds.Additional Adjustments: Federal Grant funds – O<strong>the</strong>r Services and Charges was reduced by $5,372 in <strong>of</strong>fice supportto <strong>of</strong>fset <strong>the</strong> cost <strong>of</strong> <strong>the</strong> health insurance contribution.<strong>Office</strong> <strong>of</strong> <strong>the</strong> Inspector GeneralA-232FY 2013 Proposed <strong>Budget</strong> and <strong>Financial</strong> Plan
FY 2012 Approved <strong>Budget</strong> to FY 2013 Proposed <strong>Budget</strong>, by Revenue TypeTable AD0-5 itemizes <strong>the</strong> changes by revenue type between <strong>the</strong> FY 2012 approved budget and <strong>the</strong> FY 2013 proposedbudget.Table AD0-5(dollars in thousands)PROGRAM BUDGET FTELOCAL FUNDS: FY 2012 Approved <strong>Budget</strong> and FTE 13,048 94.8Fringe Benefit Rate Adjustment Multiple Programs 116 0.0Consumer Price Index Multiple Programs 66 0.0Personal Services Growth Factor Multiple Programs 41 0.0FY 2013 Current Services Funding Level <strong>Budget</strong> (CSFL) 13,269 94.8Cost Increase: Adjust salaries with projected step Multiple Programs 0 0.0increases (less than $500)Cost Increase: Align fringe benefits with projected Multiple Programs 0 0.0costs (less than $500)Cost Decrease: Reduce O<strong>the</strong>r Services and Charges Multiple Programs 0 0.0(less than $500)Cost Decrease: Reduce Energy, Comm., and Building Rentals Law Enforcement and Compliance 0 0.0(less than $500)FY 2013 Initial Adjusted <strong>Budget</strong> 13,269 94.8Technical Adjustment: Health insurance contribution Multiple Programs 39 0.0FY 2013 Additionally Adjusted <strong>Budget</strong> 13,308 94.8LOCAL FUNDS: FY 2013 Proposed <strong>Budget</strong> and FTE 13,308 94.8FEDERAL GRANT FUNDS: FY 2012 Approved <strong>Budget</strong> and FTE 2,346 17.2Cost Increase: Align fringe benefits with projected costs Law Enforcement and Compliance 19 0.0Cost Increase: Increase O<strong>the</strong>r Services and Charges Law Enforcement and Compliance 13 0.0Cost Increase: Increase Supplies and Materials Law Enforcement and Compliance 0 0.0(less than $500)Cost Increase: Increase Energy, Comm. and Building Rentals Law Enforcement and Compliance 0 0.0(less than $500)FY 2013 Initial Adjusted <strong>Budget</strong> 2,377 17.2Additional Adjustments: Reduced O<strong>the</strong>r Services and Law Enforcement and Compliance -5 0.0Charges to <strong>of</strong>fset Health insurance contributionTechnical Adjustment: Health insurance contribution Multiple Programs 5 0.0FY 2013 Additionally Adjusted <strong>Budget</strong> 2,377 17.2FEDERAL GRANT FUNDS: FY 2013 Proposed <strong>Budget</strong> and FTE 2,377 17.2Gross for AD0 - <strong>Office</strong> <strong>of</strong> <strong>the</strong> Inspector General 15,686 112.0(Change is calculated by whole numbers and numbers may not add up due to rounding)FY 2013 Proposed <strong>Budget</strong> and <strong>Financial</strong> Plan<strong>Office</strong> <strong>of</strong> <strong>the</strong> Inspector GeneralA-233
<strong>Agency</strong> Performance PlanThe agency’s performance plan has <strong>the</strong> following objectives for FY 2013:Objective 1: Use <strong>the</strong> Accountability, Control, and Compliance program to conduct audits and inspections for <strong>the</strong>District government, focusing efforts on mitigating risks that pose <strong>the</strong> most serious challenges to District agenciesand o<strong>the</strong>r stakeholders.Objective 2: Use <strong>the</strong> Law Enforcement and Compliance program to conduct investigations into allegations <strong>of</strong>waste, fraud, and abuse relating to <strong>the</strong> programs and operations <strong>of</strong> <strong>the</strong> District Government.<strong>Agency</strong> Performance MeasuresFY 2010 FY 2011 FY 2011 FY 2012 FY 2013 FY 2014Measure Actual Target Actual Projection Projection ProjectionNumber <strong>of</strong> final audit reports issued(financial/performance) 28 28 28 28 28 28Potential monetary benefits resultingfrom audits (dollars in millions) 25.8 25.8 28.2 38 21 21Number <strong>of</strong> final inspection/evaluationreports issued 10 10 11 10 10 10Percentage <strong>of</strong> complaints evaluated within10 days <strong>of</strong> receipt in Investigations 99% 85% 96% 85% 85% 85%Number <strong>of</strong> criminal/civil resolutionsobtained in MFCU cases 26 20 27 22 24 26<strong>Office</strong> <strong>of</strong> <strong>the</strong> Inspector GeneralA-234FY 2013 Proposed <strong>Budget</strong> and <strong>Financial</strong> Plan
<strong>Office</strong> <strong>of</strong> <strong>the</strong> <strong>Chief</strong> <strong>Financial</strong> <strong>Office</strong>r(AT0)www.cfo.dc.govTelephone: 202-727-2476% ChangeFY 2011 FY 2012 FY 2013 fromDescription Actual Approved Proposed FY 2012Operating <strong>Budget</strong> $112,882,948 $127,365,574 $136,512,769 7.2FTEs 900.9 869.0 888.0 2.2The mission <strong>of</strong> <strong>the</strong> <strong>Office</strong> <strong>of</strong> <strong>the</strong> <strong>Chief</strong> <strong>Financial</strong> <strong>Office</strong>r (OCFO) isto provide financial management services to <strong>the</strong> government and <strong>the</strong>people <strong>of</strong> <strong>the</strong> District <strong>of</strong> Columbia to sustain long-term fiscal and economicviability.Summary <strong>of</strong> ServicesThe <strong>Office</strong> <strong>of</strong> <strong>the</strong> <strong>Chief</strong> <strong>Financial</strong> <strong>Office</strong>r provides enhanced fiscal and financial stability, accountability, and integrityfor <strong>the</strong> Government <strong>of</strong> <strong>the</strong> District <strong>of</strong> Columbia. The OCFO ensures that District spending levels remain withinapproved budgets and available revenues for each fiscal year so that spending deficits do not occur; maintainsadequate cash balances; minimizes receivables balances; manages <strong>the</strong> District's debt and finances in a manner thatprovides optimal opportunities to maximize bond ratings and minimize <strong>the</strong> cost <strong>of</strong> borrowed capital; ensures that<strong>the</strong> ratio <strong>of</strong> total debt service to General Fund expenditures remains within a maximum <strong>of</strong> 12 percent; improvestax payment compliance by increasing collections from <strong>the</strong> accounts receivable balance and <strong>the</strong> non-filer population,as measured by percentage change in delinquent collections; develops and supports financial management systemsthat provide accurate and timely information; and produces <strong>the</strong> District's Comprehensive Annual <strong>Financial</strong>Report (CAFR) on time with an unqualified clean opinion.The agency’s FY 2013 proposed budget is presented in <strong>the</strong> following tables:FY 2013 Proposed <strong>Budget</strong> and <strong>Financial</strong> Plan<strong>Office</strong> <strong>of</strong> <strong>the</strong> <strong>Chief</strong> <strong>Financial</strong> <strong>Office</strong>rA-235
FY 2013 Proposed Gross Funds Operating <strong>Budget</strong>, by Revenue TypeTable AT0-1 contains <strong>the</strong> proposed FY 2013 agency budget compared to <strong>the</strong> FY 2012 approved budget. It alsoprovides FY 2010 and FY 2011 actual expenditures.Table AT0-1(dollars in thousands)ChangeActual Actual Approved Proposed from PercentAppropriated Fund FY 2010 FY 2011 FY 2012 FY 2013 FY 2012 Change*General FundLocal Funds 115,213 87,779 94,642 100,306 5,664 6.0Special Purpose Revenue Funds 15,154 16,329 24,932 29,140 4,208 16.9Total for General Fund 130,367 104,108 119,574 129,445 9,872 8.3Federal ResourcesFederal Grant Funds 950 1,025 0 0 0 N/ATotal for Federal Resources 950 1,025 0 0 0 N/APrivate FundsPrivate Donations 9 18 0 0 0 N/ATotal for Private Funds 9 18 0 0 0 N/AIntra-District FundsIntra-District Funds 8,631 7,731 7,792 7,067 -725 -9.3Total for Intra-District Funds 8,631 7,731 7,792 7,067 -725 -9.3Gross Funds 139,957 112,883 127,366 136,513 9,147 7.2*Percent change is based on whole dollars.Note: If applicable, for a breakdown <strong>of</strong> each Grant (Federal and Private), Special Purpose Revenue type and Intra-District agreement,please refer to Schedule 80 <strong>Agency</strong> Summary by Revenue Source in <strong>the</strong> FY 2013 Operating Appendices located on <strong>the</strong> <strong>Office</strong> <strong>of</strong> <strong>the</strong><strong>Chief</strong> <strong>Financial</strong> <strong>Office</strong>r’s website.<strong>Office</strong> <strong>of</strong> <strong>the</strong> <strong>Chief</strong> <strong>Financial</strong> <strong>Office</strong>rA-236FY 2013 Proposed <strong>Budget</strong> and <strong>Financial</strong> Plan
FY 2013 Proposed Full-Time Equivalents, by Revenue TypeTable AT0-2 contains <strong>the</strong> proposed FY 2013 FTE level compared to <strong>the</strong> FY 2012 approved FTE level by revenuetype. It also provides FY 2010 and FY 2011 actual data.Table AT0-2ChangeActual Actual Approved Proposed from PercentAppropriated Fund FY 2010 FY 2011 FY 2012 FY 2013 FY 2012 ChangeGeneral FundLocal Funds 748.0 719.6 782.5 805.5 23.0 2.9Special Purpose Revenue Funds 135.2 138.4 41.0 44.0 3.0 7.3Total for General Fund 883.1 858.0 823.5 849.5 26.0 3.2Intra-District FundsIntra-District Funds 42.6 43.0 45.5 38.5 -7.0 -15.4Total for Intra-District Funds 42.6 43.0 45.5 38.5 -7.0 -15.4Total Proposed FTEs 925.8 900.9 869.0 888.0 19.0 2.2FY 2013 Proposed <strong>Budget</strong> and <strong>Financial</strong> Plan<strong>Office</strong> <strong>of</strong> <strong>the</strong> <strong>Chief</strong> <strong>Financial</strong> <strong>Office</strong>rA-237
FY 2013 Proposed Operating <strong>Budget</strong>, by Comptroller Source GroupTable AT0-3 contains <strong>the</strong> proposed FY 2013 budget at <strong>the</strong> Comptroller Source Group (object class) level comparedto <strong>the</strong> FY 2012 approved budget. It also provides FY 2010 and FY 2011 actual expenditures.Table AT0-3(dollars in thousands)ChangeActual Actual Approved Proposed from PercentComptroller Source Group FY 2010 FY 2011 FY 2012 FY 2013 FY 2012 Change*11 - Regular Pay - Continuing Full Time 69,209 65,709 69,013 70,158 1,145 1.712 - Regular Pay - O<strong>the</strong>r 570 459 477 963 485 101.613 - Additional Gross Pay 275 686 0 0 0 N/A14 - Fringe Benefits - Current Personnel 13,804 13,663 15,158 17,020 1,862 12.315 - Overtime Pay 389 204 0 25 25 N/ASubtotal Personal Services (PS) 84,247 80,721 84,649 88,166 3,517 4.220 - Supplies and Materials 494 456 542 521 -21 -3.830 - Energy, Comm. and Building Rentals 384 -3 0 0 0 N/A31 - Telephone, Telegraph, Telegram, Etc. 746 43 0 0 0 N/A32 - Rentals - Land and Structures 20,136 0 0 0 0 N/A33 - Janitorial Services 170 0 0 0 0 N/A34 - Security Services 630 0 0 0 0 N/A35 - Occupancy Fixed Costs 276 0 0 0 0 N/A40 - O<strong>the</strong>r Services and Charges 7,119 6,473 6,485 8,379 1,894 29.241 - Contractual Services - O<strong>the</strong>r 24,692 24,686 35,065 38,802 3,736 10.770 - Equipment and Equipment Rental 1,063 507 624 645 21 3.3Subtotal Nonpersonal Services (NPS) 55,710 32,162 42,717 48,347 5,630 13.2Gross Funds 139,957 112,883 127,366 136,513 9,147 7.2*Percent Change is based on whole dollars.<strong>Office</strong> <strong>of</strong> <strong>the</strong> <strong>Chief</strong> <strong>Financial</strong> <strong>Office</strong>rA-238FY 2013 Proposed <strong>Budget</strong> and <strong>Financial</strong> Plan
Program DescriptionThe <strong>Office</strong> <strong>of</strong> <strong>the</strong> <strong>Chief</strong> <strong>Financial</strong> <strong>Office</strong>r operates through <strong>the</strong> following 9 programs:<strong>Financial</strong> Operations and Systems – carries out <strong>the</strong> District’s accounting operations, including critical functionssuch as District-wide general ledger accounting, financial reporting, and pay and retirement services. The programproduces <strong>the</strong> CAFR, which shows <strong>the</strong> District’s financial position at <strong>the</strong> end <strong>of</strong> each fiscal year. The program alsodevelops accounting policies and procedures, policies that support <strong>the</strong> System <strong>of</strong> Accounting and Reporting(SOAR), <strong>the</strong> District’s formal book <strong>of</strong> record, and policies and procedures for o<strong>the</strong>r areas <strong>of</strong> financial managementthroughout <strong>the</strong> OCFO.This program contains <strong>the</strong> following 7 activities:■ Operations and Administration – provides leadership, general program management, personnel, procurement,automated accounting system access security, fixed asset accountability, and o<strong>the</strong>r logistical support services toOFOS staff for general accounting services, specialized accounting systems management, payroll, financialreporting, accounting policies and procedures, and benefits administration for employees, agencies, and Districtleaders for <strong>the</strong>ir use in decision-making. Additionally, this activity provides citizens with financial informationso that <strong>the</strong>y can keep abreast <strong>of</strong> <strong>the</strong> District’s financial position;■ Accounting Operations – provides District-wide General Ledger accounting in order to maintain <strong>the</strong> <strong>of</strong>ficialautomated book <strong>of</strong> record on which <strong>the</strong> financial position <strong>of</strong> <strong>the</strong> District ascertained by <strong>the</strong> District’s electedand appointed leaders, Congress, District agencies (directors, financial managers, and employees), public andprivate financial communities, and <strong>the</strong> general public. This activity ensures timely and accurate information on<strong>the</strong> District’s financial position and facilities to decision-makers;■ <strong>Financial</strong> Policy and Procedures – provides recorded references for standard government accounting practices(policies and <strong>the</strong>ories) and guidelines for operation (procedures and process flows) <strong>of</strong> <strong>the</strong> District’s dailyaccounting functions and <strong>the</strong> supporting automated system <strong>of</strong> record to ensure that accounting and financialmanagers and <strong>the</strong>ir staff follow <strong>the</strong> District’s financial policy and procedures;■ Accounting Systems Management/Functional Integration – provides training and expert assistance on <strong>the</strong>automated accounting system, which follows Generally Accepted Accounting Principles, for <strong>the</strong> central OCFOcluster employees and agency financial staff to improve <strong>the</strong> daily recordings <strong>of</strong> accounting transactions and <strong>the</strong>reporting <strong>of</strong> financial position within each agency by activity;■ <strong>Financial</strong> Control and Reporting – provides statements <strong>of</strong> financial position for <strong>the</strong> Mayor, Council <strong>of</strong> <strong>the</strong>District <strong>of</strong> Columbia, Congress, District managers, national bond-rating agencies, and <strong>the</strong> general public toenable informed decisions based on timely and accurate financial information;■ Federal Annuitant Benefits Administration – provides accurate and timely annuity payments and related benefitsto former and retired Federal law enforcement <strong>of</strong>ficers; and■ Payroll Disbursements and Wage Reporting – provides a record <strong>of</strong> compensation and related payments toDistrict employees with accurate and timely paychecks.<strong>Budget</strong> Development and Execution – provides for <strong>the</strong> preparation, monitoring, analysis, and execution <strong>of</strong> <strong>the</strong>District government's budget, including operating, capital, and enterprise funds, in a manner that facilitates fiscalintegrity and maximizes services to taxpayers. This program also provides advice to policy-makers on <strong>the</strong> Districtgovernment's budget and has <strong>the</strong> primary responsibility for expenditure forecasts.This program contains <strong>the</strong> following 4 activities:■ Executive Direction and Support – provides general program management, leadership, technical assistance,and support services to <strong>the</strong> <strong>Office</strong> <strong>of</strong> <strong>Budget</strong> and Planning (OBP) staff and o<strong>the</strong>r District government personnelfacilitating financial planning, budgetary, performance, and cost analysis <strong>of</strong> decision-makers to enable <strong>the</strong>mto make effective decisions and achieve strategic goals. It also provides citizens with information on Districtfinances;FY 2013 Proposed <strong>Budget</strong> and <strong>Financial</strong> Plan<strong>Office</strong> <strong>of</strong> <strong>the</strong> <strong>Chief</strong> <strong>Financial</strong> <strong>Office</strong>rA-239
■■■<strong>Financial</strong> Planning and Analysis – provides monitoring and analysis <strong>of</strong> <strong>the</strong> District’s budget and expenditures,including spending pressures, staffing for <strong>the</strong> District’s Anti-Deficiency Board, and guidance, development, andcoordination <strong>of</strong> <strong>the</strong> District’s <strong>Financial</strong> Review Process, budget modification process, intra-District fund transferprocess, and o<strong>the</strong>r reporting functions;Operating <strong>Budget</strong> Formulation and Development – provides for <strong>the</strong> formulation and execution processes <strong>of</strong> <strong>the</strong>District’s annual operating budget, as well as o<strong>the</strong>r financial and budgetary services, to <strong>the</strong> Mayor and Councilon a timely and accurate basis enabling District <strong>of</strong>ficials to make informed decisions on allocations <strong>of</strong> <strong>the</strong>District operating resources among policy priorities; andCapital <strong>Budget</strong> Formulation and Development – provides detailed reviews <strong>of</strong> available capital financing andaligns such financing with <strong>the</strong> District’s annual capital funds budget authority, and provides o<strong>the</strong>r financial andbudgetary services to <strong>the</strong> Mayor and Council on a timely and accurate basis to enable <strong>the</strong>m to make informeddecisions on District capital resources.Research and Analysis – provides revenue estimates, revenue policy analysis, and analysis supporting economicdevelopment. The program area is divided into two <strong>of</strong>fices, both <strong>of</strong> which report directly to <strong>the</strong> CFO: <strong>the</strong> <strong>Office</strong><strong>of</strong> Revenue Analysis (ORA) and Economic Development Finance (EDF).ORA services include <strong>the</strong> preparation <strong>of</strong> (i) analyses <strong>of</strong> revenue sources and development <strong>of</strong> quarterly revenueestimates that set <strong>the</strong> hard budget constraint for <strong>the</strong> District <strong>of</strong> Columbia budget; (ii) fiscal impact statements,which provide estimates <strong>of</strong> direct costs to <strong>the</strong> four-year financial plan; (iii) periodic reports on economic and revenuetrends and <strong>the</strong> monthly Economic Indicators for <strong>the</strong> District <strong>of</strong> Columbia; (iv) <strong>the</strong> chapter on revenue in eachannual <strong>Budget</strong> and <strong>Financial</strong> Plan that is prepared by <strong>the</strong> District <strong>of</strong> Columbia; and (v) special studies, includingon metropolitan and nationwide household tax burden comparisons, a bi-annual Tax Expenditure Study detail onstatutory provisions <strong>of</strong> District taxes, a running historical update <strong>of</strong> major changes in District revenue laws, anAnnual Revenue Data Book, <strong>the</strong> monthly Cash Report <strong>of</strong> District tax collections and, in FY 2010, a system for<strong>the</strong> overall tracking <strong>of</strong> <strong>the</strong> American Recovery and Reinvestment Act <strong>of</strong> 2010 (ARRA).EDF provides sophisticated analyses <strong>of</strong> fiscal, economic, financial, and administrative impacts <strong>of</strong> proposed projects;analyzes <strong>the</strong> financial feasibility <strong>of</strong> economic development projects in <strong>the</strong> District; and advises <strong>the</strong> CFO andMayor on proposed economic development debt issuances. EDF oversees all Tax Increment Financing (TIF) andPayment-in-lieu-<strong>of</strong>-Taxes (PILOT) projects into which <strong>the</strong> District enters. EDF provides guidance on changes indevelopment policy options and long-term financial expectations. EDF coordinates with ORA to provide fiscalimpact analyses on proposed tax-supported financings, land transfers, and economic development projects. EDFrepresents <strong>the</strong> OCFO on <strong>the</strong> boards <strong>of</strong> <strong>the</strong> Washington Convention and Sports Authority and Destination D.C.This program contains <strong>the</strong> following 6 activities:■ Executive Direction and Support – provides general program management, leadership, technical assistance,and support services to staff including research and analytical services on revenue and economic data and analysis<strong>of</strong> fiscal and administrative impacts to decision-makers;■ <strong>Financial</strong> Data Quality Assurance – ensures accuracy <strong>of</strong> reported data;■ Revenue Estimation – provides economic and revenue data and analysis and District tax structure data andanalysis to <strong>the</strong> Mayor, Council, and Congress so that <strong>the</strong>y have timely and quality information for policy formulationand decision-making;■ Economic Development – provides analysis <strong>of</strong> <strong>the</strong> fiscal, economic, financial, and administrative impact onreal estate projects to <strong>the</strong> <strong>Chief</strong> <strong>Financial</strong> <strong>Office</strong>r, <strong>the</strong> Mayor, <strong>the</strong> Deputy Mayor for Planning and EconomicDevelopment, and <strong>the</strong> Council so that <strong>the</strong>y can effectively assess economic development initiatives and ensuremaximum economic benefit to <strong>the</strong> city;■ Legislative and Fiscal Analysis – provides legislative fiscal impact analysis for <strong>the</strong> Mayor, <strong>the</strong> Council, andCongress so that <strong>the</strong>y can have timely and quality information for policy formulation and decision-making;and<strong>Office</strong> <strong>of</strong> <strong>the</strong> <strong>Chief</strong> <strong>Financial</strong> <strong>Office</strong>rA-240FY 2013 Proposed <strong>Budget</strong> and <strong>Financial</strong> Plan
■Economic Affairs – develops and presents documents detailing <strong>the</strong> economic and revenue affairs <strong>of</strong> <strong>the</strong> District<strong>of</strong> Columbia to components <strong>of</strong> <strong>the</strong> OCFO, <strong>the</strong> Mayor, <strong>the</strong> Council, and Congress so that all have timely andquality information for policy formulation and decision-making.Tax Administration – provides fair, efficient, and effective administration <strong>of</strong> <strong>the</strong> District's business, income, excise,and real property tax laws.This program contains <strong>the</strong> following 7 activities:■ Executive Direction and Support – provides general program management, leadership and support services to<strong>the</strong> Tax Administration program so that it can coordinate comprehensive tax services to District taxpayers andensure that <strong>the</strong> District is collecting <strong>the</strong> accurate amount <strong>of</strong> tax revenue;■ External Customer Service, Information, and Education – provides customer service through walk-in and telephonecustomer service centers, which assist approximately 300,000 taxpayers annually. This activity also consists<strong>of</strong> <strong>the</strong> development and distribution <strong>of</strong> public tax forms, support <strong>of</strong> various electronic tax filing and paymentoptions, including electronic self-service and account management functions, initiating and respondingto mail correspondence with taxpayers, and tax registration and certification services;■ Recorder <strong>of</strong> Deeds – provides support for <strong>the</strong> transfer and titling <strong>of</strong> real property in <strong>the</strong> District, and respondsto requests for title documents from individuals and <strong>the</strong> real estate and real estate title industries;■ Real Property Tax Administration – provides for <strong>the</strong> assessment and billing <strong>of</strong> real property taxes and first-levelassessment appeals;■ Tax Audits and Investigations – enforces tax compliance by identifying potential non-filers and performingo<strong>the</strong>r tax compliance checks to ensure that <strong>the</strong> District is collecting <strong>the</strong> correct amount <strong>of</strong> tax payments duefrom all taxpayers. This activity also identifies and investigates cases <strong>of</strong> tax fraud;■ Revenue Accounting – provides for <strong>the</strong> proper accounting <strong>of</strong> and reporting on revenue collections, and supportsissuance <strong>of</strong> tax refunds; and■ Receipts and Delinquent Collections – provides for <strong>the</strong> processing <strong>of</strong> more than one million tax returns annually,and <strong>the</strong> recording and prompt deposit <strong>of</strong> billions <strong>of</strong> dollars in tax payments. This includes collections <strong>of</strong>delinquent tax payments.Information Technology (IT) – provides for <strong>the</strong> development and maintenance <strong>of</strong> state-<strong>of</strong>-<strong>the</strong>-art financial informationsystems to support <strong>the</strong> District <strong>of</strong> Columbia’s payroll, pension, accounting, tax, and budget, treasury, andweb-based financial reporting systems. The principal objectives <strong>of</strong> <strong>the</strong> program are to maintain accurate systems,modify systems in response to <strong>the</strong> changing needs <strong>of</strong> <strong>the</strong> District, and maintain compliance with federal, state, andlocal regulations.<strong>Office</strong> <strong>of</strong> Finance and Treasury (OFT) – provides management <strong>of</strong> <strong>the</strong> financial assets and liabilities <strong>of</strong> <strong>the</strong>Government <strong>of</strong> <strong>the</strong> District <strong>of</strong> Columbia. This includes investing, collecting, safe-keeping, disbursing, recording,and acquiring District financial resources.This program contains <strong>the</strong> following 6 activities:■ Executive Direction and Support – provides leadership, strategic direction, and administrative support servicesto department managers and employees so that <strong>the</strong>y can achieve organizational and individual performanceresults;■ Debt and Grants Management – provides for <strong>the</strong> issuance <strong>of</strong> bonds, notes, and o<strong>the</strong>r financing vehicles for<strong>the</strong> District so that it can finance capital infrastructure projects and help ensure seasonal cash needs, and manages<strong>the</strong> cash and accounting <strong>of</strong> District agencies’ federal grant draw-downs;■ Cash Management and Investment – provides for <strong>the</strong> management <strong>of</strong> <strong>the</strong> cash resources <strong>of</strong> <strong>the</strong> District so thatFY 2013 Proposed <strong>Budget</strong> and <strong>Financial</strong> Plan<strong>Office</strong> <strong>of</strong> <strong>the</strong> <strong>Chief</strong> <strong>Financial</strong> <strong>Office</strong>rA-241
■■■<strong>the</strong> District can meet its cash obligations and maximize its return on investments;Asset Management – provides for <strong>the</strong> management <strong>of</strong> <strong>the</strong> District-run pension plans, college savings plan, andunclaimed property;Disbursement Management – provides check-printing and disbursement services for District agencies so that<strong>the</strong>y can fulfill <strong>the</strong>ir payment obligations; andCash Receipts and Accounting – provides revenue collection services, including cashiering at various Districtsites, and provides for <strong>the</strong> management <strong>of</strong> banking services for all District agencies.<strong>Office</strong> <strong>of</strong> Integrity and Oversight (OIO) – ensures <strong>the</strong> maintenance <strong>of</strong> <strong>the</strong> accountability, integrity, and efficiency<strong>of</strong> <strong>the</strong> District <strong>of</strong> Columbia's financial management and tax administration systems. Through its audit and investigativeactivities, OIO provides <strong>the</strong> <strong>Chief</strong> <strong>Financial</strong> <strong>Office</strong>r with independent reviews and appraisals <strong>of</strong> OCFOoperations and ensures <strong>the</strong> maintenance <strong>of</strong> <strong>the</strong> highest standards <strong>of</strong> integrity and security <strong>of</strong> OCFO employees.This program contains <strong>the</strong> following 3 activities:■ Audit Services – provides audit and review services to assist <strong>the</strong> District's financial managers to ensure <strong>the</strong>integrity, efficiency, and effectiveness <strong>of</strong> District programs; manages <strong>the</strong> review and response to external auditreports; and coordinates District single audits and management letter comments for District agencies so that<strong>the</strong>y can improve operations;■ Security Integrity Oversight – provides security and integrity oversight for <strong>the</strong> OCFO by administering <strong>the</strong>emergency response program for <strong>the</strong> OCFO and conducting integrity probes and integrity awareness presentationsaimed at detecting and preventing fraud and o<strong>the</strong>r misconduct in OCFO programs; and■ Investigations – maintains public confidence in <strong>the</strong> integrity <strong>of</strong> <strong>the</strong> OCFO by investigating alleged misconductby OCFO employees, as well as by conducting background investigations to determine suitability foremployment. This investigative service provides reports to OCFO management so that <strong>the</strong>y can take administrativeaction as appropriate.<strong>Agency</strong> Management – provides for administrative support and <strong>the</strong> required tools to achieve operational and programmaticresults. This program is standard for all agencies using performance-based budgeting.<strong>Agency</strong> <strong>Financial</strong> Operations – provides comprehensive and efficient financial management services to, and onbehalf <strong>of</strong>, District agencies so that <strong>the</strong> financial integrity <strong>of</strong> <strong>the</strong> District <strong>of</strong> Columbia is maintained. This programis standard for all agencies using performance-based budgeting.Program Structure ChangeThe <strong>Office</strong> <strong>of</strong> <strong>the</strong> <strong>Chief</strong> <strong>Financial</strong> <strong>Office</strong>r has no program structure changes in <strong>the</strong> FY 2013 proposed budget.<strong>Office</strong> <strong>of</strong> <strong>the</strong> <strong>Chief</strong> <strong>Financial</strong> <strong>Office</strong>rA-242FY 2013 Proposed <strong>Budget</strong> and <strong>Financial</strong> Plan
FY 2013 Proposed Operating <strong>Budget</strong> and FTEs, by Program and ActivityTable AT0-4 contains <strong>the</strong> proposed FY 2013 budget by program and activity compared to <strong>the</strong> FY 2012 approved budget.It also provides <strong>the</strong> FY 2011 actual data.Table AT0-4(dollars in thousands)Dollars in ThousandsFull-Time EquivalentsChangeChangeActual Approved Proposed from Actual Approved Proposed fromProgram/Activity FY 2011 FY 2012 FY 2013 FY 2012 FY 2011 FY 2012 FY 2013 FY 2012(1000) <strong>Agency</strong> Management Program((1010) Personnel 1,288 1,565 1,610 45 14.0 14.0 14.0 0.0(1015) Training and Employee Development 531 555 564 10 4.0 4.0 4.0 0.0(1020) Contracting and Procurement 2,028 1,196 1,180 -16 12.0 11.0 11.0 0.0((1030) Property Management 861 757 764 7 10.0 9.0 9.0 0.0(1060) Legal Services 1,936 2,009 2,069 60 13.9 14.0 14.0 0.0(1080) Communications 185 181 184 3 2.0 1.0 1.0 0.0(1090) Performance Management 1,100 1,224 1,344 120 9.0 8.0 8.0 0.0Subtotal (1000) <strong>Agency</strong> Management Program 7,928 7,487 7,715 228 64.7 61.0 61.0 0.0(100F) <strong>Agency</strong> <strong>Financial</strong> Operations(110F) <strong>Budget</strong> Operations 663 683 592 -92 5.0 5.0 4.0 -1.0(120F) Accounting Operations 401 368 388 20 4.0 4.0 4.0 0.0Subtotal (100F) <strong>Agency</strong> <strong>Financial</strong> Operations 1,064 1,052 980 -72 9.0 9.0 8.0 -1.0(2000) <strong>Financial</strong> Operations and Systems(2100) Operations and Administration 452 815 842 26 8.0 7.0 7.0 0.0(2200) Accounting Operations 2,063 1,955 2,044 89 21.0 18.0 18.0 0.0(2300) <strong>Financial</strong> Policies and Procedures 1004 1,067 1,071 4 4.0 8.0 8.0 0.0(2400) ASM/Functional Support 1,188 1,246 1,218 -28 0.0 9.0 9.0 0.0(2500) <strong>Financial</strong> Control and Reporting 358 1,006 1,041 34 23.9 8.0 8.0 0.0(2600) Benefits Administration 809 763 783 20 7.9 8.0 8.0 0.0(2700) Payroll Disbursements and Wage Reporting 3,366 3,859 4,174 316 32.6 34.0 34.0 0.0(2800) Accounting Systems Administration 647 0 0 0 0.0 0.0 0.0 0.0Subtotal (2000) <strong>Financial</strong> Operations and Systems 9,887 10,711 11,173 462 97.4 92.0 92.0 0.0(3000) <strong>Budget</strong> Development and Execution(3100) Executive Direction and Support 1,613 1,847 1,873 26 12.0 12.0 12.0 0.0(3200) <strong>Financial</strong> and Policy Analysis 452 0 0 0 0.0 0.0 0.0 0.0(3300) <strong>Budget</strong> Formulation and Development 287 0 0 0 0.0 0.0 0.0 0.0(3400) <strong>Financial</strong> Planning and Analysis 13 471 781 310 4.0 3.0 3.0 0.0(3500) Information and Systems Management 128 0 0 0 0.0 0.0 0.0 0.0(3600) Strategic <strong>Budget</strong>ing 16 0 0 0 0.0 0.0 0.0 0.0(3700) Operating <strong>Budget</strong> Formulation and Develop 1,992 2,456 2,513 57 22.9 22.0 22.0 0.0(3800) Capital <strong>Budget</strong> Formulation and Development 576 631 651 21 6.0 5.0 5.0 0.0Subtotal (3000) <strong>Budget</strong> Development and Execution 5,076 5,404 5,818 414 44.9 42.0 42.0 0.0(Continued on next page)FY 2013 Proposed <strong>Budget</strong> and <strong>Financial</strong> Plan<strong>Office</strong> <strong>of</strong> <strong>the</strong> <strong>Chief</strong> <strong>Financial</strong> <strong>Office</strong>rA-243
Table AT0-4 (Continued)(dollars in thousands)Dollars in ThousandsFull-Time EquivalentsChangeChangeActual Approved Proposed from Actual Approved Proposed fromProgram/Activity FY 2011 FY 2012 FY 2013 FY 2012 FY 2011 FY 2012 FY 2013 FY 2012(4000) Research and Analysis(4100) Executive Direction and Support 536 629 644 15 3.0 3.0 3.0 0.0(4200) <strong>Financial</strong> Data Quality Assurance 0 608 908 300 0.0 0.0 0.0 0.0(4300) Revenue Estimation 880 1,132 1,119 -13 9.0 9.0 9.0 0.0(4500) Economic Development 675 691 805 113 5.0 4.0 5.0 1.0(4700) Legislative and Fiscal Analysis 529 562 608 46 6.0 5.0 5.0 0.0(4800) Economic Affairs 498 606 622 16 4.0 4.0 4.0 0.0Subtotal (4000) Research and Analysis 3,118 4,229 4,705 476 26.9 25.0 26.0 1.0(5000) Tax Administration(5100) Executive Direction and Support 3,373 3,301 4,663 1,362 20.9 19.0 20.0 1.0(5200) External Customer Service Information 6,782 6,840 7,270 430 78.8 77.0 81.0 4.0(5300) Recorder <strong>of</strong> Deeds 2,791 2,682 2,692 10 25.9 23.0 22.0 -1.0(5400) Real Property Tax Administration 7,435 7,976 8,339 363 77.8 77.0 81.0 4.0(5500) Tax Audits and Investigations 8,297 8,686 8,912 226 89.7 87.0 89.0 2.0(5600) Revenue Accounting 1,726 1,777 2,287 510 18.9 17.0 18.0 1.0(5700) Receipts and Delinquent Collections 13,879 25,021 25,225 204 167.7 170.0 170.0 0.0Subtotal (5000) Tax Administration 44,283 56,282 59,388 3,106 479.8 470.0 481.0 11.0(6000) Information Technology(6100) Information Technology Support 23,436 20,662 21,081 419 81.8 78.0 78.0 0.0Subtotal (6000) Information Technology 23,436 20,662 21,081 419 81.8 78.0 78.0 0.0(7000) Finance and Treasury(7100) Executive Direction and Support 898 1,051 915 -136 6.0 5.0 5.0 0.0(7200) Debt Management 679 691 796 104 5.0 4.0 5.0 1.0(7300) Cash Management and Investments 3,264 4,976 9,182 4,206 8.0 8.0 16.0 8.0(7400) Disbursements 4,344 2,894 2,813 -82 11.0 10.0 8.0 -2.0(7500) Cash Receipts and Accounting 2,881 2,846 3,228 383 33.7 31.0 32.0 1.0(7600) Asset Management for Special Programs 2,214 4,281 4,321 40 10.9 13.0 13.0 0.0Subtotal (7000) Finance and Treasury 14,280 16,740 21,254 4,515 74.5 71.0 79.0 8.0(8000) Integrity and Oversight(8100) Audit Services 2,702 3,460 3,054 -406 12.0 12.0 12.0 0.0(8200) Security Integrity Oversight 413 582 562 -20 3.0 3.0 3.0 0.0(8300) Investigations 697 757 782 26 7.0 6.0 6.0 0.0Subtotal (8000) Integrity and Oversight 3,812 4,799 4,399 -400 21.9 21.0 21.0 0.0Total Proposed Operating <strong>Budget</strong> 112,883 127,366 136,513 9,147 900.9 869.0 888.0 19.0(Change is calculated by whole numbers and numbers may not add up due to rounding)Note: For more detailed information regarding <strong>the</strong> proposed funding for <strong>the</strong> activities within this agency’s programs, please see Schedule 30-PBBProgram Summary by Activity in <strong>the</strong> FY 2013 Operating Appendices located on <strong>the</strong> <strong>Office</strong> <strong>of</strong> <strong>the</strong> <strong>Chief</strong> <strong>Financial</strong> <strong>Office</strong>r’s website.<strong>Office</strong> <strong>of</strong> <strong>the</strong> <strong>Chief</strong> <strong>Financial</strong> <strong>Office</strong>rA-244FY 2013 Proposed <strong>Budget</strong> and <strong>Financial</strong> Plan
FY 2013 Proposed <strong>Budget</strong> ChangesThe <strong>Office</strong> <strong>of</strong> <strong>the</strong> <strong>Chief</strong> <strong>Financial</strong> <strong>Office</strong>r’s (OCFO) proposed FY 2013 gross budget is $136,512,769, which representsa 7.2 percent increase over its FY 2012 approved gross budget <strong>of</strong> $127,365,574. The budget is comprised<strong>of</strong> $100,305,798 in Local funds, $29,139,610 in Special Purpose Revenue funds, and $7,067,361 in Intra-Districtfunds.Current Services Funding LevelThe Current Services Funding Level (CSFL) is a Local funds ONLY representation <strong>of</strong> <strong>the</strong> true cost <strong>of</strong> operatingDistrict agencies, before consideration <strong>of</strong> policy decisions. The CSFL reflects changes from <strong>the</strong> FY 2012 approvedbudget across multiple programs, and it estimates how much it would cost an agency to continue its current programsand operations into <strong>the</strong> following fiscal year. The initial adjustments in <strong>the</strong> budget proposal representchanges that should be compared to <strong>the</strong> FY 2013 CSFL budget and not necessarily changes made to <strong>the</strong> FY 2012Local funds budget. The FY 2013 CSFL adjustments to <strong>the</strong> FY 2012 Local funds budget are described in table 5<strong>of</strong> this agency's budget chapter. Please see <strong>the</strong> CSFL Development section within Volume 1: Executive Summaryfor more information regarding <strong>the</strong> methodology used and components that comprise <strong>the</strong> CSFL.OCFO’s FY 2013 CSFL budget is $95,654,702, which represents a $1,013,092, or 1.1 percent increase over<strong>the</strong> FY 2012 approved Local funds budget <strong>of</strong> $94,641,610.Major CSFL Cost DriversOCFO’s CSFL includes <strong>the</strong> removal <strong>of</strong> one-time funding, a decrease <strong>of</strong> $608,000 for provisions associated with<strong>the</strong> Tax Revision Commission Establishment Act.Initial Adjusted <strong>Budget</strong>Cost Increase: An increase <strong>of</strong> $269,740 in Local funds reflects adjustments to Contractual Services costs includingInformation Technology Systems Maintenance, payroll support, network support, and <strong>the</strong> implementation <strong>of</strong> acheck guarantee system used to verify bank-related transactions. The OCFO Local funds personal services budgetincreased by a total <strong>of</strong> $181,996 agency-wide due to salary, step increases, and Fringe Benefits adjustments; specifically,to accurately represent historical spending trends and projected health insurance costs.Special Purpose Revenue funds within <strong>the</strong> agency increased by $317,450 to support O<strong>the</strong>r Services andCharges costs; specifically, costs related to <strong>of</strong>fice support and maintenance agreements. An increase <strong>of</strong> $100,169 inContractual Services primarily reflects Recorder <strong>of</strong> Deeds information system integration costs. An increase <strong>of</strong>$41,831 reflects adjustments to salary, step increases, and Fringe Benefits costs.Increases <strong>of</strong> $91,153 in Intra-District funds are a result <strong>of</strong> changes within <strong>the</strong> Finance and Treasury programarmored car contract, and $84,932 and 1.0 FTE across several programs supports anticipated personal servicesadjustments to salary, step increases, and Fringe Benefits.Cost Decrease: A decrease <strong>of</strong> $431,726 in Local funds in O<strong>the</strong>r Services and Charges reflects a reduction in spendingfor <strong>of</strong>fice support, pr<strong>of</strong>essional services fees, and printing costs, and $20,009 was reduced in Supplies andEquipment spending. Within Special Purpose Revenue funds, <strong>the</strong> OCFO reduced its equipment budget by$30,520. In Intra-District funds, a decrease <strong>of</strong> $99,821 in O<strong>the</strong>r Services and Charges reflects a reduction in <strong>of</strong>ficesupport costs within <strong>the</strong> <strong>Financial</strong> Operations and Systems program.Shift: The agency moved a total <strong>of</strong> $413,068 and 5.0 FTEs from Special Purpose Revenue funds to Intra-Districtfunds within <strong>the</strong> <strong>Financial</strong> Operations and Systems program. To support <strong>the</strong> Payroll Disbursements and WageReporting activity conducted by <strong>the</strong> OCFO on behalf <strong>of</strong> participating District agencies, <strong>the</strong> OCFO will enter intomemoranda <strong>of</strong> understanding agreements so that <strong>the</strong> OCFO can accurately reflect payroll processing costs.FY 2013 Proposed <strong>Budget</strong> and <strong>Financial</strong> Plan<strong>Office</strong> <strong>of</strong> <strong>the</strong> <strong>Chief</strong> <strong>Financial</strong> <strong>Office</strong>rA-245
O<strong>the</strong>r Adjustment: An adjustment was made for an increase <strong>of</strong> $290,000 and 2.0 FTEs in <strong>the</strong> Research andAnalysis program to support a legislative requirement related to <strong>the</strong> Exemption and Abatements InformationRequirements Act <strong>of</strong> 2011. The legislation seeks to create and maintain <strong>the</strong> requirements related to <strong>the</strong> exemptionor abatement <strong>of</strong> taxes and to provide for an annual certification <strong>of</strong> eligible taxpayers so that <strong>the</strong>y may continuereceipt <strong>of</strong> an exemption or abatement from real property taxation.Additionally Adjusted <strong>Budget</strong>Adjustments <strong>of</strong> Fringe Benefits to restore <strong>the</strong> District Government contribution for employee health insurancefrom 72 percent, implemented in <strong>the</strong> FY 2011 budget, to 75 percent in FY 2013, resulting in increases <strong>of</strong> $329,001in Local funds, $11,778 in Special Purpose Revenue funds, and $9,120 in Intra-District funds.Policy InitiativesEnhance: The budget reflects an effort to increase collections from delinquent taxpayers without increasing taxrates. In Local funds within <strong>the</strong> Research and Analysis program, a total <strong>of</strong> $808,000 to continue <strong>the</strong> compliancewith <strong>the</strong> provisions <strong>of</strong> <strong>the</strong> Tax Revision Commission Establishment Act (One-time); in <strong>the</strong> Tax Administrationprogram, a total <strong>of</strong> $270,000 and 4.0 FTEs to support an initiative that focuses on <strong>the</strong> recovery <strong>of</strong> unpaid taxes;$256,481 and 3.0 FTEs to support <strong>the</strong> implementation <strong>of</strong> a real property initiative, which will improve <strong>the</strong> estimationand application <strong>of</strong> <strong>the</strong> real property assessments process; $200,000 and 1.0 FTE to annualize aspects <strong>of</strong> <strong>the</strong>District’s tax collection process; and $100,000 to enhance <strong>the</strong> recovery <strong>of</strong> unpaid sales taxes through <strong>the</strong> implementation<strong>of</strong> <strong>the</strong> Credit Card Merchant Payment Reporting requirement (One-time).In Special Purpose Revenue funds, a total <strong>of</strong> $5,580,000 and 8.0 FTEs in <strong>the</strong> Finance and Treasury programsupports <strong>the</strong> implementation <strong>of</strong> a Central Collection Unit. The purpose <strong>of</strong> this Unit is to augment <strong>the</strong> ability <strong>of</strong><strong>the</strong> <strong>of</strong>fice to aggressively collect delinquent debts owed to <strong>the</strong> District pursuant Bill 19-8, “Delinquent DebtRecovery Act <strong>of</strong> 2011.” The law also establishes a special non-lapsing fund to be designated <strong>the</strong> Delinquent DebtFund to collect fees, fines, liens, and o<strong>the</strong>r delinquent debts.Cost Increase: In Local funds, an increase <strong>of</strong> $500,000 in <strong>the</strong> Tax Administration program supports operationalcosts related to <strong>the</strong> Credit Card Merchant Payment Reporting initiative for mailing out notices announcing partialamnesty as reported on merchant payment reports (One-time); $345,000 in <strong>the</strong> Tax Administration program tocomply with <strong>the</strong> Vendor Sales Tax Collection and Remittance Act <strong>of</strong> 2012 that requires licensed street or mobilevendors (<strong>the</strong>se include food trucks, sidewalk food carts, and merchandise vendors) to collect and remit sales taxes;$300,000 in <strong>the</strong> Tax Administration program to lower <strong>the</strong> interest rate paid by <strong>the</strong> District on refunds due to taxreturn filers; $300,000 to support <strong>the</strong> <strong>Budget</strong> Development and Execution program Cost Driver project, whichintegrates <strong>the</strong> unit costs <strong>of</strong> agency services with <strong>the</strong> District’s accounting system; and $100,000 to cover <strong>the</strong> operationalcosts <strong>of</strong> a revenue initiative that will allow <strong>the</strong> Tax Administration program to integrate its systems with <strong>the</strong>Department <strong>of</strong> Motor Vehicles (DMV) to <strong>of</strong>fset or block tax refunds for taxpayers who are delinquent on DMVrelatedcharges including motor vehicle excise, fines, and o<strong>the</strong>r required payments (One-time).Cost Decrease: In Special Purpose Revenue funds, a decrease <strong>of</strong> $1,400,000 in <strong>the</strong> Finance and Treasury reflectscosts savings in <strong>the</strong> District’s contract with banks to cover certain fees. In Intra-District funds, a decrease <strong>of</strong>$450,000 reflects contractual savings due to lower estimate costs to conduct <strong>the</strong> District’s single audit.Shift: In prior years, <strong>the</strong> DMV entered into an Intra-District agreement with <strong>the</strong> OCFO to cover costs related tocashier services at DMV facilities. To streamline certain cash collection functions, <strong>the</strong> Finance and Treasury programshifted $772,888 and 13.0 FTEs funded by DMV to <strong>the</strong> Local funds budget.Transfer In: As part <strong>of</strong> <strong>the</strong> aforementioned shift <strong>of</strong> positions and funding to <strong>the</strong> Local fund budget for cashier operationsat DMV facilities, <strong>the</strong> Finance and Treasury program received $79,597 in Local funds to support anticipatedOvertime and Equipment costs.<strong>Office</strong> <strong>of</strong> <strong>the</strong> <strong>Chief</strong> <strong>Financial</strong> <strong>Office</strong>rA-246FY 2013 Proposed <strong>Budget</strong> and <strong>Financial</strong> Plan
FY 2012 Approved <strong>Budget</strong> to FY 2013 Proposed <strong>Budget</strong>, by Revenue TypeTable AT0-5 itemizes <strong>the</strong> changes by revenue type between <strong>the</strong> FY 2012 approved budget and <strong>the</strong> FY 2013 proposedbudget.Table AT0-5(dollars in thousands)PROGRAM BUDGET FTELOCAL FUNDS: FY 2012 Approved <strong>Budget</strong> and FTE 94,642 782.5Removal <strong>of</strong> One-Time Funding Multiple Programs -608 0.0Fringe Benefit Rate Adjustment Multiple Programs 969 0.0Consumer Price Index Multiple Programs 335 0.0Personal Services Growth Factor Multiple Programs 317 0.0FY 2013 Current Services Funding Level <strong>Budget</strong> (CSFL) 95,655 782.5Cost Increase: Adjustments to Contractual Services costs Multiple Programs 270 0.0Cost Increase: Miscellaneous personal services adjustments Multiple Programs 182 0.0Cost Decrease: Adjustments to O<strong>the</strong>r Services and Charges Multiple Programs -432 0.0Cost Decrease: Adjustments to Supplies and Equipment costs Multiple Programs -20 0.0O<strong>the</strong>r Adjustments: Supports Exemption and Abatements Research and Analysis 290 2.0Information Requirements Act <strong>of</strong> 2011FY 2013 Initial Adjusted <strong>Budget</strong> 95,945 784.5Technical Adjustment: Health insurance contribution Multiple Programs 329 0.0FY 2013 Additionally Adjusted <strong>Budget</strong> 96,274 784.5FY 2013 Policy InitiativesEnhance: Tax Revision Commission support (One-Time) Research and Analysis 808 0.0Enhance: Recovery <strong>of</strong> unpaid taxes Tax Administration 270 4.0Enhance: Real Property Initiative Tax Administration 256 3.0Enhance: Annual use tax returns Tax Administration 200 1.0Enhance: Recovery <strong>of</strong> unpaid sales taxes (One-Time) Tax Administration 100 0.0Cost Increase: Mailing costs for partial amnesty initiative (One-Time) Tax Administration 500 0.0Cost Increase: Vendor sales tax initiative Tax Administration 345 0.0Cost Increase: Lower interest on returns Tax Administration 300 0.0Cost Increase: Cost Driver support <strong>Budget</strong> Development and Execution 300 0.0Cost Increase: Cost to block tax refunds for residents who have Tax Administration 100 0.0unpaid DMV violations (One-Time)Shift: DMV cashier costs from Intra-District funds Finance and Treasury 773 13.0Transfer In: DMV cashier support Finance and Treasury 80 0.0LOCAL FUNDS: FY 2013 Proposed <strong>Budget</strong> and FTE 100,306 805.5SPECIAL PURPOSE REVENUE FUNDS: FY 2012 Approved <strong>Budget</strong> and FTE 24,932 41.0Cost Increase: O<strong>the</strong>r Services and Charges costs Multiple Programs 317 0.0Cost Increase: Adjustments to Contractual Services costs Multiple Programs 100 0.0Cost Increase: Miscellaneous personal services adjustments Multiple Programs 42 0.0Cost Decrease: Adjustments to Equipment purchases Multiple Programs -31 0.0Shift: Positions to Intra-District funds <strong>Financial</strong> Operations and Systems -413 -5.0FY 2013 Initial Adjusted <strong>Budget</strong> 24,948 36.0Technical Adjustment: Health insurance contribution Multiple Programs 12 0.0FY 2013 Additionally Adjusted <strong>Budget</strong> 24,960 36.0(Continued on next page)FY 2013 Proposed <strong>Budget</strong> and <strong>Financial</strong> Plan<strong>Office</strong> <strong>of</strong> <strong>the</strong> <strong>Chief</strong> <strong>Financial</strong> <strong>Office</strong>rA-247
Table AT0-5 (Continued)(dollars in thousands)SPECIAL PURPOSE REVENUE FUNDS (cont.)FY 2013 Policy InitiativesPROGRAM BUDGET FTEEnhance: Supports expanded Central Collection Unit Finance and Treasury 5,580 8.0Cost Decrease: Contractual savings Finance and Treasury -1,400 0.0SPECIAL PURPOSE REVENUE FUNDS: FY 2013 Proposed <strong>Budget</strong> and FTE 29,140 44.0INTRA-DISTRICT FUNDS: FY 2012 Approved <strong>Budget</strong> and FTE 7,792 45.5Cost Increase: Adjustments to Contractual Services costs Finance and Treasury 91 0.0Cost Increase: Miscellaneous personal services adjustments Multiple Programs 85 1.0Cost Decrease: Adjustments to O<strong>the</strong>r Services and Charges <strong>Financial</strong> Operational and Systems -100 0.0Shift: Positions from Special Purpose Revenue funds <strong>Financial</strong> Operations and Systems 413 5.0FY 2013 Initial Adjusted <strong>Budget</strong> 8,281 51.5Technical Adjustment: Health insurance contribution Multiple Programs 9 0.0FY 2013 Additionally Adjusted <strong>Budget</strong> 8,290 51.5FY 2013 Policy InitiativesCost Decrease: Contractual savings from reductions in Integrity and Oversight -450 0.0Contractual ServicesShift: DMV cashier costs to Local funds Finance and Treasury -773 -13.0INTRA-DISTRICT FUNDS: FY 2013 Proposed <strong>Budget</strong> and FTE 7,068 38.5Gross for AT0 - <strong>Office</strong> <strong>of</strong> <strong>the</strong> <strong>Chief</strong> <strong>Financial</strong> <strong>Office</strong>r 136,513 888.0(Change is calculated by whole numbers and numbers may not add up due to rounding)<strong>Office</strong> <strong>of</strong> <strong>the</strong> <strong>Chief</strong> <strong>Financial</strong> <strong>Office</strong>rA-248FY 2013 Proposed <strong>Budget</strong> and <strong>Financial</strong> Plan
BEconomic Developmentand Regulation<strong>Office</strong> <strong>of</strong> <strong>the</strong> Deputy Mayor for Planning andEconomic Development (EB)..................................................................................B-1<strong>Office</strong> <strong>of</strong> Planning (BD).........................................................................................B-11Department <strong>of</strong> Small and Local Business Development (EN)...........................B-23<strong>Office</strong> <strong>of</strong> Motion Picture and Television Development (TK) .............................B-33<strong>Office</strong> <strong>of</strong> Zoning (BJ)..............................................................................................B-41Department <strong>of</strong> Housing and Community Development (DB) ..........................B-49Department <strong>of</strong> Employment Services (CF)..........................................................B-69Board <strong>of</strong> Real Property Assessments and Appeals (DA) .....................................B-83Department <strong>of</strong> Consumer and Regulatory Affairs (CR) .....................................B-91<strong>Office</strong> <strong>of</strong> <strong>the</strong> Tenant Advocate (CQ)...................................................................B-105D.C. Commission on <strong>the</strong> Arts and Humanities (BX).......................................B-115Alcoholic Beverage Regulation Administration (LQ)........................................B-125Public Service Commission (DH).......................................................................B-133<strong>Office</strong> <strong>of</strong> <strong>the</strong> People's Counsel (DJ).....................................................................B-143Department <strong>of</strong> Insurance, Securities and Banking (SR)....................................B-149<strong>Office</strong> <strong>of</strong> Cable Television (CT)...........................................................................B-163Housing Authority Subsidy (HY).......................................................................B-173Housing Production Trust Fund Subsidy (HP)..................................................B-179Business Improvement Districts Transfer (ID)...................................................B-183
(EB0)<strong>Office</strong> <strong>of</strong> <strong>the</strong> Deputy Mayor for Planningand Economic Developmentwww.dcbiz.dc.govTelephone: 202-727-6365% ChangeFY 2011 FY 2012 FY 2013 fromDescription Actual Approved Proposed FY 2012Operating <strong>Budget</strong> $19,288,367 $16,218,505 $42,322,649 161.0FTEs 54.2 56.0 61.0 8.9The <strong>Office</strong> <strong>of</strong> <strong>the</strong> Deputy Mayor for Planning and EconomicDevelopment (DMPED) supports <strong>the</strong> Mayor in developing and executing<strong>the</strong> District's economic development vision.Summary <strong>of</strong> ServicesDMPED assists <strong>the</strong> Mayor in <strong>the</strong> coordination, planning, supervision, and execution <strong>of</strong> programs, policies, proposals,and functions related to economic development in <strong>the</strong> District <strong>of</strong> Columbia. DMPED sets developmentpriorities and policies, coordinates how <strong>the</strong> District markets itself to businesses and developers, and recommendsand ensures implementation <strong>of</strong> financial packaging for District development, attraction, and retention efforts.DMPED also works to achieve its mission by focusing on outreach to <strong>the</strong> business community and neighborhoodstakeholders, and by forging partnerships between government, business and communities to foster economicgrowth for residents <strong>of</strong> <strong>the</strong> District <strong>of</strong> ColumbiaThe agency’s FY 2013 proposed budget is presented in <strong>the</strong> following tables:FY 2013 Proposed <strong>Budget</strong> and <strong>Financial</strong> Plan<strong>Office</strong> <strong>of</strong> <strong>the</strong> Deputy Mayor for Planning and Economic DevelopmentB-1
FY 2013 Proposed Gross Funds Operating <strong>Budget</strong>, by Revenue TypeTable EB0-1 contains <strong>the</strong> proposed FY 2013 agency budget compared to <strong>the</strong> FY 2012 approved budget. It alsoprovides FY 2010 and FY 2011 actual expenditures.Table EB0-1(dollars in thousands)ChangeActual Actual Approved Proposed from PercentAppropriated Fund FY 2010 FY 2011 FY 2012 FY 2013 FY 2012 Change*General FundLocal Funds 3,841 2,158 8,239 11,753 3,514 42.7Dedicated Taxes 17,152 5,500 0 0 0 N/ASpecial Purpose Revenue Funds 6,680 7,998 4,979 17,431 12,452 250.1Total for General Fund 27,673 15,656 13,219 29,184 15,966 120.8Federal ResourcesFederal Payments 0 0 0 9,565 9,565 N/AFederal Grant Funds 3,157 3,439 3,000 3,000 0 0.0Total for Federal Resources 3,157 3,439 3,000 12,565 9,565 318.8Intra-District FundsIntra-District Funds 885 193 0 574 574 N/ATotal for Intra-District Funds 885 193 0 574 574 N/AGross Funds 31,714 19,288 16,219 42,323 26,104 161.0*Percent change is based on whole dollars.Note: If applicable, for a breakdown <strong>of</strong> each Grant (Federal and Private), Special Purpose Revenue type and Intra-District agreement,please refer to Schedule 80 <strong>Agency</strong> Summary by Revenue Source in <strong>the</strong> FY 2013 Operating Appendices located on <strong>the</strong> <strong>Office</strong> <strong>of</strong> <strong>the</strong><strong>Chief</strong> <strong>Financial</strong> <strong>Office</strong>r’s website.FY 2013 Proposed Full-Time Equivalents, by Revenue TypeTable EB0-2 contains <strong>the</strong> proposed FY 2013 FTE level compared to <strong>the</strong> FY 2012 approved FTE level by revenuetype. It also provides FY 2010 and FY 2011 actual data.Table EB0-2ChangeActual Actual Approved Proposed from PercentAppropriated Fund FY 2010 FY 2011 FY 2012 FY 2013 FY 2012 ChangeGeneral FundLocal Funds 14.8 10.8 30.0 52.0 22.0 73.3Dedicated Taxes 3.8 3.8 0.0 0.0 0.0 N/ASpecial Purpose Revenue Funds 39.3 39.7 26.0 6.0 -20.0 -76.9Total for General Fund 57.9 54.2 56.0 58.0 2.0 3.6Intra-District FundsIntra-District Funds 0.0 0.0 0.0 3.0 3.0 N/ATotal for Intra-District Funds 0.0 0.0 0.0 3.0 3.0 N/ATotal Proposed FTEs 57.9 54.2 56.0 61.0 5.0 8.9<strong>Office</strong> <strong>of</strong> <strong>the</strong> Deputy Mayor for Planning and Economic DevelopmentB-2FY 2013 Proposed <strong>Budget</strong> and <strong>Financial</strong> Plan
FY 2013 Proposed Operating <strong>Budget</strong>, by Comptroller Source GroupTable EB0-3 contains <strong>the</strong> proposed FY 2013 budget at <strong>the</strong> Comptroller Source Group (object class) level comparedto <strong>the</strong> FY 2012 approved budget. It also provides FY 2010 and FY 2011 actual expenditures.Table EB0-3(dollars in thousands)ChangeActual Actual Approved Proposed from PercentComptroller Source Group FY 2010 FY 2011 FY 2012 FY 2013 FY 2012 Change*11 - Regular Pay - Continuing Full Time 2,349 2,452 2,978 2,815 -163 -5.512 - Regular Pay - O<strong>the</strong>r 2,619 2,161 2,222 2,757 535 24.113 - Additional Gross Pay 48 177 0 0 0 N/A14 - Fringe Benefits - Current Personnel 885 896 975 1,159 184 18.9Subtotal Personal Services (PS) 5,901 5,686 6,175 6,731 556 9.020 - Supplies and Materials 13 25 20 25 5 25.030 - Energy, Comm. and Building Rentals 0 0 1 11 10 1,897.431 - Telephone, Telegraph, Telegram, Etc. 152 59 53 53 0 0.032 - Rentals - Land and Structures 483 438 292 248 -44 -15.134 - Security Services 0 0 6 10 3 49.935 - Occupancy Fixed Costs 6 0 0 0 0 N/A40 - O<strong>the</strong>r Services and Charges 7,287 5,402 4,561 9,288 4,727 103.641 - Contractual Services - O<strong>the</strong>r 5,172 1,259 1,210 12,597 11,386 940.750 - Subsidies and Transfers 12,641 6,370 3,900 13,350 9,450 242.370 - Equipment and Equipment Rental 59 51 0 10 10 N/ASubtotal Nonpersonal Services (NPS) 25,813 13,603 10,044 35,591 25,548 254.4Gross Funds 31,714 19,288 16,219 42,323 26,104 161.0*Percent change is based on whole dollars.FY 2013 Proposed <strong>Budget</strong> and <strong>Financial</strong> Plan<strong>Office</strong> <strong>of</strong> <strong>the</strong> Deputy Mayor for Planning and Economic DevelopmentB-3
Program DescriptionThe <strong>Office</strong> <strong>of</strong> <strong>the</strong> Deputy Mayor for Planning and Economic Development operates through <strong>the</strong> following 3 programs:Deputy Mayor for Planning and Economic Development – provides specialized and strategic economic developmentassistance. This includes program and policy development and inter-agency coordination services betweenbusinesses, developers, and community stakeholders to enable <strong>the</strong>m to pursue ventures that revitalize neighborhoods,expand and diversify <strong>the</strong> local economy, and provide economic opportunity for District residents.This program contains <strong>the</strong> following 3 activities:■ <strong>Agency</strong> Oversight – monitors agency performance and provides resources or direction to mayoral agencies sothat <strong>the</strong>y can overcome obstacles and achieve <strong>the</strong>ir strategic goals;■ Community Outreach – provides information and referrals to individuals, businesses, and organizations so thatraised issues are resolved by <strong>the</strong> appropriate economic development cluster agency in accordance with Districtcustomer service standards; and■ Economic Development Financing – provides gap financing and o<strong>the</strong>r economic assistance services to businessesand organizations to leverage private sector investment in neighborhood retail, commercial, employmentand housing opportunities for District residents.Instrumentality Economic Development – implements neighborhood revitalization and economic developmentprojects. This program includes <strong>the</strong> projects <strong>of</strong> <strong>the</strong> former National Capital Revitalization Corporation andAnacostia Waterfront Corporation (such as <strong>the</strong> Southwest Waterfront, Hill East, Poplar Point, <strong>the</strong> Ballpark District,Skyland Shopping Center, and <strong>the</strong> former McMillan Reservoir Sand Filtration site), and it coordinates <strong>the</strong> implementation<strong>of</strong> <strong>the</strong> Anacostia Waterfront Initiative, which supports <strong>the</strong> District’s goals <strong>of</strong> promoting environmentallyand socially responsible redevelopment along <strong>the</strong> Anacostia River and increasing public access to <strong>the</strong> river andriverfront parks.<strong>Agency</strong> <strong>Financial</strong> Operations – provides comprehensive and efficient financial management services to, and onbehalf <strong>of</strong>, District agencies so that <strong>the</strong> financial integrity <strong>of</strong> <strong>the</strong> District <strong>of</strong> Columbia is maintained. This programis standard for all agencies using performance-based budgeting.Program Structure ChangeThe <strong>Office</strong> <strong>of</strong> <strong>the</strong> Deputy Mayor for Planning and Economic Development has no program structure changes in<strong>the</strong> FY 2013 proposed budget.<strong>Office</strong> <strong>of</strong> <strong>the</strong> Deputy Mayor for Planning and Economic DevelopmentB-4FY 2013 Proposed <strong>Budget</strong> and <strong>Financial</strong> Plan
FY 2013 Proposed Operating <strong>Budget</strong> and FTEs, by Program and ActivityTable EB0-4 contains <strong>the</strong> proposed FY 2013 budget by program and activity compared to <strong>the</strong> FY 2012 approvedbudget. It also provides FY 2011 actual data.Table EB0-4(dollars in thousands)Dollars in ThousandsFull-Time EquivalentsChangeChangeActual Approved Proposed from Actual Approved Proposed fromProgram/Activity FY 2011 FY 2012 FY 2013 FY 2012 FY 2011 FY 2012 FY 2013 FY 2012(1000) <strong>Agency</strong> Management(1040) Information Technology 58 0 0 0 0.0 0.0 0.0 0.0(1080) Communications 0 0 0 0 0.9 0.0 0.0 0.0Subtotal (1000) <strong>Agency</strong> Management 58 0 0 0 0.9 0.0 0.0 0.0(100F) <strong>Agency</strong> <strong>Financial</strong> Operations(110F) <strong>Budget</strong> Operations 253 248 259 11 1.9 2.0 2.0 0.0Subtotal (100F) <strong>Agency</strong> <strong>Financial</strong> Operations 253 248 259 11 1.9 2.0 2.0 0.0(2000) Deputy Mayor for Planning and EconomicDevelopment(2010) <strong>Agency</strong> Oversight 330 308 1,024 716 1.8 2.0 2.0 0.0(2020) Community Outreach 287 2,369 2,839 471 1.8 2.0 5.0 3.0(2030) Economic Development Financing 5,916 6,369 12,925 6,556 12.1 17.0 19.0 2.0(2070) Public/Private Partnerships 0 1 0 -1 0.0 0.0 0.0 0.0(2080) Neighborhood Investment Fund 5,500 0 0 0 3.8 0.0 0.0 0.0Subtotal (2000) Deputy Mayor for Planning andEconomic Development12,033 9,047 25,539 16,492 19.5 21.0 26.0 5.0(4000) Instrumentality Economic Development(4020) Development and Disposition 6,825 6,923 16,525 9,602 31.9 33.0 33.0 0.0Subtotal (4000) Instrumentality Economic 6,825 6,923 16,525 9,602 31.9 33.0 33.0 0.0(7000) Intra-District Agreements(7011) Economic Develop CFO Indirect Costs 119 0 0 0 0.0 0.0 0.0 0.0Subtotal (7000) Intra-District Agreements 119 0 0 0 0.0 0.0 0.0 0.0Total Proposed Operating <strong>Budget</strong> 19,288 16,219 42,323 26,104 54.2 56.0 61.0 5.0(Change is calculated by whole numbers and numbers may not add up due to rounding)Note: For more detailed information regarding <strong>the</strong> proposed funding for <strong>the</strong> activities within this agency’s programs, please see Schedule 30-PBBProgram Summary by Activity in <strong>the</strong> FY 2013 Operating Appendices located on <strong>the</strong> <strong>Office</strong> <strong>of</strong> <strong>the</strong> <strong>Chief</strong> <strong>Financial</strong> <strong>Office</strong>r’s website.FY 2013 Proposed <strong>Budget</strong> and <strong>Financial</strong> Plan<strong>Office</strong> <strong>of</strong> <strong>the</strong> Deputy Mayor for Planning and Economic DevelopmentB-5
FY 2013 Proposed <strong>Budget</strong> ChangesThe <strong>Office</strong> <strong>of</strong> <strong>the</strong> Deputy Mayor for Planning and Economic Development’s (DMPED) proposed FY 2013 grossbudget is $42,322,649, which represents a 161.0 percent increase over its FY 2012 approved gross budget <strong>of</strong>$16,218,505. The budget is comprised <strong>of</strong> $11,753,464 in Local funds, $9,564,777 in Federal Payments,$3,000,000 in Federal Grants funds, $17,430,832 in Special Purpose Revenue funds, and $573,576 in Intra-District funds.Current Services Funding LevelThe Current Services Funding Level (CSFL) is a Local funds ONLY representation <strong>of</strong> <strong>the</strong> true cost <strong>of</strong> operatingDistrict agencies, before consideration <strong>of</strong> policy decisions. The CSFL reflects changes from <strong>the</strong> FY 2012 approvedbudget across multiple programs, and it estimates how much it would cost an agency to continue its current programsand operations into <strong>the</strong> following fiscal year. The initial adjustments in <strong>the</strong> budget proposal representchanges that should be compared to <strong>the</strong> FY 2013 CSFL budget and not necessarily changes made to <strong>the</strong> FY 2012Local funds budget. The FY 2013 CSFL adjustments to <strong>the</strong> FY 2012 Local funds budget are described in table 5<strong>of</strong> this agency's budget chapter. Please see <strong>the</strong> CSFL Development section within Volume 1: Executive Summaryfor more information regarding <strong>the</strong> methodology used and components that comprise <strong>the</strong> CSFL.DMPED’s FY 2013 CSFL budget is $8,380,353, which represents a $141,098, or 1.7 percent, increase over<strong>the</strong> FY 2012 approved Local funds budget <strong>of</strong> $8,239,255.Initial Adjusted <strong>Budget</strong>Create: $573,000 and 3 FTEs in Intra-District funds as a result <strong>of</strong> an intra-District agreement with <strong>the</strong> Department<strong>of</strong> Employment Services (DOES) to support <strong>the</strong> Workforce Investment Council program.Cost Increase: Contractual Services and Equipment and Equipment Rental increased by $33,000 in Local fundsto align <strong>the</strong> budget with cost estimates. Special Purpose Revenue increased by $5,904,000 due to an increase in <strong>the</strong>projected revenue estimate.Cost Decrease: The proposed budget includes a decrease <strong>of</strong> $2,193,000 in Local funds in O<strong>the</strong>r Services andCharges to <strong>of</strong>fset <strong>the</strong> increase in personal services created by <strong>the</strong> shift from Special Purpose Revenue. SpecialPurpose Revenue funds were reduced by $44,000 to align <strong>the</strong> budget with <strong>the</strong> decrease in Rent due to a recentmove to space with less square footage.Shift: DMPED’s budget includes a shift <strong>of</strong> $2,160,000 in personal services and 20.0 FTEs from Special PurposeRevenue funds to Local funds in <strong>the</strong> Instrumentality Economic Development program.Additionally Adjusted <strong>Budget</strong>Technical Adjustment: Adjustment <strong>of</strong> Fringe Benefits to restore <strong>the</strong> District Government contribution for employeehealth insurance from 72 percent, implemented in <strong>the</strong> FY 2011 budget, to 75 percent in FY 2013, resulting inan increase <strong>of</strong> $21,111 in Local funds, $1,582 in Special Purpose Revenue funds, and $576 in Intra-District funds.Policy InitiativesCreate: A Federal Payment in <strong>the</strong> amount <strong>of</strong> $9,564,777 will be issued for DMPED’s Instrumentality EconomicDevelopment program to support <strong>the</strong> redevelopment efforts at <strong>the</strong> site <strong>of</strong> <strong>the</strong> former St. Elizabeths Hospital.Enhance: Local funds increased by $1,600,000 due to <strong>the</strong> creation <strong>of</strong> <strong>the</strong> Workforce Intermediary, a pilot programto target specific employment sectors with potential District resident employees through specialized training andimproved coordination.<strong>Office</strong> <strong>of</strong> <strong>the</strong> Deputy Mayor for Planning and Economic DevelopmentB-6FY 2013 Proposed <strong>Budget</strong> and <strong>Financial</strong> Plan
Cost Increase: Adjustments in DMPED’s Local funds budget include increases <strong>of</strong> $350,000 to continue to supporta competitive grant to promote local businesses, $100,000 to continue <strong>the</strong> Eds and Meds program, $75,000to continue to support <strong>the</strong> competitive grant for regional economic growth, and $50,000 to support <strong>the</strong> Bank Onprogram. Additional funding proposed for <strong>the</strong> Local funds budget includes increases <strong>of</strong> $700,000 in one-timefunding to support economic development in <strong>the</strong> Pennsylvania Avenue SE Properties region, by providing incentivesfor an entity to open a sit-down restaurant at <strong>the</strong> site <strong>of</strong> <strong>the</strong> Penn Branch Shopping Center; $107,000 to supportfunding for neighborhood parades and festivals; and $100,000 to support <strong>the</strong> Skyland Clean Team.Technical Adjustment: An adjustment to annualize funding for 2.0 FTEs increased Local funds by $270,000.FY 2013 Proposed <strong>Budget</strong> and <strong>Financial</strong> Plan<strong>Office</strong> <strong>of</strong> <strong>the</strong> Deputy Mayor for Planning and Economic DevelopmentB-7
FY 2012 Approved <strong>Budget</strong> to FY 2013 Proposed <strong>Budget</strong>, by Revenue TypeTable EB0-5 itemizes <strong>the</strong> changes by revenue type between <strong>the</strong> FY 2012 approved budget and <strong>the</strong> FY 2013 proposedbudget.Table EB0-5(dollars in thousands)PROGRAM BUDGET FTELOCAL FUNDS: FY 2012 Approved <strong>Budget</strong> and FTE 8,239 30.0Fringe Benefit Rate Adjustment Multiple Programs 39 0.0Consumer Price Index Multiple Programs 87 0.0Personal Services Growth Factor Multiple Programs 15 0.0FY 2013 Current Services Funding Level <strong>Budget</strong> (CSFL) 8,380 30.0Cost Increase: In Contractual Services and Equipment Deputy Mayor for 33 0.0Planning and EconomicCost Decrease: In O<strong>the</strong>r Services and Charges to <strong>of</strong>fset Multiple Programs -2,193 0.0<strong>the</strong> increase in personal servicesShift: Convert funding from Special Purpose Revenue Instrumentality 2,160 20.0for FTEs to Local fundsEconomic DevelopmentCost Increase: In Contractual Services and Equipment Deputy Mayor for 33 0.0Planning and EconomicFY 2013 Initial Adjusted <strong>Budget</strong> 8,380 50.0Technical Adjustment: Health insurance contribution Multiple Programs 21 0.0FY 2013 Additionally Adjusted <strong>Budget</strong> 8,401 50.0FY 2013 Policy InitiativesEnhance: Creation <strong>of</strong> Workforce Intermediary Deputy Mayor for 1,600 0.0Planning and EconomicCost Increase: Continue competitive grant to promote Deputy Mayor for 350 0.0local businessesPlanning and EconomicCost Increase: Continue Eds and Meds program Deputy Mayor for 100 0.0Planning and EconomicCost Increase: Continue competitive grant for regional Deputy Mayor for 75 0.0economic growthPlanning and EconomicCost Increase: Continue Bank On program Deputy Mayor for 50 0.0Planning and EconomicCost Increase: To support economic development in <strong>the</strong> Deputy Mayor for 700 0.0Pennsylvania Avenue SE Properties region (one-time funding)Planning and EconomicCost Increase: To support funding for neighborhood Deputy Mayor for 107 0.0parades and festivalsPlanning and EconomicCost Increase: To support <strong>the</strong> Skyland Clean Team Deputy Mayor for 100 0.0Planning and EconomicTechnical Adjustments: Annualize funding for FTEs Deputy Mayor for 270 2.0added in FY 2012Planning and EconomicLOCAL FUNDS: FY 2013 Proposed <strong>Budget</strong> and FTE 11,753 52.0FEDERAL PAYMENTS: FY 2012 Approved <strong>Budget</strong> and FTE 0 0.0Create: To support redevelopment efforts at <strong>the</strong> site Instrumentality 9,565 0.0<strong>of</strong> <strong>the</strong> former St. Elizabeths HospitalEconomic DevelopmentFY 2013 Initial Adjusted <strong>Budget</strong> 9,565 0.0FEDERAL PAYMENTS: FY 2013 Proposed <strong>Budget</strong> and FTE 9,565 0.0(Continued on next page)<strong>Office</strong> <strong>of</strong> <strong>the</strong> Deputy Mayor for Planning and Economic DevelopmentB-8FY 2013 Proposed <strong>Budget</strong> and <strong>Financial</strong> Plan
Table EB0-5 (cont.)(dollars in thousands)PROGRAM BUDGET FTEFEDERAL GRANT FUNDS: FY 2012 Approved <strong>Budget</strong> and FTE 3,000 0.0No Changes 0 0.0FY 2013 Initial Adjusted <strong>Budget</strong> 3,000 0.0FEDERAL GRANT FUNDS: FY 2013 Proposed <strong>Budget</strong> and FTE 3,000 0.0SPECIAL PURPOSE REVENUE FUNDS: FY 2012 Approved <strong>Budget</strong> and FTE 4,979 26.0Cost Increase: To align budget with increase projected revenue Multiple Programs 5,904 0.0Cost Decrease: To reduce Rent due to move to <strong>of</strong>fices Instrumentality -44 0.0with smaller square footageEconomic DevelopmentShift: Convert funding <strong>of</strong> FTEs from Special Purpose Instrumentality -2,160 -20.0Revenue to Local fundsEconomic DevelopmentFY 2013 Initial Adjusted <strong>Budget</strong> 8,679 6.0Technical Adjustment: Health insurance contribution Multiple Programs 2 0.0FY 2013 Additionally Adjusted <strong>Budget</strong> 8,681 6.0FY 2013 Policy InitiativesCost Increase: To support economic development in <strong>the</strong> Instrumentality 8,750 0.0H Street NE Retail Incentive Priority AreaEconomic DevelopmentSPECIAL PURPOSE REVENUE FUNDS: FY 2013 Proposed <strong>Budget</strong> and FTE 17,431 6.0INTRA-DISTRICT FUNDS: FY 2012 Approved <strong>Budget</strong> and FTE 0 0.0Create: MOU with DOES for <strong>the</strong> Workforce Investment Deputy Mayor for 573 3.0Council programPlanning and EconomicFY 2013 Initial Adjusted <strong>Budget</strong> 573 3.0Technical Adjustment: Health insurance contribution Multiple Programs 1 0.0FY 2013 Additionally Adjusted <strong>Budget</strong> 574 3.0INTRA-DISTRICT FUNDS: FY 2013 Proposed <strong>Budget</strong> and FTE 574 3.0Gross for EB0 - <strong>Office</strong> <strong>of</strong> <strong>the</strong> Deputy Mayor for Planning and Economic Development 42,323 61.0(Change is calculated by whole numbers and numbers may not add up due to rounding)FY 2013 Proposed <strong>Budget</strong> and <strong>Financial</strong> Plan<strong>Office</strong> <strong>of</strong> <strong>the</strong> Deputy Mayor for Planning and Economic DevelopmentB-9
<strong>Agency</strong> Performance PlanThe agency’s performance plan has <strong>the</strong> following objectives for FY 2013:Objective 1: Manage and deliver <strong>the</strong> District's economic development programs and projects.Objective 2: Help businesses relocate to and expand within <strong>the</strong> District <strong>of</strong> Columbia, generating jobs that can beheld by District residents.Objective 3: Demonstrate <strong>the</strong> viability <strong>of</strong> <strong>the</strong> communications department as a means to better manage internalcommunications, affect media coverage and influence stakeholder management.<strong>Agency</strong> Performance MeasuresFY 2010 FY 2011 FY 2011 FY 2012 FY 2013 FY 2014Measure Actual Target Actual Projection Projection ProjectionRatio <strong>of</strong> private funds to public funds leveragedNotthrough DMPED projects 1 3:1 TBD 3:1 3:1 3:1 AvailableNumber <strong>of</strong> community economic developmentmeetings held 35 45 80 55 65 65Number <strong>of</strong> units <strong>of</strong> affordable housing developed 2386 TBD TBD TBD TBD TBDNumber <strong>of</strong> jobs created for DC residents TBD TBD 1,240 5,973 TBD TBDNumber <strong>of</strong> square feet <strong>of</strong> retail space created 180,000 200,000 337,600 300,000 400,000 400,000Number <strong>of</strong> grocery stores per capita 2 1:11,820 TBD 1:12,360 TBD TBD TBDSquare footage <strong>of</strong> shopping center retail spaceper capita 3 8.67:1 TBD 8.6:1 TBD TBD TBDPercentage <strong>of</strong> subgrantee’s budget spent onNotprogrammatic costs Available 65% 85% 65% 65% 65%Percentage <strong>of</strong> scheduled monitoring reportsas defined in agency monitoring plan completedNotfor each grant award Available 100% 95% 100% 100% 100%Performance Plan Endnotes:1. Measured by ratio <strong>of</strong> public funds (contributions by <strong>the</strong> District local government) to private investment (private monies from private sectorinvestors or lenders). Funds from federal government sources should be excluded from <strong>the</strong> formula.2. Industry Standard Measure: Industry Standard Measure: The national benchmark for grocery stores per capita is one “large” (50,000-100,000 sf)store per 10,000 people as cited by <strong>the</strong> New York City Department <strong>of</strong> City Planning in a report entitled, “Going to Market”,http://www.nyc.gov/html/dcp/html/supermarket/index.shtml . Assuming that <strong>the</strong>re are an equal number <strong>of</strong> “large” and “small” (10,000 to50,000 sf) stores, <strong>the</strong> national ratio would be one overall grocery store per 5,000 people.3. Industry Standard Measure: The national benchmark for square footage <strong>of</strong> shopping center retail space per capita is 23.4:1 as defined by <strong>the</strong>Delta Associates Spring 2010 Retail Outlook Report.<strong>Office</strong> <strong>of</strong> <strong>the</strong> Deputy Mayor for Planning and Economic DevelopmentB-10FY 2013 Proposed <strong>Budget</strong> and <strong>Financial</strong> Plan
(BD0)<strong>Office</strong> <strong>of</strong> Planningwww.planning.dc.govTelephone: 202-442-7600% ChangeFY 2011 FY 2012 FY 2013 fromDescription Actual Approved Proposed FY 2012Operating <strong>Budget</strong> $6,357,296 $6,725,906 $7,346,839 9.2FTEs 56.2 61.0 61.0 0.0The mission <strong>of</strong> <strong>the</strong> <strong>Office</strong> <strong>of</strong> Planning (OP) is to guide development<strong>of</strong> <strong>the</strong> District <strong>of</strong> Columbia, including <strong>the</strong> preservation and revitalization<strong>of</strong> our distinctive neighborhoods, by informing decisions, advancingstrategic goals, encouraging <strong>the</strong> highest quality development outcomes,and engaging all communities.Summary <strong>of</strong> ServicesOP performs planning for neighborhoods, corridors, districts, historic preservation, public facilities, parks and openspaces, and individual sites. In addition, OP engages in urban design, land use, and historic preservation review.OP also conducts historic resources research and community visioning, and manages, analyzes, maps, and disseminatesspatial and U.S. Census data.The agency’s FY 2013 proposed budget is presented in <strong>the</strong> following tables:FY 2013 Proposed <strong>Budget</strong> and <strong>Financial</strong> Plan<strong>Office</strong> <strong>of</strong> PlanningB-11
FY 2013 Proposed Gross Funds Operating <strong>Budget</strong>, by Revenue TypeTable BD0-1 contains <strong>the</strong> proposed FY 2013 agency budget compared to <strong>the</strong> FY 2012 approved budget. It alsoprovides FY 2010 and FY 2011 actual expenditures.Table BD0-1(dollars in thousands)ChangeActual Actual Approved Proposed from PercentAppropriated Fund FY 2010 FY 2011 FY 2012 FY 2013 FY 2012 Change*General FundLocal Funds 7,220 5,480 6,246 6,559 313 5.0Special Purpose Revenue Funds 28 19 30 30 0 0.0Total for General Fund 7,249 5,499 6,276 6,589 313 5.0Federal ResourcesFederal Payments 0 0 0 235 235 N/AFederal Grant Funds 574 626 450 523 73 16.2Total for Federal Resources 574 626 450 758 308 68.5Intra-District FundsIntra-District Funds 69 232 0 0 0 N/ATotal for Intra-District Funds 69 232 0 0 0 N/AGross Funds 7,892 6,357 6,726 7,347 621 9.2*Percent change is based on whole dollars.Note: If applicable, for a breakdown <strong>of</strong> each Grant (Federal and Private), Special Purpose Revenue type and Intra-District agreement,please refer to Schedule 80 <strong>Agency</strong> Summary by Revenue Source in <strong>the</strong> FY 2013 Operating Appendices located on <strong>the</strong> <strong>Office</strong> <strong>of</strong> <strong>the</strong><strong>Chief</strong> <strong>Financial</strong> <strong>Office</strong>r’s website.<strong>Office</strong> <strong>of</strong> PlanningB-12FY 2013 Proposed <strong>Budget</strong> and <strong>Financial</strong> Plan
FY 2013 Proposed Full-Time Equivalents, by Revenue TypeTable BD0-2 contains <strong>the</strong> proposed FY 2013 FTE level compared to <strong>the</strong> FY 2012 approved FTE level by revenuetype. It also provides FY 2010 and FY 2011 actual data.Table BD0-2ChangeActual Actual Approved Proposed from PercentAppropriated Fund FY 2010 FY 2011 FY 2012 FY 2013 FY 2012 ChangeGeneral FundLocal Funds 60.9 49.9 55.5 55.5 0.0 0.0Total for General Fund 60.9 49.9 55.5 55.5 0.0 0.0Federal ResourcesFederal Payments 0.0 0.0 2.0 2.0 0.0 0.0Federal Grant Funds 2.4 5.9 3.5 3.5 0.0 0.0Total for Federal Resources 2.4 5.9 5.5 5.5 0.0 0.0Intra-District FundsIntra-District Funds 0.8 0.5 0.0 0.0 0.0 N/ATotal for Intra-District Funds 0.8 0.5 0.0 0.0 0.0 N/ATotal Proposed FTEs 64.2 56.2 61.0 61.0 0.0 0.0FY 2013 Proposed <strong>Budget</strong> and <strong>Financial</strong> Plan<strong>Office</strong> <strong>of</strong> PlanningB-13
FY 2013 Proposed Operating <strong>Budget</strong>, by Comptroller Source GroupTable BD0-3 contains <strong>the</strong> proposed FY 2013 budget at <strong>the</strong> Comptroller Source Group (object class) level comparedto <strong>the</strong> FY 2012 approved budget. It also provides FY 2010 and FY 2011 actual expenditures.Table BD0-3(dollars in thousands)ChangeActual Actual Approved Proposed from PercentComptroller Source Group FY 2010 FY 2011 FY 2012 FY 2013 FY 2012 Change*11 - Regular Pay - Continuing Full Time 5,053 4,350 4,913 5,262 350 7.112 - Regular Pay - O<strong>the</strong>r 188 60 127 0 -127 -100.013 - Additional Gross Pay 144 45 0 0 0 N/A14 - Fringe Benefits - Current Personnel 998 915 1,005 1,143 137 13.615 - Overtime Pay 0 0 0 0 0 N/ASubtotal Personal Services (PS) 6,383 5,370 6,045 6,405 360 6.020 - Supplies and Materials 16 29 38 38 0 0.030 - Energy, Comm. and Building Rentals 29 0 0 0 0 N/A31 - Telephone, Telegraph, Telegram, Etc. 47 2 0 0 0 N/A32 - Rentals - Land and Structures 183 0 0 0 0 N/A33 - Janitorial Services 34 -4 0 0 0 N/A34 - Security Services 6 -1 0 0 0 N/A35 - Occupancy Fixed Costs 7 0 0 0 0 N/A40 - O<strong>the</strong>r Services and Charges 294 121 178 185 8 4.341 - Contractual Services - O<strong>the</strong>r 607 575 182 445 263 144.650 - Subsidies and Transfers 199 217 230 220 -10 -4.270 - Equipment and Equipment Rental 87 48 54 54 0 0.0Subtotal Nonpersonal Services (NPS) 1,509 987 681 942 261 38.4Gross Funds 7,892 6,357 6,726 7,347 621 9.2*Percent change is based on whole dollars.Division DescriptionThe <strong>Office</strong> <strong>of</strong> Planning operates through <strong>the</strong> following 4 divisions:Development Review and Historic Preservation – assesses plans and projects that range from large, complex developmentsthat are precedent-setting in <strong>the</strong>ir potential to change <strong>the</strong> character <strong>of</strong> an area, to small individual buildingpermits affecting individual property. This division also promotes stewardship <strong>of</strong> <strong>the</strong> District’s historic and culturalresources through planning, protection, and public education; administers <strong>the</strong> District’s local preservation programunder <strong>the</strong> District’s Historic Landmark and Historic District Protection Act; and acts as <strong>the</strong> certified state historicpreservation program under <strong>the</strong> National Historic Preservation Act. The staff also provides recommendationsto <strong>the</strong> Historic Preservation Review Board, <strong>the</strong> Board <strong>of</strong> Zoning Adjustment, and <strong>the</strong> Zoning Commission.This division contains <strong>the</strong> following 2 activities:■ Development/Zoning Review – provides <strong>the</strong> Board <strong>of</strong> Zoning Adjustment and <strong>the</strong> Zoning Commission withpr<strong>of</strong>essional analyses <strong>of</strong> large and/or complex zoning cases that may involve variances, special exceptions, campusplans, or planned unit development proposals. The staff also assesses <strong>the</strong> zoning applied to various areas tomake sure that it is consistent with <strong>the</strong> Comprehensive Plan and recommends changes if necessary; and<strong>Office</strong> <strong>of</strong> PlanningB-14FY 2013 Proposed <strong>Budget</strong> and <strong>Financial</strong> Plan
■Historic Preservation – provides individual technical assistance to any person applying for a District buildingpermit that affects a historic property under <strong>the</strong> city’s preservation law. The staff provides support to <strong>the</strong>Historic Preservation Review Board, which determines <strong>the</strong> appropriateness <strong>of</strong> changes to historic landmarksand historic districts.Revitalization/Design and Neighborhood Planning – provides a broad range <strong>of</strong> plan development, implementation,and project coordination services for District neighborhoods, central Washington, and <strong>the</strong> waterfront areas.Neighborhood Planning’s main areas <strong>of</strong> responsibility include developing small-area plans and planning studies andcoordinating and tracking plan implementation. Revitalization/Design’s main areas <strong>of</strong> responsibility include developingplans and projects for districts and development areas within Center City, with a focus on design strategiesand guidelines, coordinating and tracking plan implementation, managing <strong>the</strong> public space program, and incorporatingenvironmentally sound action into <strong>the</strong> ongoing development <strong>of</strong> <strong>the</strong> District.This division contains <strong>the</strong> following 2 activities:■ Neighborhood Planning – provides a team <strong>of</strong> neighborhood planners, including one assigned to each ward, tocraft and oversee <strong>the</strong> implementation <strong>of</strong> small-area plans, which guide growth and development in neighborhoodsin accordance with agreed-upon goals and objectives. Neighborhood planners work in collaboration withAdvisory Neighborhood Commissions, citizen associations, residents, businesses, and District agencies to developand implement <strong>the</strong> plans; and■ Revitalization and Design – develops comprehensive strategies for large-area development that emphasize progressiveplanning, high-quality urban design, and community engagement, through its expertise in urbandesign, real estate development, land use planning, architecture, environmental sustainability, and communityengagement.Citywide Planning – develops and monitors <strong>the</strong> District Elements <strong>of</strong> <strong>the</strong> Comprehensive Plan, and works withregional and o<strong>the</strong>r District agencies to create strategies for emerging employment sectors, meeting retail needs, andcoordinating <strong>the</strong> city’s land use and transportation. The division provides data analysis, information, and longrangeplanning services to OP staff, neighborhood stakeholders, citizens, businesses, o<strong>the</strong>r District and federal agencies,and o<strong>the</strong>r decision-makers so that <strong>the</strong>y can have <strong>the</strong> information needed to plan, develop, and preserve <strong>the</strong>District.This division contains <strong>the</strong> following 3 activities:■ Citywide Planning – develops and monitors <strong>the</strong> District Elements <strong>of</strong> <strong>the</strong> Comprehensive Plan, <strong>the</strong> District’s20-year blueprint for <strong>the</strong> city, and works with regional and o<strong>the</strong>r city agencies to create strategies for emergingemployment sectors, meeting retail needs, and coordinating land use and transportation;■ Geographic Information Systems and Information Technology – provides mapping, spatial information, andanalysis to District agencies, citizens, and a variety <strong>of</strong> o<strong>the</strong>r stakeholders. These services complement <strong>the</strong> automatedtools available on www.dc.gov; and■ State Data Center – serves as <strong>the</strong> District’s <strong>of</strong>ficial source <strong>of</strong> data. It provides a variety <strong>of</strong> demographic, social,economic, and housing data for <strong>the</strong> District by ward, census tract, block-group, and block to District agencies,residents, and o<strong>the</strong>r stakeholders.<strong>Agency</strong> Management – provides for administrative support and <strong>the</strong> required tools to achieve operational and programmaticresults. This division is standard for all agencies using performance-based budgeting.Division Structure ChangeThe <strong>Office</strong> <strong>of</strong> Planning has no division structure changes in <strong>the</strong> FY 2013 proposed budget.FY 2013 Proposed <strong>Budget</strong> and <strong>Financial</strong> Plan<strong>Office</strong> <strong>of</strong> PlanningB-15
FY 2013 Proposed Operating <strong>Budget</strong> and FTEs, by Division and ActivityTable BD0-4 contains <strong>the</strong> proposed FY 2013 budget by division and activity compared to <strong>the</strong> FY 2012 approved budget. Italso provides <strong>the</strong> FY 2011 actual data.Table BD0-4(dollars in thousands)Dollars in ThousandsFull-Time EquivalentsChangeChangeActual Approved Proposed from Actual Approved Proposed fromDivision/Activity FY 2011 FY 2012 FY 2013 FY 2012 FY 2011 FY 2012 FY 2013 FY 2012(1000) <strong>Agency</strong> Management(1010) Personnel 108 117 121 3 0.7 0.8 0.8 0.0(1015) Training and Employee Development 23 24 25 1 0.2 0.2 0.2 0.0(1020) Contracting and Procurement 34 34 35 1 0.2 0.2 0.2 0.0(1030) Property Management 102 207 200 -7 0.2 0.2 0.3 0.0(1040) Information Technology (IT) 90 71 69 -2 0.2 0.2 0.0 -0.2(1050) <strong>Financial</strong> Management 67 68 69 1 0.5 0.5 0.5 0.0(1055) Risk Management 17 18 18 1 0.2 0.2 0.2 0.0(1060) Legal 0 0 0 0 0.0 0.0 0.0 0.0(1080) Communications 100 107 110 3 1.0 1.0 1.0 0.0(1085) Customer Service 17 18 18 1 0.2 0.2 0.2 0.0(1090) Performance Management 218 411 419 8 3.1 3.2 3.2 0.0Subtotal (1000) <strong>Agency</strong> Management 778 1,074 1,085 10 6.7 7.0 6.8 -0.2(2000) Development Review and Historic Preservation(2010) Development/Zoning Review 940 993 1,006 13 8.1 9.0 8.5 -0.5(2020) Historic Preservation 1,544 1,508 1,730 223 14.4 13.0 13.5 0.5Subtotal (2000) Developmt Review and Historic Preservation 2,483 2,500 2,736 236 22.5 22.0 22.0 0.0(3000) Revitalzatn/Design and Neighborhood Planng(3010) Neighborhood Planning 1,112 954 1,406 451 8.4 11.4 12.4 1.0(3020) Revitalization and Design 668 677 586 -91 6.1 6.4 5.4 -1.0Subtotal (3000) Revitalzatn/Design and Neighborhood Planng 1,780 1,631 1,992 361 14.5 17.8 17.8 0.0(6000) Long Range Planning(6010) Comprehensive Planning 142 0 0 0 0.0 0.0 0.0 0.0(6020) GIS and IT 1 0 0 0 0.0 0.0 0.0 0.0(6030) State Data Center -4 0 0 0 0.0 0.0 0.0 0.0Subtotal (6000) Long Range Planning 139 0 0 0 0.0 0.0 0.0 0.0(7000) Citywide Planning(7010) Citywide Planning 304 529 531 2 3.2 4.4 4.4 0.0(7020) GIS and IT 543 598 594 -5 5.1 5.4 5.6 0.2(7030) State Data Center 331 392 409 17 4.2 4.4 4.4 0.0Subtotal (7000) Citywide Planning 1,178 1,520 1,534 14 12.5 14.2 14.4 0.2Total Proposed Operating <strong>Budget</strong> 6,357 6,726 7,347 621 56.2 61.0 61.0 0.0(Change is calculated by whole numbers and numbers may not add up due to rounding)Note: For more detailed information regarding <strong>the</strong> proposed funding for <strong>the</strong> activities within this agency’s divisions, please see Schedule 30-PBBProgram Summary by Activity in <strong>the</strong> FY 2013 Operating Appendices located on <strong>the</strong> <strong>Office</strong> <strong>of</strong> <strong>the</strong> <strong>Chief</strong> <strong>Financial</strong> <strong>Office</strong>r’s website.<strong>Office</strong> <strong>of</strong> PlanningB-16FY 2013 Proposed <strong>Budget</strong> and <strong>Financial</strong> Plan
FY 2013 Proposed <strong>Budget</strong> ChangesThe <strong>Office</strong> <strong>of</strong> Planning’s (OP) proposed FY 2013 gross budget is $7,346,839, which represents a 9.2 percentincrease over its FY 2012 approved gross budget <strong>of</strong> $6,725,906. The budget is comprised <strong>of</strong> $6,558,587 in Localfunds, $235,223 in Federal Payments, $523,029 in Federal Grant funds, and $30,000 in Special Purpose Revenuefunds.Current Services Funding LevelThe Current Services Funding Level (CSFL) is a Local funds ONLY representation <strong>of</strong> <strong>the</strong> true cost <strong>of</strong> operatingDistrict agencies, before consideration <strong>of</strong> policy decisions. The CSFL reflects changes from <strong>the</strong> FY 2012 approvedbudget across multiple programs, and it estimates how much it would cost an agency to continue its current programsand operations into <strong>the</strong> following fiscal year. The initial adjustments in <strong>the</strong> budget proposal representchanges that should be compared to <strong>the</strong> FY 2013 CSFL budget and not necessarily changes made to <strong>the</strong> FY 2012Local funds budget. The FY 2013 CSFL adjustments to <strong>the</strong> FY 2012 Local funds budget are described in table 5<strong>of</strong> this agency's budget chapter. Please see <strong>the</strong> CSFL Development section within Volume 1: Executive Summaryfor more information regarding <strong>the</strong> methodology used and components that comprise <strong>the</strong> CSFL.OP’s FY 2013 CSFL budget is $6,336,133, which represents a $90,227, or 1.4 percent, increase over <strong>the</strong> FY2012 approved Local funds budget <strong>of</strong> $6,245,906.Initial Adjusted <strong>Budget</strong>Enhance: In <strong>the</strong> President’s proposed FY 2013 budget, <strong>the</strong> <strong>Office</strong> <strong>of</strong> Planning will receive a Federal Payment <strong>of</strong>$235,223 for redevelopment <strong>of</strong> <strong>the</strong> former St. Elizabeths hospital. These funds will be used across multiple programs.Cost Increase: The <strong>Office</strong> <strong>of</strong> Planning will increase Local funding in O<strong>the</strong>r Services and Charges by $12,885 andpersonal services by $354. A Federal Grant funds increase <strong>of</strong> $61,704 will be supported by <strong>the</strong> HistoricPreservation fund grant and will be allocated to <strong>the</strong> Development Review and Historic Preservation program inContractual Services. An increase <strong>of</strong> $10,296 will align personal services with projected costs.Cost Decrease: The agency made Local fund reductions <strong>of</strong> $9,734 in Subsidies and Transfers, $1,820 inEquipment and Supplies, and $1,684 in Contractual Services.Additionally Adjusted <strong>Budget</strong>Technical Adjustment: Adjustment <strong>of</strong> Fringe Benefits to restore <strong>the</strong> District Government contribution for employeehealth insurance from 72 percent, implemented in <strong>the</strong> FY 2011 budget, to 75 percent in FY 2013, resulting inan increase <strong>of</strong> $22,455 in Local funds and $1,029 in Federal Grant funds.Policy InitiativeEnhance: The Revitalization Design and Neighborhood Planning program will receive $200,000 in One-TimeLocal funding, which will be used to support <strong>the</strong> Eckington Small Area plan.FY 2013 Proposed <strong>Budget</strong> and <strong>Financial</strong> Plan<strong>Office</strong> <strong>of</strong> PlanningB-17
FY 2012 Approved <strong>Budget</strong> to FY 2013 Proposed <strong>Budget</strong>, by Revenue TypeTable BD0-5 itemizes <strong>the</strong> changes by revenue type between <strong>the</strong> FY 2012 approved budget and <strong>the</strong> FY 2013proposed budget.Table BD0-5(dollars in thousands)DIVISION BUDGET FTELOCAL FUNDS: FY 2012 Approved <strong>Budget</strong> and FTE 6,246 55.5Removal <strong>of</strong> One-Time Funding Development Review and Historic Preservation -6 0.0Fringe Benefit Rate Adjustment Multiple Programs 67 0.0Consumer Price Index Multiple Programs 6 0.0Personal Services Growth Factor Multiple Programs 24 0.0FY 2013 Current Services Funding Level <strong>Budget</strong> (CSFL) 6,336 55.5Cost Increase: O<strong>the</strong>r Services and Charges <strong>Agency</strong> Management 13 0.0Cost Increase: Align personal services with projected Multiple Programs 0 0.0costs (less than $500)Cost Decrease: Subsidies and Transfers Development Review and Historic Preservation -10 0.0Cost Decrease: Equipment and Supplies <strong>Agency</strong> Management -2 0.0Cost Decrease: Contractual Services Multiple Programs -2 0.0FY 2013 Initial Adjusted <strong>Budget</strong> 6,336 55.5Technical Adjustment: Health insurance contribution Multiple Programs 22 0.0FY 2013 Additionally Adjusted <strong>Budget</strong> 6,359 55.5FY 2013 Policy InitiativeEnhance: One-Time funding for <strong>the</strong> Eckington Small Area plan Revitalization /Design and 200 0.0Neighborhood PlanningLOCAL FUNDS: FY 2013 Proposed <strong>Budget</strong> and FTE 6,559 55.5FEDERAL PAYMENTS: FY 2012 Approved <strong>Budget</strong> and FTE 0 2.0Enhance: Redevelopment <strong>of</strong> <strong>the</strong> former St. Elizabeths hospital Multiple Programs 235 0.0FY 2013 Initial Adjusted <strong>Budget</strong> 235 2.0FEDERAL PAYMENTS: FY 2013 Proposed <strong>Budget</strong> and FTE 235 2.0FEDERAL GRANT FUNDS: FY 2012 Approved <strong>Budget</strong> and FTE 450 3.5Cost Increase: Historic Preservation fund grant Development Review and Historic Preservation 62 0.0Cost Increase: Align personal services with projected costs Development Review and Historic Preservation 10 0.0FY 2013 Initial Adjusted <strong>Budget</strong> 522 3.5Technical Adjustment: Health insurance contribution Multiple Programs 1 0.0FY 2013 Additionally Adjusted <strong>Budget</strong> 523 3.5FEDERAL GRANT FUNDS: FY 2013 Proposed <strong>Budget</strong> and FTE 523 3.5SPECIAL PURPOSE REVENUE FUNDS: FY 2012 Approved <strong>Budget</strong> and FTE 30 0.0No Changes 0 0.0FY 2013 Initial Adjusted <strong>Budget</strong> 30 0.0SPECIAL PURPOSE REVENUE FUNDS: FY 2013 Proposed <strong>Budget</strong> and FTE 30 0.0Gross for BD0 - <strong>Office</strong> <strong>of</strong> Planning 7,347 61.0(Change is calculated by whole numbers and numbers may not add up due to rounding)<strong>Office</strong> <strong>of</strong> PlanningB-18FY 2013 Proposed <strong>Budget</strong> and <strong>Financial</strong> Plan
<strong>Agency</strong> Performance PlanThe agency has <strong>the</strong> following objectives and performance indicators for its divisions:1. Citywide PlanningObjective 1: Use data to inform planning.Objective 2: Better inform public and private investment decisions.Citywide PlanningFY 2010 FY 2011 FY 2011 FY 2012 FY 2013 FY 2014Metric Actual Target Actual Projection Projection ProjectionMeasure 1: Develop facility plans, identifypublic-private partnerships or co-location opportunities,and conduct demographic analyses for targetedagencies 5 3 3 2 2 2Measure 2: Percentage <strong>of</strong> OP-responsible Comp Planimplementation items from <strong>the</strong> current plan andfuture amendments that are newly achieved during<strong>the</strong> fiscal year 36.71% 25% 37% 25% 25% 27%Measure 3: Change in retail indicators relative to <strong>the</strong>baseline, as measured by change in Gross Sales andUse Tax -1.76% 1.0% +2.87% +1.00% +1.00% +1.00%Measure 4: Change in retail indicators relative to <strong>the</strong>baseline, as measured by change in Retail TradeEmployment 0.68% 1.0% -3.34% 0.00% +1.00% +1.00%Measure 5: Percentage change in transit ridership -2.19% 2.5% +0.82% 4% 4% 4%Measure 6: Use Walkscore to compare DC’swalkability to o<strong>the</strong>r US cities Ranked Ranked Ranked Remain in Remain in Remain in#7 Top 10 #7 Top 10 Top 10 Top 10Measure 7: Positive change, in Change in median -4.98% 2.2% +3.20 +2.50% +2.50% +3.00%single family home sales priceMeasure 8: Positive change, in Change in median 2.34% 3.0% +2.72 +2.00% +3.00% +3.00%household incomeMeasure 9: Positive change, in Change in District 1.32% 0.3% +3.06 +1.50% +2.00% +2.50%populationMeasure 10: Percentage <strong>of</strong> customers* who have <strong>the</strong>data and analysis needed to fulfill <strong>the</strong>ir role in planning<strong>the</strong> city and influencing quality neighborhood outcomes 94.26% 90% 95.11% 90% 90% 90%Measure 11: Percentage <strong>of</strong> change to citizens’ access togrocery stores and farmers markets 0.8% 5.0% 0.8% 1% 1% 1%Measure 12: Median number <strong>of</strong> hours needed tosuccessfully complete a mapping request TBD 1% 1.0 2.0 2.0 2.0Note: * - Includes District residents and o<strong>the</strong>r individuals, private organizations, and government agencies.FY 2013 Proposed <strong>Budget</strong> and <strong>Financial</strong> Plan<strong>Office</strong> <strong>of</strong> PlanningB-19
2. Revitalization/Design and Neighborhood PlanningObjective 1: Catalyze improvements in neighborhoods and central Washington to enhance economic competitiveness,livability, and environmental harmony.Objective 2: Increase <strong>the</strong> transparency and predictability <strong>of</strong> <strong>the</strong> planning process to better engage stakeholders andto increase <strong>the</strong> dialogue around key planning tools and topics.Revitalization/Design and Neighborhood PlanningFY 2010 FY 2011 FY 2011 FY 2012 FY 2013 FY 2014Measure Actual Target Actual Projection Projection ProjectionMeasure 13: Percent <strong>of</strong> OP small area plans approvedby <strong>the</strong> Council 100% 90% 100% 90% 90% 90%Measure 14: Percent <strong>of</strong> plans completed in 18 monthsor less 100% 65% 100% 70% 75% 78%Measure 15: Cost <strong>of</strong> consultant services per plancompleted $104,595 $250,000 $198,373 $250,000 $250,000 $250,0003. Development Review and Historic PreservationObjective 1: Deliver resources, clarified regulations, and technical assistance to enhance <strong>the</strong> quality <strong>of</strong> <strong>the</strong> built environment.Development Review and Historic PreservationFY 2010 FY 2011 FY 2011 FY 2012 FY 2013 FY 2014Measure Actual Target Actual Projection Projection ProjectionPercent <strong>of</strong> historic property permit applications reviewedover <strong>the</strong> counter 94.54% 90% 93.77% 90% 90% 90%Dollars <strong>of</strong> historic homeowner grants issued $201,486 $250,000 $229,746 $230,000 $230,000 $230,000Percent <strong>of</strong> historic landmark designations without ownerobjection 100% 85% 100% 85% 85% 85%Percent <strong>of</strong> District government project applications respondedto within 5 business days 89.70% 90% 90.48% 90% 90% 90%Percent <strong>of</strong> Development Review reports that meet <strong>the</strong>expectations <strong>of</strong> boards/commissions 93.84% 90% 94.31% 90% 90% 90%Average cases reviewed per zoning review staff 41.06 20 37.30 20 20 20NotAverage cases reviewed per historic preservation staff Available 500 634.86 500 500 500<strong>Office</strong> <strong>of</strong> PlanningB-20FY 2013 Proposed <strong>Budget</strong> and <strong>Financial</strong> Plan
4. <strong>Office</strong> <strong>of</strong> <strong>the</strong> DirectorObjective 1: Efficiently manage <strong>the</strong> resources and operations <strong>of</strong> <strong>the</strong> agency.<strong>Office</strong> <strong>of</strong> <strong>the</strong> DirectorFY 2010 FY 2011 FY 2011 FY 2012 FY 2013 FY 2014Measure Actual Target Actual Projection Projection ProjectionPercentage <strong>of</strong> subgrantee’s budget spent on programmaticcosts 1 NotAvailable 65% 77.35% 65% 65% 65%Percentage <strong>of</strong> scheduled monitoring reports as defined inagency monitoring plan completed for each grant award 2 NotAvailable 100% 100% 100% 100% 100%Note: These were standard for agencies for FY 2011.Performance Plan Endnotes:1 The Wise Giving Alliance <strong>of</strong> <strong>the</strong> Better Business Bureau identifies 65 percent to be an industry standard for this measure http://www.bbb.org/us/Charity-Standards/. This metric measures all subgrantees’ programmaticcosts as a percentage <strong>of</strong> <strong>the</strong>ir overall costs.2 Pursuant to 11.4 <strong>of</strong> <strong>the</strong> Grants Manual and Source Book all District agencies must complete monitoring reports. All District agencies should be in compliance with this standard. The standard is 100 percent.FY 2013 Proposed <strong>Budget</strong> and <strong>Financial</strong> Plan<strong>Office</strong> <strong>of</strong> PlanningB-21
(EN0)Department <strong>of</strong> Small and Local BusinessDevelopmenthttp://dslbd.dc.govTelephone: 202-727-3900% ChangeFY 2011 FY 2012 FY 2013 fromDescription Actual Approved Proposed FY 2012Operating <strong>Budget</strong> $7,802,987 $5,264,071 $6,185,221 17.5FTEs 24.2 25.0 31.0 24.2The mission <strong>of</strong> <strong>the</strong> Department <strong>of</strong> Small and Local BusinessDevelopment (DSLBD) is to foster <strong>the</strong> economic growth, development,and retention <strong>of</strong> District-based businesses.Summary <strong>of</strong> ServicesThe Department <strong>of</strong> Small and Local Business Development provides assistance and services to District-based businessesby identifying and disseminating business opportunities; advocating and promoting small business; providingone-on-one counseling services, workshops, courses and trainings; certifying companies to do business in <strong>the</strong>city; and fostering small business development in commercial districts.The agency’s FY 2013 proposed budget is presented in <strong>the</strong> following tables:FY 2013 Proposed <strong>Budget</strong> and <strong>Financial</strong> PlanDepartment <strong>of</strong> Small and Local Business DevelopmentB-23
FY 2013 Proposed Gross Funds Operating <strong>Budget</strong>, by Revenue TypeTable EN0-1 contains <strong>the</strong> proposed FY 2013 agency budget compared to <strong>the</strong> FY 2012 approved budget. It alsoprovides FY 2010 and FY 2011 actual expenditures.Table EN0-1(dollars in thousands)ChangeActual Actual Approved Proposed from PercentAppropriated Fund FY 2010 FY 2011 FY 2012 FY 2013 FY 2012 Change*General FundLocal Funds 2,339 7,536 4,852 5,276 424 8.7Total for General Fund 2,339 7,536 4,852 5,276 424 8.7Federal ResourcesFederal Grant Funds 341 258 361 909 548 152.0Total for Federal Resources 341 258 361 909 548 152.0Intra-District FundsIntra-District Funds 3,080 9 51 0 -51 -100.0Total for Intra-District Funds 3,080 9 51 0 -51 -100.0Gross Funds 5,761 7,803 5,264 6,185 921 17.5*Percent change is based on whole dollars.Note: If applicable, for a breakdown <strong>of</strong> each Grant (Federal and Private), Special Purpose Revenue type and Intra-District agreement,please refer to Schedule 80 <strong>Agency</strong> Summary by Revenue Source in <strong>the</strong> FY 2013 Operating Appendices located on <strong>the</strong> <strong>Office</strong> <strong>of</strong> <strong>the</strong><strong>Chief</strong> <strong>Financial</strong> <strong>Office</strong>r’s website.Department <strong>of</strong> Small and Local Business DevelopmentB-24FY 2013 Proposed <strong>Budget</strong> and <strong>Financial</strong> Plan
FY 2013 Proposed Full-Time Equivalents, by Revenue TypeTable EN0-2 contains <strong>the</strong> proposed FY 2013 FTE level compared to <strong>the</strong> FY 2012 approved FTE level by revenuetype. It also provides FY 2010 and FY 2011 actual data.Table EN0-2ChangeActual Actual Approved Proposed from PercentAppropriated Fund FY 2010 FY 2011 FY 2012 FY 2013 FY 2012 ChangeGeneral FundLocal Funds 23.1 20.3 20.5 24.0 3.5 17.3Total for General Fund 23.1 20.3 20.5 24.0 3.5 17.3Federal ResourcesFederal Grant Funds 0.0 4.0 4.0 7.0 3.0 75.0Total for Federal Resources 0.0 4.0 4.0 7.0 3.0 75.0Intra-District FundsIntra-District Funds 0.0 0.0 0.5 0.0 -0.5 -100.0Total for Intra-District Funds 0.0 0.0 0.5 0.0 -0.5 -100.0Total Proposed FTEs 23.1 24.2 25.0 31.0 6.0 24.2FY 2013 Proposed <strong>Budget</strong> and <strong>Financial</strong> PlanDepartment <strong>of</strong> Small and Local Business DevelopmentB-25
FY 2013 Proposed Operating <strong>Budget</strong>, by Comptroller Source GroupTable EN0-3 contains <strong>the</strong> proposed FY 2013 budget at <strong>the</strong> Comptroller Source Group (object class) level comparedto <strong>the</strong> FY 2012 approved budget. It also provides FY 2010 and FY 2011 actual expenditures.Table EN0-3(dollars in thousands)ChangeActual Actual Approved Proposed from PercentComptroller Source Group FY 2010 FY 2011 FY 2012 FY 2013 FY 2012 Change*11 - Regular Pay - Continuing Full Time 1,672 1,141 1,444 1,652 208 14.412 - Regular Pay - O<strong>the</strong>r 309 301 528 690 162 30.713 - Additional Gross Pay 79 90 0 0 0 N/A14 - Fringe Benefits - Current Personnel 362 281 420 542 122 29.115 - Overtime Pay 0 1 0 0 0 N/ASubtotal Personal Services (PS) 2,422 1,814 2,391 2,884 493 20.620 - Supplies and Materials 26 19 10 49 39 394.830 - Energy, Comm. and Building Rentals 26 0 0 0 0 N/A31 - Telephone, Telegraph, Telegram, Etc. 30 22 0 37 37 N/A33 - Janitorial Services 13 0 0 0 0 N/A34 - Security Services 3 0 0 0 0 N/A35 - Occupancy Fixed Costs 14 0 0 0 0 N/A40 - O<strong>the</strong>r Services and Charges 106 71 23 275 252 1,104.441 - Contractual Services - O<strong>the</strong>r 39 571 695 910 215 30.950 - Subsidies and Transfers 3,082 5,301 2,144 2,000 -144 -6.770 - Equipment and Equipment Rental 0 5 0 29 29 5,726.6Subtotal Nonpersonal Services (NPS) 3,339 5,989 2,873 3,301 428 14.9Gross Funds 5,761 7,803 5,264 6,185 921 17.5*Percent change is based on whole dollars.Department <strong>of</strong> Small and Local Business DevelopmentB-26FY 2013 Proposed <strong>Budget</strong> and <strong>Financial</strong> Plan
Division DescriptionThe Department <strong>of</strong> Small and Local Business Development operates through <strong>the</strong> following 4 divisions:Certification – processes applicants into <strong>the</strong> Certified Business Enterprise (CBE) division, and monitors, tracks,and reports <strong>the</strong> activities <strong>of</strong> District government agencies and non-government project partners to ensure compliancewith set-aside goals regarding <strong>the</strong> utilization and participation <strong>of</strong> CBEs pursuant to District Law 16-33, <strong>the</strong>Small, Local, and Disadvantaged Business Enterprise Development and Assistance Act <strong>of</strong> 2005, as amended.Business Opportunities and Access to Capital – provides District-based businesses with <strong>the</strong> knowledge and capacity-buildingtools necessary to form, develop, and expand by providing classes, training, technical assistance, andadvocacy to promote greater participation in local, federal, and private-sector opportunities.This division contains <strong>the</strong> following 4 activities:■ Capital Acquisition – expands business opportunities for CBEs by increasing <strong>the</strong> availability <strong>of</strong> start-up, working,equity, and development capital bonding; partners with lending institutions to provide financial tools; andprovides targeted technical assistance that will allow for greater preparedness for <strong>the</strong> lending process;■ Procurement Technical Assistance – provides District based small businesses with support to prepare for andgain access to federal government procurement opportunities;■ Business Development – develops and implements business management training sessions and technical assistanceprograms, and identifies and disseminates business and training opportunities to small and local businesses;and■ Trade and Export – provides training, targeted services provision, trade mission support, and business opportunityidentification in order to increase <strong>the</strong> number <strong>of</strong> District small businesses that export, grow <strong>the</strong> dollarvalue <strong>of</strong> exports from District businesses, and coordinate trade missions for qualified District-based businesses.Commercial Revitalization – provides technical and funding assistance that supports, promotes, and fosters economicdevelopment in commercial districts and <strong>the</strong> retention, recruitment, and enhancement <strong>of</strong> small businessesthroughout <strong>the</strong> city.This division contains <strong>the</strong> following 3 activities:■ Capacity Building – provides oversight, funding, compliance monitoring, and support for <strong>the</strong> growth anddevelopment <strong>of</strong> neighborhood business development, and manages grants to community-based organizations;■ Main Streets – fosters retail investment in <strong>the</strong> District by providing services and funding to help communitiesretain and recruit businesses, improve commercial properties and streetscapes, and attract consumers; and■ Commercial Clean Teams – maintains commercial corridors; enhances litter clean-up efforts through <strong>the</strong>removal <strong>of</strong> debris from streets, sidewalks and storefronts; and removes graffiti and illegal sign postings withindesignated clean team service-delivery areas.<strong>Agency</strong> Management – provides for administrative support and <strong>the</strong> required tools to achieve operational and programmaticresults. This division is standard for all agencies using performance-based budgeting.FY 2013 Proposed <strong>Budget</strong> and <strong>Financial</strong> PlanDepartment <strong>of</strong> Small and Local Business DevelopmentB-27
Division Structure ChangeThe Department <strong>of</strong> Small and Local Business Development has no division structure changes in <strong>the</strong> FY 2013 proposedbudget.FY 2013 Proposed Operating <strong>Budget</strong> and FTEs, by Division and ActivityTable EN0-4 contains <strong>the</strong> proposed FY 2013 budget by division and activity compared to <strong>the</strong> FY 2012 approvedbudget. It also provides <strong>the</strong> FY 2011 actual data.Table EN0-4(dollars in thousands)Dollars in ThousandsFull-Time EquivalentsChangeChangeActual Approved Proposed from Actual Approved Proposed fromDivision/Activity FY 2011 FY 2012 FY 2013 FY 2012 FY 2011 FY 2012 FY 2013 FY 2012(1000) <strong>Agency</strong> Management Program(1010) Personnel 16 17 20 2 0.2 0.2 0.2 0.0(1015) Training and Education 13 14 17 2 0.1 0.1 0.2 0.0(1020) Contracting and Procurement 13 14 17 2 0.1 0.1 0.2 0.0(1030) Property Management 13 14 17 2 0.1 0.1 0.2 0.0(1040) Information Technology 102 54 0 -54 0.1 0.1 0.0 -0.1(1050) <strong>Financial</strong> Management 81 120 122 2 0.6 1.2 0.2 -0.9(1055) Risk Management 13 14 17 2 0.1 0.1 0.2 0.0(1060) Legal 149 150 157 7 0.3 0.0 0.0 0.0(1070) Fleet Management 2 3 2 -1 0.0 0.0 0.0 0.0(1080) Communications 13 14 126 112 0.1 0.1 1.4 1.2(1085) Customer Service 63 60 118 58 1.1 1.1 1.7 0.6(1090) Performance Management 14 16 173 157 0.2 0.2 1.3 1.2Subtotal (1000) <strong>Agency</strong> Management Program 493 492 785 293 3.2 3.5 5.6 2.1(2000) Certification(2010) Certification 477 576 619 42 7.7 6.5 5.2 -1.3(2020) Compliance 111 0 0 0 0.0 0.0 0.0 0.0(2050) Capacity Building 0 85 0 -85 0.0 1.0 0.0 -1.0Subtotal (2000) Certification 588 662 619 -43 7.7 7.5 5.2 -2.3(3000) Business Opp and Access to Capital(3010) Training and Education 0 136 0 -136 0.0 1.6 0.0 -1.6(3020) Business Opportunities 269 321 0 -321 2.1 3.2 0.0 -3.2(3030) Capital Acquisition 85 0 135 135 0.0 0.0 1.4 1.4(3040) Procurement Tech Assistance 154 491 481 -10 4.1 4.7 4.0 -0.7(3050) Access to Capital 0 0 0 0 0.8 0.0 0.0 0.0(3060) Business Development 0 0 747 747 0.0 0.0 7.2 7.2(3070) Trade and Export 0 0 796 796 0.0 0.0 3.0 3.0Subtotal (3000) Business Opp and Access to Capital 509 948 2,159 1,211 7.0 9.5 15.6 6.0(Continued on next page)Department <strong>of</strong> Small and Local Business DevelopmentB-28FY 2013 Proposed <strong>Budget</strong> and <strong>Financial</strong> Plan
Table EN0-4 (Continued)(dollars in thousands)Dollars in ThousandsFull-Time EquivalentsChangeChangeActual Approved Proposed from Actual Approved Proposed fromDivision/Activity FY 2011 FY 2012 FY 2013 FY 2012 FY 2011 FY 2012 FY 2013 FY 2012(4000) Commercial Revitalization(4010) Neighborhood Corridor Revitalization 568 779 0 -779 2.6 2.4 0.0 -2.4(4020) Capacity Building 5,645 2,384 465 -1,918 2.1 2.1 1.6 -0.5(4030) Main Streets 0 0 888 888 0.0 0.0 1.6 1.6(4040) Commercial Clean Teams 0 0 1,270 1,270 0.0 0.0 1.5 1.5Subtotal (4000) Commercial Revitalization 6,213 3,162 2,623 -540 4.7 4.5 4.7 0.2(5000) Training and Education(5010) Training and Education Services 0 0 0 0 1.6 0.0 0.0 0.0Subtotal (5000) Training and Education 0 0 0 0 1.6 0.0 0.0 0.0Total Proposed Operating <strong>Budget</strong> 7,803 5,264 6,185 921 24.2 25.0 31.0 6.0(Change is calculated by whole numbers and numbers may not add up due to rounding)Note: For more detailed information regarding <strong>the</strong> proposed funding for <strong>the</strong> activities within this agency’s divisions, please see Schedule 30-PBBProgram Summary by Activity in <strong>the</strong> FY 2013 Operating Appendices located on <strong>the</strong> <strong>Office</strong> <strong>of</strong> <strong>the</strong> <strong>Chief</strong> <strong>Financial</strong> <strong>Office</strong>r’s website.FY 2013 Proposed <strong>Budget</strong> ChangesThe Department <strong>of</strong> Small and Local Business Development’s (DSLBD) proposed FY 2013 gross budget is$6,185,221, which represents a 17.5 percent increase over its FY 2012 approved gross budget <strong>of</strong> $5,264,071. Thebudget is comprised <strong>of</strong> $5,276,440 in Local funds and $908,781 in Federal Grant funds.Current Services Funding LevelThe Current Services Funding Level (CSFL) is a Local funds ONLY representation <strong>of</strong> <strong>the</strong> true cost <strong>of</strong> operatingDistrict agencies, before consideration <strong>of</strong> policy decisions. The CSFL reflects changes from <strong>the</strong> FY 2012 approvedbudget across multiple programs, and it estimates how much it would cost an agency to continue its current programsand operations into <strong>the</strong> following fiscal year. The initial adjustments in <strong>the</strong> budget proposal representchanges that should be compared to <strong>the</strong> FY 2013 CSFL budget and not necessarily changes made to <strong>the</strong> FY 2012Local funds budget. The FY 2013 CSFL adjustments to <strong>the</strong> FY 2012 Local funds budget are described in table 5<strong>of</strong> this agency's budget chapter. Please see <strong>the</strong> CSFL Development section within Volume 1: Executive Summaryfor more information regarding <strong>the</strong> methodology used and components that comprise <strong>the</strong> CSFL.DSLBD’s FY 2013 CSFL budget is $4,899,214, which represents a $47,044, or 1.0 percent, increase over <strong>the</strong>FY 2012 approved Local funds budget <strong>of</strong> $4,852,170.Initial Adjusted <strong>Budget</strong>Eliminate: The Department <strong>of</strong> Small and Local Business Development will eliminate <strong>the</strong> split funding <strong>of</strong> $51,236and 0.5 FTE with <strong>the</strong> Department <strong>of</strong> Employment Services in Intra-District funds. The services that were providedwill be assumed by existing DSLBD staff.FY 2013 Proposed <strong>Budget</strong> and <strong>Financial</strong> PlanDepartment <strong>of</strong> Small and Local Business DevelopmentB-29
Cost Increase: DSLBD will make several modifications to its Local budget to reallocate funding to support <strong>the</strong>development, economic growth, and retention <strong>of</strong> District-based businesses. To help accomplish this mission, <strong>the</strong>agency will add 3.5 Local FTEs at a cost <strong>of</strong> $187,497, and $31,695 in O<strong>the</strong>r Services and Charges. An additional$27,505 is needed for <strong>the</strong> fixed cost assessment for Telecom; $15,831 to align personal services based on historicalspending; and $15,790 for Equipment and Supplies. The State Trade and Export Promotion GrantAward/Procurement Technical Assistance Program will provide DSLBD with federal grant funding for FY 2013 tobe used in <strong>the</strong> Business Opportunities and Access to Capital program. The award will be used to fund 3.0 additionalFTEs at a cost <strong>of</strong> $238,773. Also in Federal Grant funds, O<strong>the</strong>r Services and Charges will realize an increase<strong>of</strong> $196,275, and $58,210 supports planned step increases and associated Fringe Benefits costs. Additional increasesin Federal Grant funds will cover Contractual Services and Supplies and Equipment purchases in <strong>the</strong> amounts<strong>of</strong> $35,716, and $17,011 respectively.Cost Decrease: In Local funds, DSLBD will decrease Subsidies and Transfers by $144,144 in <strong>the</strong> CommercialRevitalization program to partially <strong>of</strong>fset <strong>the</strong> increases in personal services. The agency will also streamline operationalcosts by reducing Contractual Services by $134,174 without an impact on <strong>the</strong> level <strong>of</strong> service.Additionally Adjusted <strong>Budget</strong>Technical Adjustment: Adjustment <strong>of</strong> fringe benefits to restore <strong>the</strong> District Government contribution for employeehealth insurance from 72 percent, implemented in <strong>the</strong> FY 2011 budget, to 75 percent in FY 2013, resulting inan increase <strong>of</strong> $9,017 in Local funds and $2,132 in Federal Grant funds.Policy InitiativesCost Increase: DSLBD will have a Local funds match <strong>of</strong> $119,000 for <strong>the</strong> Procurement Technical Assistance federalgrant.Technical Adjustment: In addition, a Local funds match <strong>of</strong> $249,209 is needed for <strong>the</strong> State Trade and ExportPromotion federal grant.Department <strong>of</strong> Small and Local Business DevelopmentB-30FY 2013 Proposed <strong>Budget</strong> and <strong>Financial</strong> Plan
FY 2012 Approved <strong>Budget</strong> to FY 2013 Proposed <strong>Budget</strong>, by Revenue TypeTable EN0-5 itemizes <strong>the</strong> changes by revenue type between <strong>the</strong> FY 2012 approved budget and <strong>the</strong> FY 2013 proposedbudget.Table EN0-5(dollars in thousands)PROGRAM BUDGET FTELOCAL FUNDS: FY 2012 Approved <strong>Budget</strong> and FTE 4,852 20.5Fringe Benefit Rate Adjustment Multiple Programs 24 0.0Consumer Price Index Multiple Programs 15 0.0Personal Services Growth Factor Multiple Programs 8 0.0FY 2013 Current Services Funding Level <strong>Budget</strong> (CSFL) 4,899 20.5Cost Increase: Additional FTEs salary and Fringe Benefits Multiple Programs 187 3.5Cost Increase: O<strong>the</strong>r Services and Charges Multiple Programs 32 0.0Cost Increase: Fixed costs assessment for Telecom <strong>Agency</strong> Management Program 28 0.0Cost Increase: Align personal services with projected costs Multiple Programs 16 0.0Cost Increase: Equipment, Supplies and Materials Multiple Programs 16 0.0Cost Decrease: Redirect funding from Subsidies and Transfers Commercial Revitalization -144 0.0Cost Decrease: Contracts to streamline operations Multiple Programs -134 0.0FY 2013 Initial Adjusted <strong>Budget</strong> 4,899 24.0Technical Adjustment: Health insurance contribution Multiple Programs 9 0.0FY 2013 Additionally Adjusted <strong>Budget</strong> 4,908 24.0FY 2013 Policy InitiativesTechnical Adjustments: To match a federal grant Business Opportunity and 249 0.0Access to CapitalCost Increase: To match a federal grant Business Opportunity and 119 0.0Access to CapitalLOCAL FUNDS: FY 2013 Proposed <strong>Budget</strong> and FTE 5,276 24.0FEDERAL GRANT FUNDS: FY 2012 Approved <strong>Budget</strong> and FTE 361 4.0Cost Increase: STEP Grant award FTEs salary and fringe Business Opportunity and 239 3.0benefits costsAccess to CapitalCost Increase: O<strong>the</strong>r Services and Charges Business Opportunity and 196 0.0Access to CapitalCost Increase: Align personal services with projected costs Business Opportunity and 58 0.0Access to CapitalCost Increase: Contractual Services Business Opportunity and 36 0.0Access to CapitalCost Increase: Supplies and Equipment purchases Business Opportunity andAccess to Capital17 0.0FY 2013 Initial Adjusted <strong>Budget</strong> 907 7.0Technical Adjustment: Health insurance contribution Multiple Programs 2 0.0FY 2013 Additionally Adjusted <strong>Budget</strong> 909 7.0FEDERAL GRANT FUNDS: FY 2013 Proposed <strong>Budget</strong> and FTE 909 7.0INTRA-DISTRICT FUNDS: FY 2012 Approved <strong>Budget</strong> and FTE 51 0.5Eliminate: Intra-District agreement with <strong>the</strong> Department <strong>Agency</strong> Management Program -51 -0.5<strong>of</strong> Employment ServicesFY 2013 Initial Adjusted <strong>Budget</strong> 0 0.0INTRA-DISTRICT FUNDS: FY 2013 Proposed <strong>Budget</strong> and FTE 0 0.0Gross for EN0 - Department <strong>of</strong> Small and Local Business Development 6,185 31.0(Change is calculated by whole numbers and numbers may not add up due to rounding)FY 2013 Proposed <strong>Budget</strong> and <strong>Financial</strong> PlanDepartment <strong>of</strong> Small and Local Business DevelopmentB-31
<strong>Agency</strong> Performance PlanThe agency has <strong>the</strong> following objectives and performance indicators for its divisions:Objective 1: Extend economic development to District neighborhoods through commercial revitalization initiativesand programs.Objective 2: Assist small businesses with accessing capital, expanding business opportunities and training and educationresources.Objective 3: Increase utilization <strong>of</strong> Certified Business Enterprises (CBEs) and streng<strong>the</strong>n compliance and enforcementprogram.<strong>Agency</strong> Performance MeasuresFY 2010 FY 2011 FY 2011 FY 2012 FY 2013 FY 2014Measure Actual Target Actual Projection Projection ProjectionPercentage <strong>of</strong> certification applications processedwithin 45 business days 1 95% 85% 88% 85% 85% 85%Average number <strong>of</strong> business days for certificationapplication determinations 24 30 28 30 30 30Number <strong>of</strong> participants in small businessNottraining and education activities Available 3,000 3,658 3,000 3,000 3,000Number <strong>of</strong> businesses participating Not Not Notin exporting activities Available Available Available 5 5 5Percentage <strong>of</strong> District Agencies who Not Not Notmet 50 percent CSBE set aside goal Available Available Available 50% 50% 50%Number <strong>of</strong> tree boxes maintained Not Not Notin commercial corridors Available Available Available 20,000 20,000 20,000Number <strong>of</strong> trash bags collected inNotcommercial corridors Available 200,000 121,604 200,000 200,000 200,000Number <strong>of</strong> graffiti removed Not Not Notin commercial corridors Available Available Available 2,000 2,000 2,000Performance Plan Endnotes:1. This is an industry standard measure indicating a percentage <strong>of</strong> certification applications processed on time. Various municipalities use similarmeasures. For example, <strong>the</strong> <strong>Office</strong> <strong>the</strong> Fairfax County Executive in Fairfax employs percentage <strong>of</strong> audits completed on time. The Department<strong>of</strong> Contracting and Procurement in Oakland, CA uses two similar measures: Percentage <strong>of</strong> formal bids completed within 65 days and percentage <strong>of</strong> informal bids completed within 21 days.Department <strong>of</strong> Small and Local Business DevelopmentB-32FY 2013 Proposed <strong>Budget</strong> and <strong>Financial</strong> Plan
<strong>Office</strong> <strong>of</strong> Motion Pictureand Television Development(TK0)www.film.dc.govTelephone: 202-727-6608% ChangeFY 2011 FY 2012 FY 2013 fromDescription Actual Approved Proposed FY 2012Operating <strong>Budget</strong> $644,781 $726,078 $869,450 19.7FTEs 3.6 5.0 5.0 0.8The mission <strong>of</strong> <strong>the</strong> <strong>Office</strong> <strong>of</strong> Motion Picture and TelevisionDevelopment (MPTD) is to initiate, implement and manage <strong>the</strong>operations and logistics <strong>of</strong> programs aimed at generating revenue andstimulating employment and business opportunities in <strong>the</strong> Districtthrough <strong>the</strong> production <strong>of</strong> film, television, video, photography, ando<strong>the</strong>r multimedia projects.Summary <strong>of</strong> ServicesMPTD <strong>of</strong>fers various services to filmmakers including research assistance and location scouting; technical and logisticalassistance; script breakdown; production support; online locations library; community relations; special eventplanning and promotions; and hotel, restaurant and transportation assistance. MPTD also serves as a liaisonbetween <strong>the</strong> film industry and <strong>the</strong> public and private sector.MPTD works with <strong>the</strong> community to create a greater understanding <strong>of</strong> <strong>the</strong> filmmaking process. Relationshipshave been established with all facets <strong>of</strong> <strong>the</strong> community including religious institutions, educational establishments,businesses, and trade unions. MPTD realizes that <strong>the</strong> support and cooperation <strong>of</strong> this cross section <strong>of</strong> groups is vitalto <strong>the</strong> development and enhancement <strong>of</strong> motion picture and television production in <strong>the</strong> District.The agency’s FY 2013 proposed budget is presented in <strong>the</strong> following tables:FY 2013 Proposed <strong>Budget</strong> and <strong>Financial</strong> Plan<strong>Office</strong> <strong>of</strong> Motion Picture and Television DevelopmentB-33
FY 2013 Proposed Gross Funds Operating <strong>Budget</strong>, by Revenue TypeTable TK0-1 contains <strong>the</strong> proposed FY 2013 agency budget compared to <strong>the</strong> FY 2012 approved budget. It alsoprovides FY 2010 and FY 2011 actual expenditures.Table TK0-1(dollars in thousands)ChangeActual Actual Approved Proposed from PercentAppropriated Fund FY 2010 FY 2011 FY 2012 FY 2013 FY 2012 Change*General FundLocal Funds 518 571 671 784 113 16.9Special Purpose Revenue Funds 20 74 55 85 30 54.5Total for General Fund 537 645 726 869 143 19.7Gross Funds 537 645 726 869 143 19.7*Percent change is based on whole dollars.Note: If applicable, for a breakdown <strong>of</strong> each Grant (Federal and Private), Special Purpose Revenue type and Intra-District agreement,please refer to Schedule 80 <strong>Agency</strong> Summary by Revenue Source in <strong>the</strong> FY 2013 Operating Appendices located on <strong>the</strong> <strong>Office</strong> <strong>of</strong> <strong>the</strong><strong>Chief</strong> <strong>Financial</strong> <strong>Office</strong>r’s website.FY 2013 Proposed Full-Time Equivalents, by Revenue TypeTable TK0-2 contains <strong>the</strong> proposed FY 2013 FTE level compared to <strong>the</strong> FY 2012 approved FTE level by revenuetype. It also provides FY 2010 and FY 2011 actual data.Table TK0-2ChangeActual Actual Approved Proposed from PercentAppropriated Fund FY 2010 FY 2011 FY 2012 FY 2013 FY 2012 ChangeGeneral FundLocal Funds 3.9 3.6 5.0 5.0 0.0 0.8Total for General Fund 3.9 3.6 5.0 5.0 0.0 0.8Total Proposed FTEs 3.9 3.6 5.0 5.0 0.0 0.8<strong>Office</strong> <strong>of</strong> Motion Picture and Television DevelopmentB-34FY 2013 Proposed <strong>Budget</strong> and <strong>Financial</strong> Plan
FY 2013 Proposed Operating <strong>Budget</strong>, by Comptroller Source GroupTable TK0-3 contains <strong>the</strong> proposed FY 2013 budget at <strong>the</strong> Comptroller Source Group (object class) level comparedto <strong>the</strong> FY 2012 approved budget. It also provides FY 2010 and FY 2011 actual expenditures.Table TK0-3(dollars in thousands)ChangeActual Actual Approved Proposed from PercentComptroller Source Group FY 2010 FY 2011 FY 2012 FY 2013 FY 2012 Change*11 - Regular Pay - Continuing Full Time 221 218 305 305 1 0.212 - Regular Pay - O<strong>the</strong>r 121 170 139 142 3 1.913 - Additional Gross Pay 3 41 0 0 0 N/A14 - Fringe Benefits - Current Personnel 78 91 90 98 9 9.6Subtotal Personal Services (PS) 422 521 534 545 12 2.220 - Supplies and Materials 4 4 6 13 7 105.930 - Energy, Comm. and Building Rentals 9 0 0 0 0 N/A31 - Telephone, Telegraph, Telegram, Etc. 15 -8 0 0 0 N/A33 - Janitorial Services 4 0 0 0 0 N/A35 - Occupancy Fixed Costs 5 0 0 0 0 N/A40 - O<strong>the</strong>r Services and Charges 75 115 176 301 125 70.970 - Equipment and Equipment Rental 3 13 10 10 0 1.2Subtotal Nonpersonal Services (NPS) 115 124 193 324 132 68.4Gross Funds 537 645 726 869 143 19.7*Percent change is based on whole dollars.FY 2013 Proposed <strong>Budget</strong> and <strong>Financial</strong> Plan<strong>Office</strong> <strong>of</strong> Motion Picture and Television DevelopmentB-35
Program DescriptionThe <strong>Office</strong> <strong>of</strong> Motion Picture and Television Development operates through <strong>the</strong> following 2 programs:Motion Picture and Television Development – promotes <strong>the</strong> District in <strong>the</strong> United States and abroad as a majorvenue for production activity. These outreach efforts generate revenue for <strong>the</strong> District and include <strong>the</strong> followingforms <strong>of</strong> production: feature films; short films; television series; television specials; commercials; documentaries; andcorporate, music, and education videos. This program also promotes <strong>the</strong> use <strong>of</strong> local film and video resources andprovides pre-production, production, and post-production assistance to producers filming in <strong>the</strong> District. In addition,this program stimulates employment opportunities in <strong>the</strong> District through <strong>the</strong> production <strong>of</strong> film, video, photography,and multimedia projects.This program contains <strong>the</strong> following 3 activities:■ Marketing and Promotions – provides <strong>the</strong> industry with information on <strong>the</strong> District’s film/video industry, studioand production facilities, and first-rate technicians and creative talent;■ Production Support – provides filmmakers with a range <strong>of</strong> services designed to save <strong>the</strong>m time, money, andeffort so that <strong>the</strong>y will perceive <strong>the</strong> District as a “film-friendly” environment; and■ Community Outreach – provides filmmakers an opportunity to become involved in <strong>the</strong> community in which<strong>the</strong>y are working.<strong>Agency</strong> Management – provides for administrative support and <strong>the</strong> required tools to achieve operational and programmaticresults. This program is standard for all agencies using performance-based budgeting.Program Structure ChangesThe <strong>Office</strong> <strong>of</strong> Motion Picture and Television Development has no program structure changes in <strong>the</strong> FY 2013 proposedbudget.<strong>Office</strong> <strong>of</strong> Motion Picture and Television DevelopmentB-36FY 2013 Proposed <strong>Budget</strong> and <strong>Financial</strong> Plan
FY 2013 Proposed Operating <strong>Budget</strong> and FTEs, by Program and ActivityTable TK0-4 contains <strong>the</strong> proposed FY 2013 budget by program and activity compared to <strong>the</strong> FY 2012 approved budget.It also provides <strong>the</strong> FY 2011 actual data.Table TK0-4(dollars in thousands)Dollars in ThousandsFull-Time EquivalentsChangeChangeActual Approved Proposed from Actual Approved Proposed fromProgram/Activity FY 2011 FY 2012 FY 2013 FY 2012 FY 2011 FY 2012 FY 2013 FY 2012(1000) <strong>Agency</strong> Management Program(1010) Personnel 19 16 17 0 0.1 0.1 0.1 0.0(1015) Training and Employee Development 19 16 17 0 0.1 0.1 0.1 0.0(1020) Contracting and Procurement 19 27 27 1 0.2 0.2 0.2 0.0(1040) Information Technology 99 27 17 -10 0.1 0.2 0.1 -0.1(1050) <strong>Financial</strong> Management 19 27 27 1 0.2 0.2 0.2 0.0(1070) Fleet Management 1 1 1 0 0.0 0.0 0.0 0.0(1080) Communications 19 16 27 11 0.2 0.1 0.2 0.1(1085) Customer Service 19 27 27 1 0.2 0.2 0.2 0.0(1090) Performance Management 19 16 17 0 0.1 0.1 0.1 0.0Subtotal (1000) <strong>Agency</strong> Management Program 235 173 177 3 1.1 1.2 1.2 0.0(2000) <strong>Office</strong> <strong>of</strong> Motion Picture and TV Development(2011) Marketing and Promotions 102 158 261 103 0.5 1.1 1.1 0.0(2020) Production Support 280 323 411 88 1.9 2.1 2.6 0.5(2030) Community Outreach 27 72 21 -51 0.1 0.6 0.1 -0.5Subtotal (2000) <strong>Office</strong> <strong>of</strong> Motion Picture and TV Development 409 553 693 140 2.5 3.8 3.8 0.0Total Proposed Operating <strong>Budget</strong> 645 726 869 143 3.6 5.0 5.0 0.0(Change is calculated by whole numbers and numbers may not add up due to rounding)Note: For more detailed information regarding <strong>the</strong> proposed funding for <strong>the</strong> activities within this agency’s programs, please see Schedule 30-PBBProgram Summary by Activity in <strong>the</strong> FY 2013 Operating Appendices located on <strong>the</strong> <strong>Office</strong> <strong>of</strong> <strong>the</strong> <strong>Chief</strong> <strong>Financial</strong> <strong>Office</strong>r’s website.FY 2013 Proposed <strong>Budget</strong> and <strong>Financial</strong> Plan<strong>Office</strong> <strong>of</strong> Motion Picture and Television DevelopmentB-37
FY 2013 Proposed <strong>Budget</strong> ChangesThe <strong>Office</strong> <strong>of</strong> Motion Picture and Television Development’s (MPTD) proposed FY 2013 gross budget is $869,450,which represents a 19.7 percent increase over its FY 2012 approved gross budget <strong>of</strong> $726,078. The budget is comprised<strong>of</strong> $784,450 in Local funds and $85,000 in Special Purpose Revenue funds.Current Services Funding LevelThe Current Services Funding Level (CSFL) is a Local funds ONLY representation <strong>of</strong> <strong>the</strong> true cost <strong>of</strong> operatingDistrict agencies, before consideration <strong>of</strong> policy decisions. The CSFL reflects changes from <strong>the</strong> FY 2012 approvedbudget across multiple programs, and it estimates how much it would cost an agency to continue its current programsand operations into <strong>the</strong> following fiscal year. The initial adjustments in <strong>the</strong> budget proposal representchanges that should be compared to <strong>the</strong> FY 2013 CSFL budget and not necessarily changes to <strong>the</strong> FY 2012 Localfunds budget. The FY 2013 CSFL adjustments to <strong>the</strong> FY 2012 Local funds budget are described in table 5 <strong>of</strong> thisagency's budget chapter. Please see <strong>the</strong> CSFL Development section within Volume 1: Executive Summary for moreinformation regarding <strong>the</strong> methodology used and components that comprise <strong>the</strong> CSFL.MPTD’s FY 2013 CSFL budget is $682,330, which represents an $11,253, or 1.7 percent, increase over <strong>the</strong>FY 2012 approved Local funds budget <strong>of</strong> $671,077.Initial Adjusted <strong>Budget</strong>Cost Increase: In Local funds, <strong>the</strong>re were increases <strong>of</strong> $1,142 for salary, step, and Fringe Benefits costs and $534for Supplies and Materials. In Special Purpose Revenue funds, <strong>the</strong>re were increases <strong>of</strong> $11,061 for O<strong>the</strong>r Servicesand Charges, $10,000 for advertising, $5,890 for Supplies and Materials, and $3,049 to cover <strong>the</strong> <strong>Office</strong> <strong>of</strong> <strong>the</strong><strong>Chief</strong> Technology <strong>Office</strong>r’s Information Technology (OCTO-IT) assessment.Cost Decrease: The budget proposal for Local funds reflects a reduction <strong>of</strong> $1,677 in O<strong>the</strong>r Services and Charges.Additionally Adjusted <strong>Budget</strong>Technical Adjustments: Adjustment <strong>of</strong> Fringe Benefits to restore <strong>the</strong> District Government contribution foremployee health insurance from 72 percent, implemented in <strong>the</strong> FY 2011 budget, to 75 percent in FY 2013, resultingin an increase <strong>of</strong> $2,120 in Local funds.Policy InitiativesCost Increase: An additional $100,000 in Local funds was added to cover <strong>the</strong> costs <strong>of</strong> a feasibility study for filmincentives and a District-owned sound stage.<strong>Office</strong> <strong>of</strong> Motion Picture and Television DevelopmentB-38FY 2013 Proposed <strong>Budget</strong> and <strong>Financial</strong> Plan
FY 2012 Approved <strong>Budget</strong> to FY 2013 Proposed <strong>Budget</strong>, by Revenue TypeTable TK0-5 itemizes <strong>the</strong> changes by revenue type between <strong>the</strong> FY 2012 approved budget and <strong>the</strong> FY 2013 proposedbudget.Table TK0-5(dollars in thousands)PROGRAM BUDGET FTELOCAL FUNDS: FY 2012 Approved <strong>Budget</strong> and FTE 671 5.0Fringe Benefit Rate Adjustment Multiple Programs 6 0.0Consumer Price Index Multiple Programs 3 0.0Personal Services Growth Factor Multiple Programs 2 0.0FY 2013 Current Services Funding Level <strong>Budget</strong> (CSFL) 682 5.0Cost Increase: Adjustment for salary, step, and Fringe Benefits costs <strong>Agency</strong> Management Program 1 0.0Cost Increase: Adjustment to Supplies and Materials <strong>Office</strong> <strong>of</strong> Motion Picture and 1 0.0Television DevelopmentCost Decrease: Adjustment to O<strong>the</strong>r Services and Charges Multiple Programs -2 0.0FY 2013 Initial Adjusted <strong>Budget</strong> 682 5.0Technical Adjustment: Health insurance contribution Multiple Programs 2 0.0FY 2013 Additionally Adjusted <strong>Budget</strong> 684 5.0FY 2013 Policy InitiativeCost Increase: Feasibility study for film incentives and a District-owned <strong>Office</strong> <strong>of</strong> Motion Picture and 100 0.0sound stageTelevision DevelopmentLOCAL FUNDS: FY 2013 Proposed <strong>Budget</strong> and FTE 784 5.0SPECIAL PURPOSE REVENUE FUNDS: FY 2012 Approved <strong>Budget</strong> and FTE 55 0.0Cost Increase: Additional funding to support O<strong>the</strong>r Services and Charges <strong>Office</strong> <strong>of</strong> Motion Picture and 11 0.0Television DevelopmentCost Increase: Cover costs related to advertising <strong>Office</strong> <strong>of</strong> Motion Picture and 10 0.0Television DevelopmentCost Increase: Additional funding for Supplies and Materials <strong>Office</strong> <strong>of</strong> Motion Picture and 6 0.0Television DevelopmentCost Increase: Adjustment for OCTO-IT assessment cost <strong>Office</strong> <strong>of</strong> Motion Picture and 3 0.0Television DevelopmentFY 2013 Initial Adjusted <strong>Budget</strong> 85 0.0SPECIAL PURPOSE REVENUE FUNDS: FY 2013 Proposed <strong>Budget</strong> and FTE 85 0.0Gross for TK0 - <strong>Office</strong> <strong>of</strong> Motion Picture and Television Development 869 5.0(Change is calculated by whole numbers and numbers may not add up due to rounding)FY 2013 Proposed <strong>Budget</strong> and <strong>Financial</strong> Plan<strong>Office</strong> <strong>of</strong> Motion Picture and Television DevelopmentB-39
<strong>Agency</strong> Performance PlanThe agency’s performance plan has <strong>the</strong> following objectives for FY 2013:Objective 1: Expand overall level <strong>of</strong> motion picture and television production activity, increase visibility, andpromote <strong>the</strong> District as a “film-friendly” city.Objective 2: Create employment and business opportunities in motion picture and television production, whiledeveloping a qualified and skilled workforce to support <strong>the</strong> growth <strong>of</strong> <strong>the</strong> film industry in <strong>the</strong> District.Objective 3: Expand community outreach and enhance constituent communication.<strong>Agency</strong> Performance MeasuresFY 2010 FY 2011 FY 2011 FY 2012 FY 2013 FY 2014Measure Actual Target Actual Projection Projection ProjectionFilm and video projects produced in <strong>the</strong> District 320 320 250 330 340 350Motion picture and television industry spending in 12.5 $20 $20.5 $20 $20 $25<strong>the</strong> District 1 Million Million Million Million Million MillionFilmmakers that rank <strong>the</strong> overall film experience in<strong>the</strong> District as satisfactory or very satisfactory 90% 90% 99% 90% 90% 90%Industry events or activities attended and/orparticipated in to market <strong>the</strong> District as a productionvenue 4 4 19 4 4 5Contacts made (in person or over <strong>the</strong> phone) withlocation filmmaking decision-makers to promote<strong>the</strong> District as a production venue 98 60 100 70 80 90Temporary job and training opportunities in <strong>the</strong>motion picture and television industry 2,761 2,200 3,854 2,250 2,300 2,500Events/activities aimed at connecting District residentswith job and training opportunities 7 12 5 5 5 5Performance Plan Endnotes:1 MPTD projected higher production expenditures due to major motion pictures scheduled to film in <strong>the</strong> District during <strong>the</strong> latter half <strong>of</strong> FY 2010. Specifically, Transformers 3 was expected to generate significantspending in <strong>the</strong> District (upwards <strong>of</strong> $8 million). This production changed <strong>the</strong>ir filming dates to October 2010, which is <strong>the</strong> start <strong>of</strong> FY 2011. As a result, <strong>the</strong>ir expenditures are not included in <strong>the</strong> FY 2010 reporting.<strong>Office</strong> <strong>of</strong> Motion Picture and Television DevelopmentB-40FY 2013 Proposed <strong>Budget</strong> and <strong>Financial</strong> Plan
<strong>Office</strong> <strong>of</strong> Zoningwww.dcoz.dc.govTelephone: 202-727-6311(BJ0)% ChangeFY 2011 FY 2012 FY 2013 fromDescription Actual Approved Proposed FY 2012Operating <strong>Budget</strong> $2,485,023 $2,567,588 $2,620,137 2.0FTEs 18.8 19.0 19.0 0.0The mission <strong>of</strong> <strong>the</strong> <strong>Office</strong> <strong>of</strong> Zoning (OZ) is to provide administrative,pr<strong>of</strong>essional, and technical assistance to <strong>the</strong> ZoningCommission (ZC) and <strong>the</strong> Board <strong>of</strong> Zoning Adjustment (BZA)in support <strong>of</strong> <strong>the</strong>ir oversight and adjudication <strong>of</strong> zoning mattersin <strong>the</strong> District <strong>of</strong> Columbia.Summary <strong>of</strong> ServicesOZ administers <strong>the</strong> zoning application process for <strong>the</strong> ZC and <strong>the</strong> BZA. The agency reviews and accepts applications,schedules hearings to determine whe<strong>the</strong>r cases meet specified zoning criteria, schedules meetings to makedeterminations with respect to pending applications, and issues legal orders. Technology plays a critical role in support<strong>of</strong> this process by enhancing effectiveness and transparency. OZ also spearheads outreach to citizens <strong>of</strong> <strong>the</strong>District <strong>of</strong> Columbia to ensure a robust understanding <strong>of</strong> <strong>the</strong> zoning application process.The agency’s FY 2013 proposed budget is presented in <strong>the</strong> following tables:FY 2013 Proposed <strong>Budget</strong> and <strong>Financial</strong> Plan<strong>Office</strong> <strong>of</strong> ZoningB-41
FY 2013 Proposed Gross Funds Operating <strong>Budget</strong>, by Revenue TypeTable BJ0-1 contains <strong>the</strong> proposed FY 2013 agency budget compared to <strong>the</strong> FY 2012 approved budget. It alsoprovides FY 2010 and FY 2011 actual expenditures.Table BJ0-1(dollars in thousands)ChangeActual Actual Approved Proposed from PercentAppropriated Fund FY 2010 FY 2011 FY 2012 FY 2013 FY 2012 Change*General FundLocal Funds 2,986 2,466 2,544 2,596 53 2.1Total for General Fund 2,986 2,466 2,544 2,596 53 2.1Intra-District FundsIntra-District Funds 19 19 24 24 0 0.0Total for Intra-District Funds 19 19 24 24 0 0.0Gross Funds 3,005 2,485 2,568 2,620 53 2.0*Percent change is based on whole dollars.Note: If applicable, for a breakdown <strong>of</strong> each Grant (Federal and Private), Special Purpose Revenue type and Intra-District agreement, pleaserefer to Schedule 80 <strong>Agency</strong> Summary by Revenue Source in <strong>the</strong> FY 2013 Operating Appendices located on <strong>the</strong> <strong>Office</strong> <strong>of</strong> <strong>the</strong> <strong>Chief</strong><strong>Financial</strong> <strong>Office</strong>r’s website.FY 2013 Proposed Full-Time Equivalents, by Revenue TypeTable BJ0-2 contains <strong>the</strong> proposed FY 2013 FTE level compared to <strong>the</strong> FY 2012 approved FTE level by revenuetype. It also provides FY 2010 and FY 2011 actual data.Table BJ0-2ChangeActual Actual Approved Proposed from PercentAppropriated Fund FY 2010 FY 2011 FY 2012 FY 2013 FY 2012 ChangeGeneral FundLocal Funds 18.8 18.8 19.0 19.0 0.0 0.0Total for General Fund 18.8 18.8 19.0 19.0 0.0 0.0Total Proposed FTEs 18.8 18.8 19.0 19.0 0.0 0.0<strong>Office</strong> <strong>of</strong> ZoningB-42FY 2013 Proposed <strong>Budget</strong> and <strong>Financial</strong> Plan
FY 2013 Proposed Operating <strong>Budget</strong>, by Comptroller Source GroupTable BJ0-3 contains <strong>the</strong> proposed FY 2013 budget at <strong>the</strong> Comptroller Source Group (object class) level comparedto <strong>the</strong> FY 2012 approved budget. It also provides FY 2010 and FY 2011 actual expenditures.Table BJ0-3(dollars in thousands)ChangeActual Actual Approved Proposed from PercentComptroller Source Group FY 2010 FY 2011 FY 2012 FY 2013 FY 2012 Change*11 - Regular Pay - Continuing Full Time 1,417 1,297 1,383 1,450 66 4.812 - Regular Pay - O<strong>the</strong>r 113 203 162 106 -55 -34.213 - Additional Gross Pay 52 24 0 0 0 N/A14 - Fringe Benefits - Current Personnel 298 299 338 370 32 9.6Subtotal Personal Services (PS) 1,879 1,823 1,883 1,926 43 2.320 - Supplies and Materials 49 34 37 37 0 0.030 - Energy, Comm. and Building Rentals 59 0 0 0 0 N/A31 - Telephone, Telegraph, Telegram, Etc. 12 0 0 0 0 N/A33 - Janitorial Services 25 0 0 0 0 N/A34 - Security Services 22 0 0 0 0 N/A35 - Occupancy Fixed Costs 38 0 0 0 0 N/A40 - O<strong>the</strong>r Services and Charges 255 275 300 310 9 3.141 - Contractual Services - O<strong>the</strong>r 606 324 318 318 0 0.070 - Equipment and Equipment Rental 60 29 30 30 0 0.0Subtotal Nonpersonal Services (NPS) 1,126 662 685 694 9 1.4Gross Funds 3,005 2,485 2,568 2,620 53 2.0*Percent change is based on whole dollars.FY 2013 Proposed <strong>Budget</strong> and <strong>Financial</strong> Plan<strong>Office</strong> <strong>of</strong> ZoningB-43
Program DescriptionThe <strong>Office</strong> <strong>of</strong> Zoning operates through <strong>the</strong> following 2 programs:Zoning Services - provides assistance, information and services to <strong>the</strong> ZC, BZA, o<strong>the</strong>r government agencies, applicants,businesses, and <strong>the</strong> general public regarding <strong>the</strong> District’s zoning processes.This program contains <strong>the</strong> following 4 activities:■ Zoning Services - provides administrative, pr<strong>of</strong>essional, and technical assistance to <strong>the</strong> ZC and BZA in support<strong>of</strong> <strong>the</strong>ir oversight and adjudication <strong>of</strong> zoning matters in <strong>the</strong> District, and provides public outreach to ensurethat <strong>the</strong> District’s zoning processes are easily understandable and accessible to <strong>the</strong> public;■ Compliance Review - investigates and evaluates complaints <strong>of</strong> non-compliance with <strong>the</strong> conditions <strong>of</strong> ZC andBZA orders to <strong>the</strong> public, so that non-compliance issues can be resolved by or referred to <strong>the</strong> Department <strong>of</strong>Consumer and Regulatory Affairs for enforcement;■ Zoning Information Management, Analysis and Distribution - provides new systems to automate zoninginformation and facilitates delivery <strong>of</strong> zoning services to <strong>the</strong> public and o<strong>the</strong>r District agencies; and■ Zoning Certifications - provides au<strong>the</strong>ntication <strong>of</strong> zoning classification <strong>of</strong> property to <strong>the</strong> public, includingdevelopers, architects, lawyers, realtors, tax assessors, land owners, and o<strong>the</strong>rs in <strong>the</strong> land use business, and providescertified copies <strong>of</strong> ZC and BZA case files so that courts can have full case documents required for decision-making.<strong>Agency</strong> Management – provides for administrative support and <strong>the</strong> required tools to achieve operational and programmaticresults. This program is standard for all agencies using performance-based budgeting.Program Structure ChangeThe <strong>Office</strong> <strong>of</strong> Zoning has no program structure changes in <strong>the</strong> FY 2013 proposed budget.<strong>Office</strong> <strong>of</strong> ZoningB-44FY 2013 Proposed <strong>Budget</strong> and <strong>Financial</strong> Plan
FY 2013 Proposed Operating <strong>Budget</strong> and FTEs, by Program and ActivityTable BJ0-4 contains <strong>the</strong> proposed FY 2013 budget by program and activity compared to <strong>the</strong> FY 2012 approved budget.It also provides <strong>the</strong> FY 2011 actual data.Table BJ0-4(dollars in thousands)Dollars in ThousandsFull-Time EquivalentsChangeChangeActual Approved Proposed from Actual Approved Proposed fromProgram/Activity FY 2011 FY 2012 FY 2013 FY 2012 FY 2011 FY 2012 FY 2013 FY 2012(1000) <strong>Agency</strong> Management Program(1010) Personnel 25 27 27 0 0.4 0.4 0.4 0.0(1015) Training and Employee Development 10 11 11 0 0.1 0.1 0.1 0.0(1020) Contracting and Procurement 40 42 42 1 0.3 0.3 0.3 0.0(1030) Property Management 0 10 0 -10 0.0 0.0 0.0 0.0(1040) Information Technology 89 89 92 3 0.7 0.7 0.7 0.0(1050) <strong>Financial</strong> Management 27 29 29 1 0.2 0.2 0.2 0.0(1060) Legal 385 352 444 92 1.5 1.6 2.5 1.0(1080) Communications 60 65 66 1 0.4 0.4 0.4 0.0(1085) Customer Service 109 114 118 5 1.6 1.6 1.6 0.0(1090) Performance Management 13 14 14 0 0.1 0.1 0.1 0.0Subtotal (1000) <strong>Agency</strong> Management Program 758 751 844 93 5.4 5.5 6.4 1.0(2000) Zoning Services(2010) Zoning Services 1,499 1,585 1,538 -47 11.4 11.4 10.4 -1.0(2020) Compliance Review 59 58 60 2 0.4 0.6 0.6 0.0(2030) Information Management 106 108 110 2 0.8 0.8 0.8 0.0(2040) Zoning Certifications 63 66 68 2 0.7 0.8 0.8 0.0Subtotal (2000) Zoning Services 1,727 1,816 1,776 -41 13.4 13.5 12.6 -1.0Total Proposed Operating <strong>Budget</strong> 2,485 2,568 2,620 53 18.8 19.0 19.0 0.0(Change is calculated by whole numbers and numbers may not add up due to rounding)Note: For more detailed information regarding <strong>the</strong> proposed funding for <strong>the</strong> activities within this agency’s programs, please see Schedule 30-PBBProgram Summary by Activity in <strong>the</strong> FY 2013 Operating Appendices located on <strong>the</strong> <strong>Office</strong> <strong>of</strong> <strong>the</strong> <strong>Chief</strong> <strong>Financial</strong> <strong>Office</strong>r’s website.FY 2013 Proposed <strong>Budget</strong> ChangesThe <strong>Office</strong> <strong>of</strong> Zoning’s (OZ) proposed FY 2013 gross budget is $2,620,137, which represents a 2.0 percentincrease over its FY 2012 approved gross budget <strong>of</strong> $2,567,588. The budget is comprised <strong>of</strong> $2,596,137 in Localfunds and $24,000 in Intra-District funds.Current Services Funding LevelThe Current Services Funding Level (CSFL) is a Local funds ONLY representation <strong>of</strong> <strong>the</strong> true cost <strong>of</strong> operatingDistrict agencies, before consideration <strong>of</strong> policy decisions. The CSFL reflects changes from <strong>the</strong> FY 2012 approvedbudget across multiple programs, and it estimates how much it would cost an agency to continue its current programsand operations into <strong>the</strong> following fiscal year. The initial adjustments in <strong>the</strong> budget proposal representchanges that should be compared to <strong>the</strong> FY 2013 CSFL budget and not necessarily changes made to <strong>the</strong> FY 2012Local funds budget. The FY 2013 CSFL adjustments to <strong>the</strong> FY 2012 Local funds budget are described in table 5<strong>of</strong> this agency's budget chapter. Please see <strong>the</strong> CSFL Development section within Volume 1: Executive Summaryfor more information regarding <strong>the</strong> methodology used and components that comprise <strong>the</strong> CSFL.FY 2013 Proposed <strong>Budget</strong> and <strong>Financial</strong> Plan<strong>Office</strong> <strong>of</strong> ZoningB-45
OZ’s FY 2013 CSFL budget is $2,588,163, which represents a $44,575, or 1.8 percent, increase over <strong>the</strong> FY 2012approved Local funds budget <strong>of</strong> $2,543,588.Initial Adjusted <strong>Budget</strong>Cost Increase: The Local funds budget within O<strong>the</strong>r Services and Charges increased by $15,331 to support attorneyservices costs through an Intra-District agreement with <strong>the</strong> <strong>Office</strong> <strong>of</strong> <strong>the</strong> Attorney General. In addition, anincrease <strong>of</strong> $3,785 aligns personal services costs based on historical spending within <strong>the</strong> agency.Cost Decrease: The Local funds budget was reduced by $17,782 in OZ’s court reporting contract and by $1,334in Supplies and Equipment purchases.Additional Adjusted <strong>Budget</strong>Technical Adjustment: Adjustment <strong>of</strong> Fringe Benefits to restore <strong>the</strong> District Government contribution for employeehealth insurance from 72 percent, implemented in <strong>the</strong> FY 2011 budget, to 75 percent in FY 2013, resulting inan increase <strong>of</strong> $7,974 in Local funds.FY 2012 Approved <strong>Budget</strong> to FY 2013 Proposed <strong>Budget</strong>, by Revenue TypeTable BJ0-5 itemizes <strong>the</strong> changes by revenue type between <strong>the</strong> FY 2012 approved budget and <strong>the</strong> FY 2013 proposedbudget.Table BJ0-5(dollars in thousands)PROGRAM BUDGET FTELOCAL FUNDS: FY 2012 Approved <strong>Budget</strong> and FTE 2,544 19.0Fringe Benefit Rate Adjustment Multiple Programs 24 0.0Consumer Price Index Multiple Programs 13 0.0Personal Services Growth Factor Multiple Programs 8 0.0FY 2013 Current Services Funding Level <strong>Budget</strong> (CSFL) 2,588 19.0Cost Increase: O<strong>the</strong>r Services and Charges Multiple Programs 15 0.0Cost Increase: Align personal services with projected costs Multiple Programs 4 0.0Cost Decrease: Court reporting contract Multiple Programs -18 0.0Cost Decrease: Supplies and Equipment Multiple Programs -1 0.0FY 2013 Additionally Adjusted <strong>Budget</strong> 2,588 19.0Technical Adjustment: Health insurance contribution Multiple Programs 8 0.0FY 2013 Initial Adjusted <strong>Budget</strong> 2,596 19.0LOCAL FUNDS: FY 2013 Proposed <strong>Budget</strong> and FTE 2,596 19.0INTRA-DISTRICT FUNDS: FY 2012 Approved <strong>Budget</strong> and FTE 24 0.0No Changes 0 0.0FY 2013 Initial Adjusted <strong>Budget</strong> 24 0.0INTRA-DISTRICT FUNDS: FY 2013 Proposed <strong>Budget</strong> and FTE 24 0.0Gross for BJ0 - <strong>Office</strong> <strong>of</strong> Zoning 2,620 19.0(Change is calculated by whole numbers and numbers may not add up due to rounding)<strong>Office</strong> <strong>of</strong> ZoningB-46FY 2013 Proposed <strong>Budget</strong> and <strong>Financial</strong> Plan
<strong>Agency</strong> Performance PlanThe agency’s performance plan has <strong>the</strong> following objectives for FY 2013:Objective 1: Create a convenient, easy to use, and understandable zoning process through website development,expansive outreach and educational programs for District residents and businesses.Objective 2: Leverage new and existing technology to fur<strong>the</strong>r ensure that <strong>the</strong> District <strong>of</strong> Columbia’s zoning processesare easily understandable and accessible to <strong>the</strong> public.Objective 3: Streamline Zoning Regulations to enhance efficiency and transparency <strong>of</strong> zoning processes.Objective 4: Efficiently manage <strong>the</strong> operations <strong>of</strong> <strong>the</strong> agency.<strong>Agency</strong> Performance MeasuresFY 2010 FY 2011 FY 2011 FY 2012 FY 2013 FY 2014Measure Actual Target Actual Projection Projection ProjectionPercent <strong>of</strong> zoning certifications completed withintwo weeks 100% 100% 100% 100% 100% 100%Percent <strong>of</strong> BZA summary orders issued withintwo weeks <strong>of</strong> decision 100% 98% 100% 98% 98% 98%Percent <strong>of</strong> BZA hearings scheduled within fourmonths <strong>of</strong> application acceptance (excludingrecess month) 100% 85% 92.77% 90% 90% 90%Percent <strong>of</strong> website inquiries responded to within24 hours or <strong>the</strong> next business day 1 95.8% 98% 99.59% 98% 98% 98%Performance Plan Endnote:1. The industry standard for this measure is less than 70 percent. This information can be found in Improving Citizen Customer Service:Metrics, Benchmarks, Best Practices, and Technology Trends, US General Service Administration.FY 2013 Proposed <strong>Budget</strong> and <strong>Financial</strong> Plan<strong>Office</strong> <strong>of</strong> ZoningB-47
Department <strong>of</strong> Housing andCommunity Development(DB0)www.dhcd.dc.govTelephone: 202-442-7200% ChangeFY 2011 FY 2012 FY 2013 fromDescription Actual Approved Proposed FY 2012Operating <strong>Budget</strong> $101,096,878 $144,318,583 $125,842,249 -12.8FTEs 107.6 146.5 146.5 0.0The mission <strong>of</strong> <strong>the</strong> Department <strong>of</strong> Housing and CommunityDevelopment (DHCD) is to create and preserve opportunities foraffordable housing and economic development, and revitalize underservedcommunities in <strong>the</strong> District <strong>of</strong> Columbia.Summary <strong>of</strong> ServicesDHCD’s fundamental activities consist <strong>of</strong> financial operations, administration <strong>of</strong> regulations, and support <strong>of</strong> <strong>the</strong>independent Rental Housing Commission. The specific strategic objectives that DHCD focuses on to stimulateeconomic development and spur <strong>the</strong> dream <strong>of</strong> home ownership in underserved communities: (1) preserve andincrease <strong>the</strong> supply <strong>of</strong> quality affordable housing throughout <strong>the</strong> District; (2) increase homeownership opportunitiesto residents <strong>of</strong> low and moderate income households; and (3) revitalize District neighborhoods by promotingcommunity development that embraces economic opportunities for local businesses. DHCD creates and preservesaffordable housing by providing low-cost gap financing and subsidies for single-family residential rehabilitation andmulti-family construction projects to garner affordable rental and homeownership opportunities throughout <strong>the</strong>city. DHCD also leverages its appropriated Local and Federal funding to help finance community facilities, acquireproperty, and administer disposition activities for vacant and abandoned properties to help stabilize District neighborhoodsand provide new local opportunities. DHCD partners with community-based organizations city-wideto implement residential and community services that include homeownership assistance programs, housing counselingservices, storefront façade improvement initiatives, and small business technical assistance services. In addition,DHCD administers <strong>the</strong> rental housing regulations that govern condominium and cooperative conversions,rent control, inclusionary zoning, and affordable dwelling unit programs. The Affordable Housing Locator is alsoa service <strong>of</strong> DHCD and is available online at http://dchousingsearch.org. All <strong>of</strong> <strong>the</strong>se programs and services can beaccessed through DHCD’s Housing Resource Center located in <strong>the</strong> Historic Anacostia neighborhood in Ward 8.The agency’s FY 2013 proposed budget is presented in <strong>the</strong> following tables:FY 2013 Proposed <strong>Budget</strong> and <strong>Financial</strong> PlanDepartment <strong>of</strong> Housing and Community DevelopmentB-49
FY 2013 Proposed Gross Funds Operating <strong>Budget</strong>, by Revenue TypeTable DB0-1 contains <strong>the</strong> proposed FY 2013 agency budget compared to <strong>the</strong> FY 2012 approved budget. It alsoprovides FY 2010 and FY 2011 actual expenditures.Table DB0-1(dollars in thousands)ChangeActual Actual Approved Proposed from PercentAppropriated Fund FY 2010 FY 2011 FY 2012 FY 2013 FY 2012 Change*General FundLocal Funds 22,220 10,772 12,221 12,591 370 3.0Special Purpose Revenue Funds 4,237 6,610 7,798 6,500 -1,298 -16.6Total for General Fund 26,457 17,382 20,019 19,091 -928 -4.6Federal ResourcesFederal Grant Funds 58,729 60,087 79,934 38,147 -41,786 -52.3Total for Federal Resources 58,729 60,087 79,934 38,147 -41,786 -52.3Private FundsPrivate Donations 127 79 0 0 0 N/ATotal for Private Funds 127 79 0 0 0 N/AIntra-District FundsIntra-District Funds 315 23,549 44,366 68,604 24,238 54.6Total for Intra-District Funds 315 23,549 44,366 68,604 24,238 54.6Gross Funds 85,627 101,097 144,319 125,842 -18,476 -12.8*Percent change is based on whole dollars.Note: If applicable, for a breakdown <strong>of</strong> each Grant (Federal and Private), Special Purpose Revenue type and Intra-District agreement,please refer to Schedule 80 <strong>Agency</strong> Summary by Revenue Source in <strong>the</strong> FY 2013 Operating Appendices located on <strong>the</strong> <strong>Office</strong> <strong>of</strong> <strong>the</strong><strong>Chief</strong> <strong>Financial</strong> <strong>Office</strong>r’s website.Department <strong>of</strong> Housing and Community DevelopmentB-50FY 2013 Proposed <strong>Budget</strong> and <strong>Financial</strong> Plan
FY 2013 Proposed Full-Time Equivalents, by Revenue TypeTable DB0-2 contains <strong>the</strong> proposed FY 2013 FTE level compared to <strong>the</strong> FY 2012 approved FTE level by revenuetype. It also provides FY 2010 and FY 2011 actual data.Table DB0-2ChangeActual Actual Approved Proposed from PercentAppropriated Fund FY 2010 FY 2011 FY 2012 FY 2013 FY 2012 ChangeGeneral FundLocal Funds 22.9 31.8 30.8 30.7 -0.1 -0.4Special Purpose Revenue Funds 14.9 18.2 22.2 33.6 11.5 51.9Total for General Fund 37.7 49.9 53.0 64.3 11.4 21.5Federal ResourcesFederal Grant Funds 69.4 39.7 60.9 35.6 -25.3 -41.6Total for Federal Resources 69.4 39.7 60.9 35.6 -25.3 -41.6Intra-District FundsIntra-District Funds 0.0 18.0 32.7 46.6 13.9 42.6Total for Intra-District Funds 0.0 18.0 32.7 46.6 13.9 42.6Total Proposed FTEs 107.2 107.6 146.5 146.5 0.0 0.0FY 2013 Proposed <strong>Budget</strong> and <strong>Financial</strong> PlanDepartment <strong>of</strong> Housing and Community DevelopmentB-51
FY 2013 Proposed Operating <strong>Budget</strong>, by Comptroller Source GroupTable DB0-3 contains <strong>the</strong> proposed FY 2013 budget at <strong>the</strong> Comptroller Source Group (object class) level comparedto <strong>the</strong> FY 2012 approved budget. It also provides FY 2010 and FY 2011 actual expenditures.Table DB0-3(dollars in thousands)ChangeActual Actual Approved Proposed from PercentComptroller Source Group FY 2010 FY 2011 FY 2012 FY 2013 FY 2012 Change*11 - Regular Pay - Continuing Full Time 7,723 7,470 10,586 10,108 -478 -4.512 - Regular Pay - O<strong>the</strong>r 1,343 1,229 1,157 1,588 431 37.313 - Additional Gross Pay 246 193 176 176 0 0.014 - Fringe Benefits - Current Personnel 1,743 1,996 1,706 1,857 151 8.815 - Overtime Pay 7 3 0 0 0 N/ASubtotal Personal Services (PS) 11,062 10,891 13,625 13,729 104 0.820 - Supplies and Materials 51 81 247 244 -4 -1.430 - Energy, Comm. and Building Rentals 17 25 9 58 50 575.331 - Telephone, Telegraph, Telegram, Etc. 121 81 96 119 22 22.832 - Rentals - Land and Structures 2,982 1,337 1,888 1,973 85 4.534 - Security Services 6 6 6 33 26 415.935 - Occupancy Fixed Costs 15 6 11 50 39 337.340 - O<strong>the</strong>r Services and Charges 1,425 1,006 1,576 1,867 291 18.541 - Contractual Services - O<strong>the</strong>r 1,577 4,890 24,083 22,626 -1,457 -6.150 - Subsidies and Transfers 68,324 82,714 102,548 84,920 -17,628 -17.270 - Equipment and Equipment Rental 46 58 229 224 -5 -2.2Subtotal Nonpersonal Services (NPS) 74,564 90,206 130,693 112,113 -18,580 -14.2Gross Funds 85,627 101,097 144,319 125,842 -18,476 -12.8*Percent change is based on whole dollars.Department <strong>of</strong> Housing and Community DevelopmentB-52FY 2013 Proposed <strong>Budget</strong> and <strong>Financial</strong> Plan
Division DescriptionThe Department <strong>of</strong> Housing and Community Development operates through <strong>the</strong> following 9 divisions:Development Finance Division (DFD) – provides funding for <strong>the</strong> development <strong>of</strong> rental, homeownership andcommunity facility developments that serve District <strong>of</strong> Columbia neighborhoods. As both <strong>the</strong> creation and preservation<strong>of</strong> affordable housing units are important to DHCD, DFD plays a prominent role in helping <strong>the</strong> agencyachieve its annual multi-family housing production goals.This division contains <strong>the</strong> following 3 activities:■ Affordable Housing Project Financing – provides funding through a competitive Request for Proposal (RFP)funding process that targets communities and types <strong>of</strong> development needed to revitalize neighborhoods. Thisactivity also provides development financing and regulatory oversight to nonpr<strong>of</strong>it and for-pr<strong>of</strong>it developers sothat <strong>the</strong>y can develop properties as affordable ownership and rental units. This activity includes <strong>the</strong> preparation<strong>of</strong> Notice <strong>of</strong> Funding Availability and RFP documents, management <strong>of</strong> <strong>the</strong> application and selection process,project management meetings, construction overviews, underwriting, architectural reviews, monitoring reports,funding request presentations, loan closings, and project monitoring services;■ Community Facilities Project Financing – provides funding through a competitive RFP funding process fordevelopment financing and regulatory oversight to nonpr<strong>of</strong>it and for-pr<strong>of</strong>it developers so that <strong>the</strong>y can developproperties as neighborhood community/commercial facilities. This activity includes <strong>the</strong> preparation <strong>of</strong>Notice <strong>of</strong> Funding Availability and RFP documents, management <strong>of</strong> <strong>the</strong> application and selection process, projectmanagement meetings, construction overviews, underwriting, architectural reviews, monitoring reports,funding request presentations, loan closings, and project monitoring services; and■ Tenant Opportunity to Purchase Assistance – provides organizational and development assistance to tenantorganizations expressing interest in purchasing <strong>the</strong>ir buildings after receiving a Right-<strong>of</strong>-First Refusal notice;education and below-market-cost management services to tenant organizations that have purchased <strong>the</strong>ir buildings;and financial assistance in <strong>the</strong> form <strong>of</strong> seed money, earnest money deposits, and acquisition loans to lowto-moderateincome tenant organizations wishing to purchase <strong>the</strong>ir buildings after receiving <strong>the</strong> Right-<strong>of</strong>-FirstRefusal notice. Additional services provided in <strong>the</strong> technical assistance program include housing counseling services,contract management, and monitoring.Residential and Community Services Division (RCSD) – provides funding for programs focused on householdlevel housing needs and neighborhood revitalization. RCSD works through neighborhood-based organizationsproviding comprehensive housing counseling, small business technical assistance, and façade improvement opportunities.RCSD administers <strong>the</strong> District’s Home Purchase Assistance Program and Employee Assisted HousingPrograms, which provide financial assistance for low and moderate income households and District employees for<strong>the</strong> purpose <strong>of</strong> first-time home purchase. The division also provides rehabilitation resources, including grants forlead hazard remediation to eligible units and loans as well as grants to eligible District homeowners in order to preservehomeownership in <strong>the</strong> District.This division contains <strong>the</strong> following 6 activities:■ Community Services - Housing Counseling (Neighborhood Based Activities) – provides funding for counselingservices to tenants, potential homeowners, and current homeowners in support <strong>of</strong> various DHCD programs;■ Community Services - Commercial Revitalization – provides grants to neighborhood-based organizations fortechnical assistance to small businesses and storefront facade improvements in commercial corridors;■ Residential Services - Home Purchase Assistance Program (HPAP) – provides down payment and closing costassistance to low and moderate income District residents so that <strong>the</strong>y can become first-time homebuyers in <strong>the</strong>District <strong>of</strong> Columbia;FY 2013 Proposed <strong>Budget</strong> and <strong>Financial</strong> PlanDepartment <strong>of</strong> Housing and Community DevelopmentB-53
■■■Residential Services - Employer Assisted Housing Program (EAHP) – provides down payment and closingcost assistance to qualified District <strong>of</strong> Columbia government employees;Residential Services - Lead Safe Washington – provides funding to reduce lead-based paint hazards in eligiblesingle and multi-family dwellings; andResidential Services - Single Family Rehabilitation – helps households finance up to $75,000 in loans for homerepairs that will address District housing code violations, such as repairing walls and floors, replacing windows,and repairing plumbing, electrical, and heating systems.Property Acquisition and Disposition Division (PADD) – stabilizes neighborhoods by decreasing <strong>the</strong> number <strong>of</strong>vacant and abandoned residential properties in <strong>the</strong> District, and transforming vacant and/or abandoned residentialproperties into homeownership opportunities for District <strong>of</strong> Columbia residents at all income levels. PADD hasthree main functions: (1) encourage property owners to rehabilitate and/or occupy <strong>the</strong>ir vacant and abandoned residentialproperty; (2) acquire vacant, abandoned and deteriorated properties through negotiated friendly sale, eminentdomain, donation, or tax sale foreclosure; and (3) dispose <strong>of</strong> properties in <strong>the</strong> PADD inventory by selling <strong>the</strong>properties to individuals or developers to be rehabilitated into high quality affordable and market-rate single-familyand/or multi-family for-sale housing in District neighborhoods.This division contains <strong>the</strong> following 3 activities:■ Property Acquisition – acquires vacant, abandoned and deteriorated properties through negotiated friendlysale, eminent domain, donation, or tax sale foreclosure when owners are unwilling or unable to maintain <strong>the</strong>irproperties;■ Property Disposition – disposes <strong>of</strong> properties in <strong>the</strong> PADD inventory by selling <strong>the</strong> properties to individualsor developers to be rehabilitated into high quality affordable and market-rate single-family and/ or multi-familyfor-sale housing in District neighborhoods; and■ Property Management – provides funding for <strong>the</strong> maintenance <strong>of</strong> properties in PADD’s inventory until <strong>the</strong>ycan be disposed <strong>of</strong> to create affordable housing units.Portfolio and Asset Management Division (PAMD) - provides portfolio management and oversight to outstandingloans to DHCD and manages <strong>the</strong> allocation <strong>of</strong> Low Income Housing Tax Credits (LIHTC). Established inFY 2008, <strong>the</strong> division monitors <strong>the</strong> status <strong>of</strong> existing loans to ensure compliance with loan covenants and collections<strong>of</strong> loans that are due and conducts <strong>the</strong> reviews <strong>of</strong> <strong>the</strong> risks and relationships <strong>of</strong> potential borrowers to protect<strong>the</strong> Department’s assets.This division contains <strong>the</strong> following 2 activities:■ Portfolio and Asset Management – monitors <strong>the</strong> status and ensures <strong>the</strong> performance <strong>of</strong> all loans in <strong>the</strong> department’sportfolio; and■ Tax Credit Allocation – manages <strong>the</strong> allocation <strong>of</strong> <strong>the</strong> District’s share <strong>of</strong> Low Income Housing Tax Credits(LIHTC) issued by <strong>the</strong> U.S. Treasury Department in accordance to <strong>the</strong> Internal Revenue Code, Section 42,and <strong>the</strong> District’s Qualified Allocation Plan (QAP).Program Monitoring Division (PMD) – conducts oversight and reviews <strong>of</strong> DHCD projects and funding recipients.Its core functions include <strong>the</strong> following types <strong>of</strong> oversight: (1) contract compliance – completing various federallyrequired compliance reviews as part <strong>of</strong> <strong>the</strong> underwriting and project development process; (2) quality assurance– monitoring <strong>the</strong> compliance <strong>of</strong> DHCD funded sub-recipients with Federal HOME Investments PartnershipProgram and Community Development Block Grant Program (CDBG) funding requirements; and (3) compliancemonitoring – ensuring projects developed by DHCD through <strong>the</strong> Housing Production Trust Fund (HPTF),CDBG, HOME, and LIHTC programs remain in compliance with federal and local program requirementsthroughout <strong>the</strong> duration <strong>of</strong> <strong>the</strong> projects period <strong>of</strong> affordability.Department <strong>of</strong> Housing and Community DevelopmentB-54FY 2013 Proposed <strong>Budget</strong> and <strong>Financial</strong> Plan
This division contains <strong>the</strong> following 3 activities:■ Contract Compliance – provides oversight and monitoring services <strong>of</strong> DHCD projects to ensure <strong>the</strong> department'suse <strong>of</strong> project funds fully complies with federal Department <strong>of</strong> Housing and Urban Development andDistrict regulations;■ Quality Assurance – provides program review and performance evaluation to DHCD and contractors so that<strong>the</strong>y can operate in full compliance with regulations in <strong>the</strong> most effective and efficient manner possible; and■ Homelessness Prevention Compliance – monitors programs aimed at preventing individuals and families frombecoming homeless to ensure compliance with Federal rules and regulations.Housing Regulation Administration (HRA) – administers residential housing regulations relating to condominiumand cooperative conversions, rent adjustment procedures, licensing, and o<strong>the</strong>r related matters. It includes <strong>the</strong>Rental Accommodation Division and <strong>the</strong> Rental Conversion and Sales Division and manages <strong>the</strong> DHCD HousingResource Center.This division contains <strong>the</strong> following 3 activities:■ Rental Conversion and Sales Division (CASD) – administers <strong>the</strong> District’s tenant opportunity to purchaseprogram, regulates <strong>the</strong> conversion <strong>of</strong> property to condominiums and cooperatives, registers condominium andcooperative projects, and administers <strong>the</strong> structural defect warranty claim program;■ Rental Accommodations Division (RAD) – administers <strong>the</strong> District’s rent stabilization program, including registeringand licensing rental housing, administering rent adjustments procedures, processing landlord and tenantpetitions, providing conciliation services, and acting as a repository for notices to vacate and all rental propertyrecords; and■ Housing Resource Center (HRC) – provides rental housing services to landlords and tenants and, starting inFY 2010, provides information to <strong>the</strong> public on all <strong>of</strong> <strong>the</strong> department’s services for first-time homebuyers, developers<strong>of</strong> affordable housing projects, and low-income homeowners. The Housing Resource Center alsoincludes access to <strong>the</strong> Affordable Housing Locator and an <strong>of</strong>fice <strong>of</strong> University Legal Services for on-site housingcounseling.Rental Housing Commission (RHC) – enforces <strong>the</strong> Rental Housing Act <strong>of</strong> 1985, as amended. The commissionhas three statutory functions in order to preserve and increase <strong>the</strong> supply <strong>of</strong> quality affordable housing in <strong>the</strong>District: (1) to issue, amend and rescind regulations that are promulgated for enforcement <strong>of</strong> <strong>the</strong> Act; (2) to certifyand publish <strong>the</strong> annual adjustment <strong>of</strong> general applicability to rents and/or rent ceilings, which adjustment isbased upon annual changes (if any) in <strong>the</strong> Consumer Price Index for <strong>the</strong> applicable region in which <strong>the</strong> District <strong>of</strong>Columbia is located; and (3) to decide appeals brought to <strong>the</strong> Commission from <strong>the</strong> Rent Administrator and <strong>the</strong><strong>Office</strong> <strong>of</strong> Administrative Hearings. Although <strong>the</strong> Commission is an independent quasi-judicial body, it has directreporting responsibility to DHCD on administrative, management, and budgetary matters.<strong>Agency</strong> Management – provides for administrative support and <strong>the</strong> required tools to achieve operational and programmaticresults. This division is standard for all division-based budgeting agencies.<strong>Agency</strong> <strong>Financial</strong> Operations – provides comprehensive and efficient financial management services to, and onbehalf <strong>of</strong>, District agencies so that <strong>the</strong> financial integrity <strong>of</strong> <strong>the</strong> District <strong>of</strong> Columbia is maintained. This division isstandard for all agencies using division-based budgeting.Division Structure ChangeThe Department <strong>of</strong> Housing and Community Development has no division structure changes in <strong>the</strong> FY 2013proposed budget.FY 2013 Proposed <strong>Budget</strong> and <strong>Financial</strong> PlanDepartment <strong>of</strong> Housing and Community DevelopmentB-55
FY 2013 Proposed Operating <strong>Budget</strong> and FTEs, by Division and ActivityTable DB0-4 contains <strong>the</strong> proposed FY 2013 budget by division and activity compared to <strong>the</strong> FY 2012 approved budget.It also provides <strong>the</strong> FY 2011 actual data.Table DB0-4(dollars in thousands)Dollars in ThousandsFull-Time EquivalentsChangeChangeActual Approved Proposed from Actual Approved Proposed fromDivision/Activity FY 2011 FY 2012 FY 2013 FY 2012 FY 2011 FY 2012 FY 2013 FY 2012(1000) <strong>Agency</strong> Management Program(1010) Personnel 196 520 554 33 0.0 0.0 0.2 0.2(1015) Training and Employee Development 221 246 246 0 0.8 1.0 1.0 0.0(1020) Contracting and Procurement 0 81 0 -81 0.8 1.0 0.0 -1.0(1030) Property Management 2,451 3,529 3,586 57 4.3 4.0 2.0 -2.0(1040) Information Technology 514 755 759 4 2.4 4.0 4.0 0.0(1050) <strong>Financial</strong> Management 0 2,090 2,257 167 0.0 0.0 0.0 0.0(1055) Risk Management 1,039 654 0 -654 3.5 4.0 0.0 -4.0(1060) Legal 973 1,505 1,467 -38 0.8 1.0 1.0 0.0(1070) Fleet Management 18 20 20 0 0.0 0.0 0.0 0.0(1080) Communications 569 460 599 138 3.4 4.0 5.0 1.0(1085) Customer Service 81 159 83 -76 3.2 3.0 1.8 -1.2(1087) Language Access 4 9 9 0 0.0 0.0 0.0 0.0(1090) Performance Management 903 3,207 1,342 -1,865 6.3 9.0 11.0 2.0Subtotal (1000) <strong>Agency</strong> Management Program 6,968 13,234 10,919 -2,315 25.6 31.0 26.0 -5.0(100F) <strong>Agency</strong> <strong>Financial</strong> Operations((100F) <strong>Agency</strong> <strong>Financial</strong> Operations(110F) <strong>Budget</strong> Operations 143 284 218 -66 1.6 3.0 2.1 -0.9(120F) Accounting Operations 134 254 257 3 2.3 3.0 3.0 0.0(130F) Fiscal <strong>Office</strong>r 192 338 474 136 2.3 3.0 3.9 0.9Subtotal (100F) <strong>Agency</strong> <strong>Financial</strong> Operations 469 875 948 73 6.3 9.0 9.0 0.0(2000) Development Finance Division(2010) Affordable Housing Project Financing 51,946 81,901 77,405 -4,496 11.6 22.0 20.5 -1.5(2015) Community Facilities Project Financing 1,953 4,000 1,727 -2,273 0.0 0.0 0.0 0.0(2020) Tenant Opportunity to Purchase Assistance 74 83 86 3 0.6 1.0 1.0 0.0Subtotal (2000) Development Finance Division 53,973 85,984 79,219 -6,766 12.3 23.0 21.5 -1.5(Continued on next page)Department <strong>of</strong> Housing and Community DevelopmentB-56FY 2013 Proposed <strong>Budget</strong> and <strong>Financial</strong> Plan
Table DB0-4 (Continued)(dollars in thousands)Dollars in ThousandsFull-Time EquivalentsChangeChangeActual Approved Proposed from Actual Approved Proposed fromDivision/Activity FY 2011 FY 2012 FY 2013 FY 2012 FY 2011 FY 2012 FY 2013 FY 2012(3000) Residential and Community Service Division((3010) Neighborhood Based Activities 5,711 6,916 5,379 -1,537 5.4 9.0 8.0 -1.0(3020) Community Services - Comm Revitalization 2,081 1,671 1,795 124 0.7 1.0 0.0 -1.0(3030) Residential Services - HPAP 16,512 15,954 13,390 -2,564 3.5 6.0 6.0 0.0(3040) Residential Services - EAHP 334 793 793 0 0.0 0.0 0.0 0.0(3050) Residential Services - Lead Safe Washington 2,081 1,427 2,008 581 2.4 3.5 6.0 2.5(3060) Residential Services - Single Fam Rehab 2,688 3,104 3,084 -20 4.3 6.0 8.0 2.0Subtotal (3000) Residential and Community Service Division 29,408 29,864 26,449 -3,415 16.4 25.5 28.0 2.5(4000) Emergency Shelter Grant Managemnt Program(4010) Emergency Shelter Grant Management Program 630 0 0 0 0.0 0.0 0.0 0.0(4011) Emergency Shelter Grant Management Program Stm 892 0 0 0 0.0 0.0 0.0 0.0No Activity Assigned 1,276 0 0 0 0.0 0.0 0.0 0.0Subtotal (4000) Emergency Shelter Grant Management Program 2,798 0 0 0 0.0 0.0 0.0 0.0(4100) Property Acquisition and Disposition Division(4120) Property Acquisition 2,400 4,850 1,943 -2,907 0.8 2.0 9.0 7.0(4130) Property Disposition 120 952 750 -202 0.0 2.0 0.0 -2.0(4140) Property Management 227 250 255 5 0.0 0.0 0.0 0.0Subtotal (4100) Property Acquisition and Disposition Division 2,746 6,052 2,947 -3,104 0.8 4.0 9.0 5.0(4500) Portfolio and Asset Management Division(4510) Portfolio and Asset Management 523 753 551 -202 3.5 8.0 6.0 -2.0(4520) Tax Credit Allocation 105 0 113 113 1.7 0.0 1.0 1.0Subtotal (4500) Portfolio and Asset Management Division 627 753 664 -89 5.2 8.0 7.0 -1.0(6000) Homeownership and Home Rehab Assistance(6010) Home Purchase Assistance Program (HPAP) 207 0 0 0 0.0 0.0 0.0 0.0(6040) Single Family Residential Rehab 8 0 0 0 0.0 0.0 0.0 0.0No Activity Assigned 79 0 0 0 0.0 0.0 0.0 0.0Subtotal (6000) Homeownership and Home Rehab Assistance 295 0 0 0 0.0 0.0 0.0 0.0(7000) Program Monitoring Division(7010) Contract Compliance 784 1,117 1,320 204 9.0 12.3 14.0 1.7(7020) Quality Assurance 118 383 210 -173 2.6 3.7 2.0 -1.7(7030) Homelessness Prevention Compliance 257 3,100 81 -3,019 1.3 2.0 1.0 -1.0Subtotal (7000) Program Monitoring Division 1,158 4,600 1,612 -2,988 12.9 18.0 17.0 -1.0(Continued on next page)FY 2013 Proposed <strong>Budget</strong> and <strong>Financial</strong> PlanDepartment <strong>of</strong> Housing and Community DevelopmentB-57
Table DB0-4 (Continued)(dollars in thousands)Dollars in ThousandsFull-Time EquivalentsChangeChangeActual Approved Proposed from Actual Approved Proposed fromDivision/Activity FY 2011 FY 2012 FY 2013 FY 2012 FY 2011 FY 2012 FY 2013 FY 2012(8100) Housing Regulation Administration(8110) Rental Conversion and Sales Division 1,257 693 1,087 395 10.2 7.0 11.0 4.0(8120) Housing Resource Center 60 460 76 -383 0.8 4.0 0.0 -4.0(8140) Rental Accommodations Division 1,097 1,097 1,135 38 12.7 13.0 13.0 0.0Subtotal (8100) Housing Regulation Administration 2,414 2,249 2,299 49 23.7 24.0 24.0 0.0(9100) Rental Housing Commission(9110) Rental Housing Commission 240 707 785 78 4.5 4.0 5.0 1.0Subtotal (9100) Rental Housing Commission 240 707 785 78 4.5 4.0 5.0 1.0Total Proposed Operating <strong>Budget</strong> 101,097 144,319 125,842 -18,476 107.6 146.5 146.5 0.0(Change is calculated by whole numbers and numbers may not add up due to rounding.)Note: For more detailed information regarding <strong>the</strong> proposed funding for <strong>the</strong> activities within this agency’s divisions, please see Schedule 30-PBBProgram Summary by Activity in <strong>the</strong> FY 2013 Operating Appendices located on <strong>the</strong> <strong>Office</strong> <strong>of</strong> <strong>the</strong> <strong>Chief</strong> <strong>Financial</strong> <strong>Office</strong>r’s website.Department <strong>of</strong> Housing and Community DevelopmentB-58FY 2013 Proposed <strong>Budget</strong> and <strong>Financial</strong> Plan
FY 2013 Proposed <strong>Budget</strong> ChangesThe Department <strong>of</strong> Housing and Community Development’s (DHCD) proposed FY 2013 gross budget is$125,842,249, which represents a 12.8 percent decrease from its FY 2012 approved gross budget <strong>of</strong> $144,318,583.The budget is comprised <strong>of</strong> $12,591,210 in Local funds, $38,147,287 in Federal Grant funds, $6,500,000 inSpecial Purpose Revenue funds, and $68,603,751 in Intra-District funds.Current Services Funding LevelThe Current Services Funding Level (CSFL) is a Local funds ONLY representation <strong>of</strong> <strong>the</strong> true cost <strong>of</strong> operatingDistrict agencies, before consideration <strong>of</strong> policy decisions. The CSFL reflects changes from <strong>the</strong> FY 2012 approvedbudget across multiple programs, and it estimates how much it would cost an agency to continue its current programsand operations into <strong>the</strong> following fiscal year. The initial adjustments in <strong>the</strong> budget proposal representchanges that should be compared to <strong>the</strong> FY 2013 CSFL budget and not necessarily changes made to <strong>the</strong> FY 2012Local funds budget. The FY 2013 CSFL adjustments to <strong>the</strong> FY 2012 Local funds budget are described in table 5<strong>of</strong> this agency's budget chapter. Please see <strong>the</strong> CSFL Development section within Volume 1: Executive Summaryfor more information regarding <strong>the</strong> methodology used and components that comprise <strong>the</strong> CSFLDHCD’s FY 2013 CSFL budget is $9,000,836, which represents a $3,220,915, or 26.4 percent, decrease from<strong>the</strong> FY 2012 approved Local funds budget <strong>of</strong> $12,221,301. The primary reason for <strong>the</strong> reduction was <strong>the</strong> removal<strong>of</strong> one-time funding <strong>of</strong> $3,275,560 for <strong>the</strong> HPAP-Repay program and <strong>the</strong> DHCD United Fund.Initial Adjusted <strong>Budget</strong>Cost Increase: DHCD increased Local funds for Subsidies and Transfers by $20,817. Federal Grant fundsincreased $153,954 in total fixed costs, which includes Telecom, Energy, Security, Building Rental andMaintenance. Special Purpose Revenue (SPR) funds increased by $1,029,131 for adjustments to salaries, steps,Fringe Benefits, and 11.5 full-time equivalent (FTE) positions; $162,028 in O<strong>the</strong>r Services and Charges; $29,315in total fixed costs for Telecom, Energy, Security, Building Rental and Maintenance; $11,037 in Supplies andMaterials; and $4,296 in Equipment. Intra-District funds increased by $3,552,823 in Subsidies and Transfers;$1,275,402 for adjustments to salaries, steps, Fringe Benefits, and 13.9 FTEs; $156,606 in O<strong>the</strong>r Services andCharges; $91,177 in Contractual Services; $38,771 in total fixed costs for Telecom, Energy, Security, BuildingRental and Maintenance; $5,518 in Supplies; and $1,585 in Equipment.Cost Decrease: DHCD reduced Local funds for salaries, steps, and Fringe Benefits by $11,556; ContractualServices by $8,616; and O<strong>the</strong>r Services by $645, to <strong>of</strong>fset <strong>the</strong> increase in Subsidies and Transfers. In FY 2013, <strong>the</strong>overall Federal Grants funds budget decreased from FY 2012 because <strong>of</strong> <strong>the</strong> expiration <strong>of</strong> six grants and reducedfunding in <strong>the</strong> remaining five ongoing grants. The reductions in Federal Grant funds include $39,143,905 inSubsidies and Transfers, $2,264,466 in personal services and 25.3 FTEs, $465,052 in Contractual Services,$32,787 in O<strong>the</strong>r Services and Charges, $21,766 in Supplies and Materials, and $12,463 in Equipment. SPR wasreduced by $1,947,911 in Subsidies and Transfers and by $1,085,661 in Contractual Services to align <strong>the</strong> budgetwith projected resources.FY 2013 Proposed <strong>Budget</strong> and <strong>Financial</strong> PlanDepartment <strong>of</strong> Housing and Community DevelopmentB-59
Additionally Adjusted <strong>Budget</strong>Technical Adjustments: Adjustment <strong>of</strong> Fringe Benefits to restore <strong>the</strong> District Government contribution foremployee health insurance from 72 percent, implemented in <strong>the</strong> FY 2011 budget, to 75 percent in FY 2013, resultingin an increase <strong>of</strong> $7,862 in Local funds, $8,256 in Federal Grant funds, $7,339 in Special Purpose Revenuefunds, and $7,159 in Intra-District funds.Additional Adjustments: Federal Grant funds were reduced by $8,256, and Special Purpose Revenue funds werereduced by $7,339 to <strong>of</strong>fset <strong>the</strong> cost <strong>of</strong> <strong>the</strong> health insurance contribution.Policy InitiativesCost Increase: Local funds were increased in Subsidies and Transfers by $2,512,000 <strong>of</strong> one-time funds for <strong>the</strong>Home Purchase Assistance Program (HPAP), $650,000 for <strong>the</strong> Local funds match portion <strong>of</strong> <strong>the</strong> Lead Safe FederalGrant, and $410,512 for <strong>the</strong> Small Business Technical Assistance Program. Also, a $10,000 Local fund adjustmentwas made to salary and Fringe Benefits in <strong>the</strong> Housing Regulation Administration division. An increase <strong>of</strong>$500,000 was made in Special Purpose Revenue to Subsidies and Transfers to <strong>the</strong> Low/Moderate Income HomeLoan program. In addition, Intra-District revenue increased by $19,108,963 in Subsidies and Transfers for HousingProduction Trust Fund (HPTF) related project delivery through <strong>the</strong> Development Finance Division.Department <strong>of</strong> Housing and Community DevelopmentB-60FY 2013 Proposed <strong>Budget</strong> and <strong>Financial</strong> Plan
FY 2012 Approved <strong>Budget</strong> to FY 2013 Proposed <strong>Budget</strong>, by Revenue TypeTable DB0-5 itemizes <strong>the</strong> changes by revenue type between <strong>the</strong> FY 2012 approved budget and <strong>the</strong> FY 2013 proposedbudget.Table DB0-5(dollars in thousands)PROGRAM BUDGET FTELOCAL FUNDS: FY 2012 Approved <strong>Budget</strong> and FTE 12,221 30.8Removal <strong>of</strong> One-Time Funding Development Finance -3,276 0.0Community Service DivisionFringe Benefit Rate Adjustment Multiple Programs 23 0.0Consumer Price Index Multiple Programs 20 0.0Personal Services Growth Factor Multiple Programs 12 0.0FY 2013 Current Services Funding Level <strong>Budget</strong> (CSFL) 9,001 30.8Cost Increase: Adjustments to Subsidies and Transfers Multiple Programs 21 0.0Cost Decrease: Adjustments to salary, steps, and Fringe Benefits Multiple Programs -12 -0.1Cost Decrease: Adjustments to Contractual Services Multiple Programs -9 0.0Cost Decrease: Adjustments to O<strong>the</strong>r Services Multiple Programs -1 0.0FY 2013 Initial Adjusted <strong>Budget</strong> 9,001 30.7Technical Adjustment: Health insurance contribution Multiple Programs 8 0.0FY 2013 Additionally Adjusted <strong>Budget</strong> 9,009 30.7FY 2013 Policy InitiativesCost Increase: Adjustment in Subsidies and Transfers to <strong>the</strong> Home Residential and Community Service Division 2,512 0.0Purchase Assistance Program (HPAP) (One-Time)Cost Increase: Local fund match for <strong>the</strong> Lead Safe Federal Grant Residential and Community Service Division 650 0.0Cost Increase: Adjustment in Subsidies and Transfers to <strong>the</strong> Residential and Community Service Division 411 0.0Small Business Business Technical Assistance programCost Increase: Adjustment to salary and Fringe Benefits Housing Regulation Administration 10 0.0LOCAL FUNDS: FY 2013 Proposed <strong>Budget</strong> and FTE 12,591 30.7FEDERAL GRANT FUNDS: FY 2012 Approved <strong>Budget</strong> and FTE 79,934 60.9Cost Increase: Adjustments to fixed costs <strong>Agency</strong> Management Program 154 0.0Cost Decrease: Adjustments to Subsidies and Transfers Multiple Programs -39,144 0.0Cost Decrease: Adjustments to salary, steps, and Fringe Benefits Multiple Programs -2,264 -25.3Cost Decrease: Adjustments to Contractual Services Multiple Programs -465 0.0Cost Decrease: Adjustments to O<strong>the</strong>r Services and Charges <strong>Agency</strong> Management Program -33 0.0Cost Decrease: Adjustments to Supplies and Materials <strong>Agency</strong> Management -22 0.0Cost Decrease: Adjustments to Equipment <strong>Agency</strong> Management Program -12 0.0FY 2013 Initial Adjusted <strong>Budget</strong> 38,147 35.6Technical Adjustment: Health insurance contribution Multiple Programs 8 0.0Additional Adjustments: Adjustment to <strong>of</strong>fset <strong>the</strong> Multiple Programs -8 0.0health insurance contributionFY 2013 Additionally Adjusted <strong>Budget</strong> 38,147 35.6FEDERAL GRANT FUNDS: FY 2013 Proposed <strong>Budget</strong> and FTE 38,147 35.6(Continued on next page)FY 2013 Proposed <strong>Budget</strong> and <strong>Financial</strong> PlanDepartment <strong>of</strong> Housing and Community DevelopmentB-61
Table DB0-5 (continued)(dollars in thousands)PROGRAM BUDGET FTESPECIAL PURPOSE REVENUE FUNDS: FY 2012 Approved <strong>Budget</strong> and FTE 7,798 22.2Cost Increase: Adjustments to salary, steps, and Fringe Benefits Multiple Programs 1,029 11.5Cost Increase: Adjustments to O<strong>the</strong>r Services and Charges <strong>Agency</strong> Management Program 162 0.0Cost Increase: Adjustments to fixed costs <strong>Agency</strong> Management Program 29 0.0Cost Increase: Adjustments to Supplies and Materials <strong>Agency</strong> Management Program 11 0.0Cost Increase: Adjustments to Equipment <strong>Agency</strong> Management Program 4 0.0Cost Decrease: Adjustment in Subsidies and Transfers Multiple Programs -1,948 0.0to align with projected resourcesCost Increase: Adjustments to Contractual Services Multiple Programs -1,086 0.0to align with projected resourcesFY 2013 Initial Adjusted <strong>Budget</strong> 6,000 33.6Additional Adjustments: Adjustment to Subsidies and Multiple Programs -7 0.0Transfers to <strong>of</strong>fset <strong>the</strong> health insurance contributionTechnical Adjustment: Health insurance contribution Multiple Programs 7 0.0FY 2013 Additionally Adjusted <strong>Budget</strong> 6,000 33.6FY 2013 Policy InitiativesCost Increase: Adjustment to low income home loan program Residential and Community Service Division 500 0.0SPECIAL PURPOSE REVENUE FUNDS: FY 2013 Proposed <strong>Budget</strong> and FTE 6,500 33.6INTRA-DISTRICT FUNDS: FY 2012 Approved <strong>Budget</strong> and FTE 44,366 32.7Cost Increase: Adjustments to Subsidies and Transfers Multiple Programs 3,553 0.0Cost Increase: Adjustments to salary, steps, and Fringe Benefits Multiple Programs 1,275 13.9Cost Increase: Adjustments to O<strong>the</strong>r Services and Charges <strong>Agency</strong> Management Program 157 0.0Cost Increase: Adjustments to Contractual Services <strong>Agency</strong> Management Program 91 0.0Cost Increase: Adjustments to fixed costs <strong>Agency</strong> Management Program 39 0.0Cost Increase: Adjustments to Supplies and Materials <strong>Agency</strong> Management Program 6 0.0Cost Increase: Adjustments to Equipment <strong>Agency</strong> Management Program 2 0.0FY 2013 Initial Adjusted <strong>Budget</strong> 49,488 46.6Technical Adjustment: Health insurance contribution Multiple Programs 7 0.0FY 2013 Additionally Adjusted <strong>Budget</strong> 49,495 46.6FY 2013 Policy InitiativesCost Increase: Adjustments to Subsidies and Transfers related to HPTF Development Finance Division 19,109 0.0project deliveryINTRA-DISTRICT FUNDS: FY 2013 Proposed <strong>Budget</strong> and FTE 68,604 46.6Gross for DB0 - Department <strong>of</strong> Housing and Community Development 125,842 146.5(Change is calculated by whole numbers and numbers may not add up due to rounding)Department <strong>of</strong> Housing and Community DevelopmentB-62FY 2013 Proposed <strong>Budget</strong> and <strong>Financial</strong> Plan
<strong>Agency</strong> Performance PlanThe agency’s performance plan has <strong>the</strong> following objectives for FY 2013:1. Housing Regulation AdministrationObjective 1: Preserve and increase <strong>the</strong> supply <strong>of</strong> quality affordable housing.Objective 2: Revitalize neighborhoods, promote community development, and provide economic opportunities.Housing Regulation AdministrationFY 2010 FY 2011 FY 2011 FY 2012 FY 2013 FY 2014Measure Actual Target Actual Projection Projection ProjectionPercentage <strong>of</strong> orders issued on voluntary agreementpetitions within 45 calendar days 91.67% 90% 100% 90% 95%NotAvailablePercentage <strong>of</strong> orders issued on hardship petitionswithin 90 calendar days <strong>of</strong> receipt 2.50% 90% 75% 90% 95%NotAvailablePercentage <strong>of</strong> condo registration applicationsprocessed within 60 calendar days 95.45% 98% 91.96% 98% 98%NotAvailablePercentage <strong>of</strong> structural defect warranty claim noticesprocessed within 60 calendar days 48.48% 95% 35.42% 95% 95%NotAvailablePercentage <strong>of</strong> complete housing assistance paymentrequests processed within 30 calendar days 33.33% 95% 0.00% 95% 95%NotAvailableNumber <strong>of</strong> inclusionary zoning units builtNot0 TBD 0 TBD TBD AvailablePercentage <strong>of</strong> lotteries conducted for inclusionaryunits within 17 calendar days <strong>of</strong> receivingnotice <strong>of</strong> availability 0 95% 100% 95% 95%NotAvailable2. Rental Housing CommissionObjective 1: Preserve and increase <strong>the</strong> supply <strong>of</strong> quality affordable housing.Rental Housing CommissionFY 2010 FY 2011 FY 2011 FY 2012 FY 2013 FY 2014Measure Actual Target Actual Projection Projection ProjectionNumber <strong>of</strong> appeals disposedNot1 31 19 32 33 AvailableNumber <strong>of</strong> appeals cases > 3 years oldNot36 18 71 12 10 AvailablePercentage <strong>of</strong> cases processed under 6 weeksNot(from date <strong>of</strong> commencement) 25% 55% 52% 55% 60% AvailableAverage amount <strong>of</strong> time from Not Notreceipt <strong>of</strong> case to assignment 3mo 15mo 5mo 4mo Available AvailablePercentage <strong>of</strong> hearings scheduled within 30 day Not Notrequirement 50% 100% 100% 100% Available AvailableAverage number <strong>of</strong> calendar days between Not Notreceipt <strong>of</strong> case and final decision Available 91 376 91 91 AvailableFY 2013 Proposed <strong>Budget</strong> and <strong>Financial</strong> PlanDepartment <strong>of</strong> Housing and Community DevelopmentB-63
3. Development Finance DivisionObjective 1: Preserve and increase <strong>the</strong> supply <strong>of</strong> quality affordable housing.Objective 2: Increase homeownership opportunities.Objective 3: Revitalize neighborhoods, promote community development, and provide economic opportunities.Development FinanceFY 2010 FY 2011 FY 2011 FY 2012 FY 2013 FY 2014Measure Actual Target Actual Projection Projection ProjectionPercentage <strong>of</strong> District owners spending >30 percent <strong>of</strong>income on monthly housing costs 6 39.20% 35%AnnualMeasurement 35% 35%NotAvailablePercentage <strong>of</strong> District renters spending >30 percent <strong>of</strong>income on housing costs 6 49.20% 45%AnnualMeasurement 45% 45%NotAvailableTotal affordable housing units funded (new and rehab) 7Not1,312 900 846 900 900 AvailableTotal special needs housing units funded (elderly,Notdisabled, and homeless units) 441 150 251 150 150 AvailableTotal new homeownership units fundedNot360 80 223 80 80 AvailableTotal First Right Purchase Assistance Program(tenant purchase) units fundedNot– FRP New and Rehab Units 340 100 241 100 100 AvailableTotal affordable housing units rehabilitatedNot936 200 300 200 200 AvailableTotal affordable housing units preservedNot(via loan structuring, technical aid, etc.) 503 200 122 200 200 AvailablePercentage <strong>of</strong> affordable housing units competitively 86% 100% Annual 100% 100% Notevaluated and advancing to underwriting in <strong>the</strong> Measurement Availablerespective FY, that are highly sustainable and meet<strong>the</strong> Green Communities criteriaNote: AMI – Area Medium IncomeDepartment <strong>of</strong> Housing and Community DevelopmentB-64FY 2013 Proposed <strong>Budget</strong> and <strong>Financial</strong> Plan
4. Residential and Community Services DivisionObjective 1: Preserve and increase <strong>the</strong> supply <strong>of</strong> quality affordable housing.Objective 2: Increase homeownership opportunities.Objective 3: Revitalize neighborhoods, promote community development and provide economic opportunities.Residential and Community Services DivisionFY 2010 FY 2011 FY 2011 FY 2012 FY 2013 FY 2014Measure Actual Target Actual Projection Projection ProjectionTotal affordable housing units funded 442 425 506 550 700 NotAvailableTotal Single Family Rehab units funded 61 75 124 80 80 NotAvailableTotal Lead Multifamily units funded 35 65 137 70 70 NotAvailableTotal Residential Rehab Elderly, Disabled, andNotHomeless units (special needs) funded 34 15 73 20 20 AvailableTotal Home Purchase Assistance Program (HPAP)NotElderly, Disabled, and Homeless units (special needs) funded 11 10 7 10 10 AvailableNotNumber <strong>of</strong> first-time homebuyers funded by HPAP 362 400 223 500 500 AvailableNotNumber <strong>of</strong> District employee homebuyers funded by EHAP 110 80 75 90 100 AvailableNotNumber <strong>of</strong> District employee homebuyers funded by NEAHP 8 25 20 50 75 AvailableNotNumber <strong>of</strong> Elevated Blood Level cases in <strong>the</strong> District 8 64 40 43 35 30 AvailableNotNumber <strong>of</strong> storefront façades improved 73 40 46 90 50 AvailableNotAverage cost per façade unit funded $29,333 $25,000 $25,000 $25,000 $25,000 AvailableHPAP: Home Purchase Assistance Program5. Property Acquisition and Disposition DivisionObjective 1: Preserve and increase <strong>the</strong> supply <strong>of</strong> quality affordable housing.Objective 2: Revitalize neighborhoods, promote community development, and provide economic opportunities.FY 2013 Proposed <strong>Budget</strong> and <strong>Financial</strong> PlanDepartment <strong>of</strong> Housing and Community DevelopmentB-65
Property Acquisition and Disposition DivisionFY 2010 FY 2011 FY 2011 FY 2012 FY 2013 FY 2014Measure Actual Target Actual Projection Projection ProjectionNotNumber <strong>of</strong> properties acquired 37 25 11 25 25 AvailableNumber <strong>of</strong> total properties acquired in targetedneighborhoods (Ivy City/Trinidad, HistoricAnacostia, and Washington Highlands) 12 0 3 12 15NotAvailableNumber <strong>of</strong> properties recaptured from developersor transferees 17 10 0 0 0NotAvailableNumber <strong>of</strong> properties for which dispositionagreements were executed 37 30 28 35 35NotAvailableNumber <strong>of</strong> housing units rehabilitated throughacquisition <strong>of</strong> abandoned properties 45 45 53 45 45NotAvailableNumber <strong>of</strong> affordable housing units created orrehabilitated through acquisition <strong>of</strong> abandoned properties 35 45 31 45 45NotAvailableAverage number <strong>of</strong> years <strong>of</strong> affordability for unitscreated or rehabilitated through acquisition <strong>of</strong> abandonedproperties 9 15 12 15 15NotAvailableNumber <strong>of</strong> properties investigated that result inrehabilitation by <strong>the</strong> owner 4 5 0 5 5NotAvailableTargeted Average cost per property <strong>of</strong> acquisitions 9Not$57,771 $190,000 $38,095 $100,000 $100,000 Available6. Program Monitoring DivisionObjective 1: Preserve and increase <strong>the</strong> supply <strong>of</strong> quality affordable housing.Objective 2: Increase home ownership opportunities.Objective 3: Revitalize neighborhoods, promote community development and provide economic opportunities.Program Monitoring DivisionFY 2010 FY 2011 FY 2011 FY 2012 FY 2013 FY 2014Measure Actual Target Actual Projection Projection ProjectionTotal number <strong>of</strong> grant projects reviewedNot192 95 201 105 115 AvailablePercentage <strong>of</strong> DHCD environmental reviews 10conducted within 45 calendar days 72.80% 80% 87.10% 90% 95%NotAvailablePercentage <strong>of</strong> Fair Housing Reviews completed withinstated Division timelines 100% 98% 100% 98% 98%NotAvailablePercentage <strong>of</strong> Section 3 Business Concerns Certified Not NotAvailable 10 14 12 15 AvailableNumber <strong>of</strong> Section 3 Jobs Created Not NotAvailable 15 38 20 25 AvailablePercentage <strong>of</strong> eligible Community Housing DevelopmentOrganizations certified/recertified by fiscal year-end 8 8 5 12 12NotAvailablePercentage <strong>of</strong> required physical inspections and filereviews <strong>of</strong> units conducted annually for HOMENotand LIHTC properties 1,200 1,000 1,032 1,000 1,000 AvailableHOME: An investment partnership program with <strong>the</strong> U.S. Department <strong>of</strong> Housing and Urban Development designed to create affordable housing for low-income households.LIHTC: Low Income Housing tax Credit.Department <strong>of</strong> Housing and Community DevelopmentB-66FY 2013 Proposed <strong>Budget</strong> and <strong>Financial</strong> Plan
7. Portfolio and Asset Management DivisionObjective 1: Preserve and increase <strong>the</strong> supply <strong>of</strong> quality affordable housing.Portfolio and Asset Management DivsionFY 2010 FY 2011 FY 2011 FY 2012 FY 2013 FY 2014Measure Actual Target Actual Projection Projection ProjectionPercentage <strong>of</strong> all required financial reviews completedNot39.63% 50% 12.36% 75% 85% AvailablePercentage <strong>of</strong> loans in good standing from previous quarterNot89.22% 92% 94.45% 97% 98% AvailablePercentage increase in number <strong>of</strong> loans in good standingNotfrom previous quarter 3.80% 4.59% 94.28% 4.59% 4.83% AvailablePercentage <strong>of</strong> loans more than 30 calendar days delinquentNot2.91% 1.91% 2.76% 1.81% 1.72% AvailablePercentage <strong>of</strong> loans in defaultNot5.59% 12% 4.24% 8% 3% AvailableNumber <strong>of</strong> loans moved from delinquent to correctNotstatus 52 60 62 70 80 AvailablePercentage <strong>of</strong> multi-family loans risk ratedNot61.25% 50% 32.14% 60% 70% AvailablePercentage <strong>of</strong> financial reports collected fromNotexisting borrowers 11 1.30% 2% 7.79% 3% 4% Available8. <strong>Office</strong> <strong>of</strong> <strong>the</strong> DirectorObjective 1: Preserve and increase <strong>the</strong> supply <strong>of</strong> quality affordable housing.Objective 2: Increase homeownership opportunities.Objective 3: Revitalize neighborhoods, promote community development, and provide economic opportunities.<strong>Office</strong> <strong>of</strong> <strong>the</strong> DirectorFY 2010 FY 2011 FY 2012 FY 2013 FY 2014Measure Actual Actual Projection Projection ProjectionPercentage <strong>of</strong> sub-grantee budget spent on programmaticcosts 12 88% AnnualMeasure-65% 65% NotAvailablementPercentage <strong>of</strong> scheduled monitoring reports as definedin agency monitoring plan completed forNoteach grant award 100% 100% 100% 100% AvailableFY 2013 Proposed <strong>Budget</strong> and <strong>Financial</strong> PlanDepartment <strong>of</strong> Housing and Community DevelopmentB-67
Performance Plan Endnotes:1. The position <strong>of</strong> Rent Administrator, which had been vacant since 2010, was filled in Q4 <strong>of</strong> FY 2011. DHCD anticipates that thisaction will result in <strong>the</strong> increased ability to meet <strong>the</strong> FY 2012 projection.2. New measure for FY 2012, Annual measurement.3. American Community Survey, annual measurement, 1-year lag time (2010 release date is (9/28/10).4. DHCD funds a unit <strong>of</strong> affordable housing when a project has completed all application and underwriting processes and itsfunding has been obligated in SOAR (System <strong>of</strong> Accounting and Reporting).5. Annual Industry Standard Measure for Jurisdictions with over 100,000 residents collected by <strong>the</strong> International City/CountyManagement Association (ICMA). For FY 2010, <strong>the</strong> mean is 7.5 and <strong>the</strong> median is 2.0.6. Industry Standard – collected by <strong>the</strong> U.S. Centers for Disease Control and Prevention in conjunction with DDOE. The currentnational average is approximately 1 percent.7. FY 2011 actual costs are lower than projected due to recapture methods available for FY 2011 actual properties recaptured.Costs are expected to increase in alignment with projections due to costs associated with more complex recaptures.8. OPM staff complete a HUD-approved checklist after it independently reviews all <strong>of</strong> <strong>the</strong> environmental information collected foreach site. Additionally, in accordance with <strong>the</strong> National Environmental Protection Act (NEPA), OPM has provided public noticeand reviewed <strong>the</strong> environmental effects <strong>of</strong> proposed housing related activities throughout <strong>the</strong> District and concluded that abroad range <strong>of</strong> activities will not have an adverse impact on <strong>the</strong> environment.9. PAMD collects this data in order to monitor <strong>the</strong> status <strong>of</strong> existing loans and to ensure compliance with loan covenants.10. The Wise Giving Alliance <strong>of</strong> <strong>the</strong> Better Business Bureau identifies 65 percent to be an industry standard for this measurehttp://www.bbb.org/us/Charity-Standards/. This metric measures all subgrantees’ programmatic costs as a percentage <strong>of</strong> <strong>the</strong>iroverall costs.11. This monitoring function was transferred to PMD in FY 2010. Pursuant to Section 11.4 <strong>of</strong> <strong>the</strong> Grants Manual and SourceBook, all District agencies must complete monitoring reports. All District agencies should be in compliance with this standard.The standard is 100 percent.Department <strong>of</strong> Housing and Community DevelopmentB-68FY 2013 Proposed <strong>Budget</strong> and <strong>Financial</strong> Plan
Department <strong>of</strong> Employment Services(CF0)www.does.dc.govTelephone: 202-724-7000% ChangeFY 2011 FY 2012 FY 2013 fromDescription Actual Approved Proposed FY 2012Operating <strong>Budget</strong> $94,464,942 $126,071,129 $122,178,700 -3.1FTEs 475.7 617.8 545.9 -11.7The Department <strong>of</strong> Employment Services (DOES) fosters and promotes<strong>the</strong> welfare <strong>of</strong> job seekers and wage earners by advancing opportunitiesfor employment, helping employers find workers, trackingchanges in employment and o<strong>the</strong>r national economic measurementsimpacting <strong>the</strong> District <strong>of</strong> Columbia, and improving employee workingconditions.Summary <strong>of</strong> ServicesDOES, <strong>the</strong> District <strong>of</strong> Columbia’s lead labor and workforce development agency, provides customers with a comprehensivemenu <strong>of</strong> workforce development services funded through a combination <strong>of</strong> federal grants and localappropriations. DOES’ workforce bureau provides job seekers with workforce development and training programsthat create pathways to job readiness, to new jobs, or to new educational opportunities. The workforce bureau also<strong>of</strong>fers services to ensure employers have access to qualified job candidates as well as general employment servicessupport. Finally, DOES provides District youth with job training, academic enrichment, leadership, and employmentopportunities through its year-round, summer youth, and Mayor’s Youth Leadership Institute programs.DOES also delivers basic income support services to unemployed or underemployed persons who lost <strong>the</strong>ir jobsthrough no fault <strong>of</strong> <strong>the</strong>ir own. The Labor Standards Program ensures a safe and healthy work environment forworkers in <strong>the</strong> District; administers a program to provide benefits to qualified individuals with employment-relatedinjuries or illnesses; administers <strong>the</strong> District’s wage-and-hour laws; and provides hearing and adjudication servicesto settle workers’ compensation disputes.The agency’s FY 2013 proposed budget is presented in <strong>the</strong> following tables:FY 2013 Proposed <strong>Budget</strong> and <strong>Financial</strong> PlanDepartment <strong>of</strong> Employment ServicesB-69
FY 2013 Proposed Gross Funds Operating <strong>Budget</strong>, by Revenue TypeTable CF0-1 contains <strong>the</strong> proposed FY 2013 agency budget compared to <strong>the</strong> FY 2012 approved budget. It alsoprovides FY 2010 and FY 2011 actual expenditures.Table CF0-1(dollars in thousands)ChangeActual Actual Approved Proposed from PercentAppropriated Fund FY 2010 FY 2011 FY 2012 FY 2013 FY 2012 Change*General FundLocal Funds 50,980 38,148 40,654 47,457 6,803 16.7Special Purpose Revenue Funds 27,903 21,763 29,981 30,876 895 3.0Total for General Fund 78,883 59,911 70,635 78,332 7,698 10.9Federal ResourcesFederal Payments 0 0 0 2,000 2,000 N/AFederal Grant Funds 37,845 34,114 54,052 40,588 -13,464 -24.9Total for Federal Resources 37,845 34,114 54,052 42,588 -11,464 -21.2Private FundsPrivate Donations 0 0 80 80 0 0.0Total for Private Funds 0 0 80 80 0 0.0Intra-District FundsIntra-District Funds 4,421 440 1,305 1,179 -126 -9.7Total for Intra-District Funds 4,421 440 1,305 1,179 -126 -9.7Gross Funds 121,149 94,465 126,071 122,179 -3,892 -3.1*Percent change is based on whole dollars.Note: If applicable, for a breakdown <strong>of</strong> each Grant (Federal and Private), Special Purpose Revenue type and Intra-District agreement,please refer to Schedule 80 <strong>Agency</strong> Summary by Revenue Source in <strong>the</strong> FY 2013 Operating Appendices located on <strong>the</strong> <strong>Office</strong> <strong>of</strong> <strong>the</strong><strong>Chief</strong> <strong>Financial</strong> <strong>Office</strong>r’s website.Department <strong>of</strong> Employment ServicesB-70FY 2013 Proposed <strong>Budget</strong> and <strong>Financial</strong> Plan
FY 2013 Proposed Full-Time Equivalents, by Revenue TypeTable CF0-2 contains <strong>the</strong> proposed FY 2013 FTE level compared to <strong>the</strong> FY 2012 approved FTE level by revenuetype. It also provides FY 2010 and FY 2011 actual data.Table CF0-2ChangeActual Actual Approved Proposed from PercentAppropriated Fund FY 2010 FY 2011 FY 2012 FY 2013 FY 2012 ChangeGeneral FundLocal Funds 79.3 66.2 80.8 180.4 99.6 123.4Special Purpose Revenue Funds 167.8 125.8 157.5 152.4 -5.1 -3.3Total for General Fund 247.1 192.0 238.3 332.8 94.5 39.7Federal ResourcesFederal Grant Funds 218.4 283.2 378.3 212.2 -166.1 -43.9Total for Federal Resources 218.4 283.2 378.3 212.2 -166.1 -43.9Intra-District FundsIntra-District Funds 0.0 0.4 1.3 0.9 -0.4 -28.9Total for Intra-District Funds 0.0 0.4 1.3 0.9 -0.4 -28.9Total Proposed FTEs 465.5 475.7 617.8 545.9 -72.0 -11.7FY 2013 Proposed <strong>Budget</strong> and <strong>Financial</strong> PlanDepartment <strong>of</strong> Employment ServicesB-71
FY 2013 Proposed Operating <strong>Budget</strong>, by Comptroller Source GroupTable CF0-3 contains <strong>the</strong> proposed FY 2013 budget at <strong>the</strong> Comptroller Source Group (object class) level comparedto <strong>the</strong> FY 2012 approved budget. It also provides FY 2010 and FY 2011 actual expenditures.Table CF0-3(dollars in thousands)ChangeActual Actual Approved Proposed from PercentComptroller Source Group FY 2010 FY 2011 FY 2012 FY 2013 FY 2012 Change*11 - Regular Pay - Continuing Full Time 22,484 21,688 29,072 27,171 -1,901 -6.512 - Regular Pay - O<strong>the</strong>r 10,481 10,231 11,736 8,766 -2,970 -25.313 - Additional Gross Pay 826 684 0 0 0 N/A14 - Fringe Benefits - Current Personnel 6,546 6,710 8,145 7,752 -393 -4.815 - Overtime Pay 126 192 0 0 0 N/A99 - Unknown Payroll Postings 0 -1 0 0 0 N/ASubtotal Personal Services (PS) 40,463 39,504 48,953 43,690 -5,263 -10.820 - Supplies and Materials 212 214 657 650 -7 -1.130 - Energy, Comm. and Building Rentals 163 236 278 248 -30 -10.831 - Telephone, Telegraph, Telegram, Etc. 1,111 790 1,200 1,021 -179 -14.932 - Rentals - Land and Structures 9,429 5,007 2,031 867 -1,165 -57.334 - Security Services 594 398 398 931 533 133.935 - Occupancy Fixed Costs 89 151 1,258 792 -466 -37.040 - O<strong>the</strong>r Services and Charges 6,510 9,477 26,556 30,559 4,003 15.141 - Contractual Services - O<strong>the</strong>r 6,706 2,474 1,015 2,106 1,091 107.550 - Subsidies and Transfers 55,144 35,453 41,208 40,024 -1,185 -2.970 - Equipment and Equipment Rental 730 760 2,515 1,291 -1,225 -48.7Subtotal Nonpersonal Services (NPS) 80,686 54,961 77,118 78,489 1,371 1.8Gross Funds 121,149 94,465 126,071 122,179 -3,892 -3.1*Percent change is based on whole dollars.Division DescriptionThe Department <strong>of</strong> Employment Services operates through <strong>the</strong> following 5 divisions:Unemployment Insurance – provides income replacement services for workers unemployed through no fault <strong>of</strong><strong>the</strong>ir own so that <strong>the</strong>y can maintain <strong>the</strong>ir purchasing power and <strong>the</strong>reby contribute to <strong>the</strong> economic stability <strong>of</strong> <strong>the</strong>Washington, D.C. metropolitan area.This division contains <strong>the</strong> following 3 activities:■ Tax Collections – collects quarterly taxes from for-pr<strong>of</strong>it local employers and reimbursement payments fromlocal non-pr<strong>of</strong>it employers, which finance <strong>the</strong> payment <strong>of</strong> weekly benefits to workers unemployed withoutfault;■ Benefits – provides cash payments to customers who are unemployed through no fault <strong>of</strong> <strong>the</strong>ir own and areable and available for work; and■ Appeals – pursuant to <strong>the</strong> <strong>Office</strong> <strong>of</strong> Administrative Hearings Establishment Act <strong>of</strong> 2001 (D.C. Law 14-76),this activity will now be conducted by <strong>the</strong> <strong>Office</strong> <strong>of</strong> Administrative Hearings (OAH).Department <strong>of</strong> Employment ServicesB-72FY 2013 Proposed <strong>Budget</strong> and <strong>Financial</strong> Plan
Labor Standards – provides worker protection and dispute resolution services for <strong>the</strong> workers and employers <strong>of</strong> <strong>the</strong>District so that disputes are resolved fairly and <strong>the</strong> safety <strong>of</strong> <strong>the</strong> workplace is ensured.This division contains <strong>the</strong> following 5 activities:■ <strong>Office</strong> <strong>of</strong> Wage Hour – enforces <strong>the</strong> District’s wage-hour laws through compliance audits for <strong>the</strong> benefit <strong>of</strong> private-sectoremployees so that <strong>the</strong>y can be paid at least <strong>the</strong> minimum wage, required overtime, all earned andpromised wages, living wage, and required sick leave;■ <strong>Office</strong> <strong>of</strong> Occupational Safety and Health – provides on-site consultation services, investigations, training, andprogram assistance to private-sector employers so that <strong>the</strong>y can identify and correct workplace hazards;■ <strong>Office</strong> <strong>of</strong> Workers’ Compensation – processes claims and provides informal dispute resolution, insurance-coveragecompliance monitoring, and related services to private-sector injured workers, employers, insurance carriers,and o<strong>the</strong>r stakeholders;■ Administrative Hearings Division – provides formal administrative hearings to employees, employers, and <strong>the</strong>District government so that rights and responsibilities are determined fairly, promptly, and in accordance with<strong>the</strong> workers’ compensation acts; and■ Compensation Review Board – provides administrative review <strong>of</strong> case decisions (compensation orders) issuedby <strong>the</strong> Administrative Hearings Division and/or <strong>the</strong> <strong>Office</strong> <strong>of</strong> Workers’ Compensation.Workforce Development – provides employment-related services for unemployed or underemployed persons sothat <strong>the</strong>y can achieve economic security.This division contains <strong>the</strong> following 12 activities:■ Senior Services – provides subsidized employment placements to District residents who are both 55 years oldor older and economically underprivileged so that <strong>the</strong>y can develop or enhance <strong>the</strong>ir job skills and be placed inunsubsidized employment;■ Program Performance Monitoring – provides compliance, oversight, and technical assistance to training vendors,procurement staff, and departmental administrators;■ Local Adult Training – provides training programs that teach job skills that will facilitate in <strong>the</strong> expansion <strong>of</strong>employment opportunities for District adult residents;■ <strong>Office</strong> <strong>of</strong> Apprenticeship Information and Training – provides apprenticeship promotional services andassistance to District residents and apprenticeship sponsors, and administers <strong>the</strong> pre-apprenticeship program;■ Transitional Employment – provides employment-related services that will assist hard-to-employ District residentsto become self-sufficient through <strong>the</strong> provision <strong>of</strong> an array <strong>of</strong> services;■ Employer Services – provides technical assistance, recruitment, referral, placement, planning, and oversight servicesto area employers/businesses so that <strong>the</strong>y can hire qualified individuals;■ One-Stop Operations – provides comprehensive employment support, unemployment compensation, trainingservices, and supportive services through a network <strong>of</strong> easily accessible locations;■ Labor Market Information – administers five Bureau <strong>of</strong> Labor Statistics programs and an Employment andTraining Administration program under a Federal/State cooperative agreement;■ Year-Round Youth Program – provides year-round services to eligible youth to include subsidized employment,academic enrichment activities, and vocational training to prepare participants for <strong>the</strong> world <strong>of</strong> work;■ Summer Youth Employment Program – provides temporary, subsidized summer employment and academicenrichment activities and unsubsidized employment opportunities in <strong>the</strong> private sector to eligible Districtyouth;■ Mayor’s Youth Leadership Program – administers a four-level youth leadership training and development programemphasizing citizenship and leadership skills; and■ Statewide Activities – includes 15 percent reserved for statewide activities including incentive grants, technicalassistance, management information systems, evaluation, and "One-Stop" system building. In addition, permissiblestatewide activities include incumbent worker projects, authorized youth and adult activities, and additionalsystem building. For additional information, please refer to <strong>the</strong> Workforce Investment Act, Public Law105-220, which was signed into law August 7, 1998.FY 2013 Proposed <strong>Budget</strong> and <strong>Financial</strong> PlanDepartment <strong>of</strong> Employment ServicesB-73
<strong>Agency</strong> Management – provides for administrative support and <strong>the</strong> required tools to achieve operational and programmaticresults. This division is standard for all agencies using performance-based budgeting.<strong>Agency</strong> <strong>Financial</strong> Operations – provides comprehensive and efficient financial management services to, and onbehalf <strong>of</strong>, District agencies so that <strong>the</strong> financial integrity <strong>of</strong> <strong>the</strong> District <strong>of</strong> Columbia is maintained. This divisionis standard for agencies using performance-based budgeting.Division Structure ChangeThe Department <strong>of</strong> Employment Services has no division structure changes in <strong>the</strong> FY 2013 proposed budget.FY 2013 Proposed Operating <strong>Budget</strong> and FTEs, by Division and ActivityTable CF0-4 contains <strong>the</strong> proposed FY 2013 budget by division and activity compared to <strong>the</strong> FY 2012 approved budget.It also provides <strong>the</strong> FY 2011 actual data.Table CF0-4(dollars in thousands)Dollars in ThousandsFull-Time EquivalentsChangeChangeActual Approved Proposed from Actual Approved Proposed fromDivision/Activity FY 2011 FY 2012 FY 2013 FY 2012 FY 2011 FY 2012 FY 2013 FY 2012(1000) <strong>Agency</strong> Management(1010) Personnel -80 523 285 -238 2.3 4.0 4.0 0.0(1015) Training and Employee Development 0 1,924 2,398 473 0.0 19.0 26.0 7.0(1017) Labor Management Partnerships 41 67 55 -11 0.8 1.0 1.0 0.0(1020) Contracting and Procurement 0 1,022 676 -347 0.0 6.0 6.4 0.4(1030) Property Management 7,254 7,652 6,319 -1,333 3.9 5.0 5.0 0.0(1040) Information Technology 4,321 5,387 5,037 -350 25.8 33.0 30.0 -3.0(1050) <strong>Financial</strong> Management 0 97 0 -97 0.0 1.0 0.0 -1.0(1060) Legal 333 0 0 0 0.0 0.0 0.0 0.0(1070) Fleet Management 435 515 608 94 4.6 5.0 7.0 2.0(1080) Communications 214 529 439 -90 4.6 6.0 5.0 -1.0(1085) Customer Service 358 272 212 -60 6.2 6.0 5.0 -1.0(1090) Performance Management 2,760 1,753 1,939 186 25.3 14.0 19.0 5.0Subtotal (1000) <strong>Agency</strong> Management 15,638 19,741 17,968 -1,773 73.5 99.9 108.2 8.4(100F) <strong>Agency</strong> <strong>Financial</strong> Operations(110F) <strong>Budget</strong> Operations 1,005 1,176 973 -203 7.0 11.0 9.0 -2.0(120F) Accounting Operations 723 1,022 983 -39 7.2 9.9 10.0 0.0Subtotal (100F) <strong>Agency</strong> <strong>Financial</strong> Operations 1,728 2,197 1,955 -242 14.2 21.0 18.9 -2.0(2000) Unemployment Insurance(2100) Tax Collections 3,585 6,439 7,204 765 38.3 49.0 42.0 -7.0(2200) Benefits 12,367 22,198 20,884 -1,314 61.8 95.0 76.0 -19.0(2300) Appeals 1,000 500 0 -500 0.0 0.0 0.0 0.0Subtotal (2000) Unemployment Insurance 16,952 29,137 28,088 -1,049 100.2 144.0 118.0 -26.0(3000) Labor Standards(3200) <strong>Office</strong> <strong>of</strong> Wage Hour 332 585 529 -56 5.1 5.0 4.0 -1.0(3300) <strong>Office</strong> <strong>of</strong> Occupational Safety and Health 355 495 565 70 4.8 5.0 6.0 1.0(3400) <strong>Office</strong> <strong>of</strong> Workers' Compensation 8,073 14,034 11,302 -2,732 58.0 83.0 70.0 -13.0(3500) OAH: Administrative Hearings Division 2,205 3,347 2,781 -566 22.0 31.0 22.0 -9.0(3600) OAH: Compensation Review Board 907 1,433 1,491 58 11.5 16.0 14.0 -2.0Subtotal (3000) Labor Standards 11,872 19,894 16,667 -3,227 101.4 140.0 116.0 -24.0(Continued on next page)Department <strong>of</strong> Employment ServicesB-74FY 2013 Proposed <strong>Budget</strong> and <strong>Financial</strong> Plan
Table CF0-4 (Continued)(dollars in thousands)Dollars in ThousandsFull-Time EquivalentsChangeChangeActual Approved Proposed from Actual Approved Proposed fromDivision/Activity FY 2011 FY 2012 FY 2013 FY 2012 FY 2011 FY 2012 FY 2013 FY 2012(4000) Workforce Development(4100) Senior Services 755 648 0 -648 0.8 2.0 0.0 -2.0(4200) Program Performance Monitoring 7,607 12,063 6,189 -5,874 20.7 20.0 7.4 -12.6(4250) Local Adult Training 0 0 8,299 8,299 0.0 0.0 11.6 11.6(4300) <strong>Office</strong> <strong>of</strong> Apprenticeship Info and Training 771 693 688 -5 7.2 6.0 5.0 -1.0(4400) Transitional Employment 8,351 11,301 9,377 -1,924 22.3 26.0 27.0 1.0(4500) Employer Services 4,236 2,865 4,775 1,910 23.9 28.0 23.0 -5.0(4600) One-Stop Operations 5,146 6,371 5,716 -656 66.5 85.0 65.7 -19.3(4700) Labor Market Information 848 1,150 1,349 199 7.0 11.0 10.0 -1.0(4810) Year Round Youth Program 5,170 7,401 8,741 1,340 17.6 19.0 19.0 0.0(4820) Summer Youth Employment Program 12,726 11,564 11,371 -193 13.8 9.0 10.0 1.0(4830) Mayors Youth Leadership Program 646 751 762 11 4.1 4.0 4.0 0.0(4900) State-Wide Activities 2,019 293 232 -62 2.3 3.0 2.0 -1.0Subtotal (4000) Workforce Development 48,276 55,102 57,500 2,398 186.4 213.0 184.7 -28.3Total Proposed Operating <strong>Budget</strong> 94,465 126,071 122,179 -3,892 475.7 617.8 545.9 -72.0(Change is calculated by whole numbers and numbers may not add up due to rounding)Note: For more detailed information regarding <strong>the</strong> proposed funding for <strong>the</strong> activities within this agency’s divisions, please see Schedule 30-PBBProgram Summary by Activity in <strong>the</strong> FY 2013 Operating Appendices located on <strong>the</strong> <strong>Office</strong> <strong>of</strong> <strong>the</strong> <strong>Chief</strong> <strong>Financial</strong> <strong>Office</strong>r’s website.FY 2013 Proposed <strong>Budget</strong> and <strong>Financial</strong> PlanDepartment <strong>of</strong> Employment ServicesB-75
FY 2013 Proposed <strong>Budget</strong> ChangesThe Department <strong>of</strong> Employment Service’s (DOES) proposed FY 2013 gross budget is $122,178,700, which representsa 3.1 percent decrease from its FY 2012 approved gross budget <strong>of</strong> $126,071,129. The budget is comprised<strong>of</strong> $47,456,750 in Local funds, $2,000,000 in Federal Payments, $40,587,769 in Federal Grant funds, $80,000in Private Donation funds, $30,875,503 in Special Purpose Revenue funds, and $1,178,678 in Intra-Districtfunds.Current Services Funding LevelThe Current Services Funding Level (CSFL) is a Local funds ONLY representation <strong>of</strong> <strong>the</strong> true cost <strong>of</strong> operatingDistrict agencies, before consideration <strong>of</strong> policy decisions. The CSFL reflects changes from <strong>the</strong> FY 2012 approvedbudget across multiple programs, and it estimates how much it would cost an agency to continue its current programsand operations into <strong>the</strong> following fiscal year. The initial adjustments in <strong>the</strong> budget proposal representchanges that should be compared to <strong>the</strong> FY 2013 CSFL budget and not necessarily changes made to <strong>the</strong> FY 2012Local funds budget. The FY 2013 CSFL adjustments to <strong>the</strong> FY 2012 Local funds budget are described in table 5<strong>of</strong> this agency's budget chapter. Please see <strong>the</strong> CSFL Development section within Volume 1: Executive Summaryfor more information regarding <strong>the</strong> methodology used and components that comprise <strong>the</strong> CSFL.DOES’s FY 2013 CSFL budget is $40,828,055, which represents a $174,301, or 0.4 percent, increase over <strong>the</strong>FY 2012 approved Local funds budget <strong>of</strong> $40,653,754.Initial Adjusted <strong>Budget</strong>Reduce: The Local reduction <strong>of</strong> $2,358,865 in Subsidies and Transfers ($1,855,000 from <strong>the</strong> Year Round YouthProgram) will be used to partially <strong>of</strong>fset proposed increases. A reduction in Federal Grant funds will necessitate areduction-in-force saving <strong>of</strong> $12,299,448 in personal services costs. Of <strong>the</strong> 166.1 FTEs to be eliminated, 85 arepositions that are currently filled. The fixed cost assessments for Energy, Rent, Security, and Occupancy will realizea net reduction <strong>of</strong> $970,226 from <strong>the</strong> Department <strong>of</strong> General Services (DGS), and <strong>the</strong> Telecom assessment from<strong>the</strong> <strong>Office</strong> <strong>of</strong> Finance and Resource Management (OFRM) will be reduced by $814,169. These reductions arepart <strong>of</strong> <strong>the</strong> outcomes realized from <strong>the</strong> plans to close three One-Stop Shop operations.The greatest impact to service from <strong>the</strong>se measures will be in Workforce Development programs, as fewer Districtresidents will be served.Cost Increase: The agency will add $1,416,757 to Local funds in personal services for planned step increases, FringeBenefits costs, and to increase FTEs by 14.6. This will partially <strong>of</strong>fset <strong>the</strong> loss <strong>of</strong> Federal Grant funded FTEs. O<strong>the</strong>rServices and Charges will increase by $859,624 across multiple programs. In addition, Equipment and Suppliesand Contractual Services will increase by $55,685 and $26,799 respectively. Federal Grant funds will realize anincrease <strong>of</strong> $276,571 in Subsidies and Transfers. Additional increases <strong>of</strong> $190,893 in Equipment and $173,013 inO<strong>the</strong>r Services and Charges will be used across multiple programs. Special Purpose Revenue fund increases will be$2,505,783 in O<strong>the</strong>r Services and Charges and $1,064,500 in Contracts. Fixed costs increases <strong>of</strong> $634,778 forTelecom from OFRM and $291,151 for Energy and Rent from DGS are projected.Cost Decrease: DOES will decrease Federal Grant fund spending by $20,603 in Supplies and Materials. SpecialPurpose Revenue decreases <strong>of</strong> $1,463,539 in Equipment and $1,202,245 in Subsidies and Transfers will partially<strong>of</strong>fset increases without impacting <strong>the</strong> level <strong>of</strong> service. The agency will save $519,298 in personal services by reducingFTEs by 5.1, and <strong>the</strong> fixed costs estimates from DGS for Security and Occupancy will decrease by $448,682.Intra-District funds will decrease by $126,161 and 0.4 FTE in personal services based on historical spending.Department <strong>of</strong> Employment ServicesB-76FY 2013 Proposed <strong>Budget</strong> and <strong>Financial</strong> Plan
Additionally Adjusted <strong>Budget</strong>Technical Adjustment: Adjustment <strong>of</strong> Fringe Benefits to restore <strong>the</strong> District Government contribution for employeehealth insurance from 72 percent, implemented in <strong>the</strong> FY 2011 budget, to 75 percent in FY 2013, resulting inan increase <strong>of</strong> $28,857 in Local funds, $59,831 in Federal Grant funds, $32,087 in Special Purpose Revenue funds,and $170 in Intra-District funds.Additional AdjustmentsCost Increase: Federal Grant fund spending will decrease $59,831 in Subsidies and Transfers to <strong>of</strong>fset <strong>the</strong> increasein health insurance contribution.Policy InitiativesCreate: The agency will establish a new activity entitled Local Adult Training. This activity will be funded entirelyby Local funds. Funding supporting this activity will comprise <strong>of</strong> $7,553,710 in Subsidies and Transfers and$745,042 in salaries and fringe benefits for 11.6 FTEs.Reduce: DOES will reduce Local funds by $7,553,710 in Subsidies and Transfers and 11.6 FTEs and $745,042in personal services in <strong>the</strong> Program Performance Monitoring program to support <strong>the</strong> newly created Local AdultTraining activity. An additional reduction <strong>of</strong> $2,000,000 will be made in <strong>the</strong> Transitional Employment program.The sum <strong>of</strong> all reductions will be allocated to o<strong>the</strong>r programs within <strong>the</strong> Workforce Development division.Cost Increase: The agency will use Local funds to <strong>of</strong>fset a portion <strong>of</strong> <strong>the</strong> reductions in Federal Grant funds. Thepersonal services increase <strong>of</strong> $6,100,000 for 85.0 FTEs will mainly be used for Career Centers to remain at <strong>the</strong> currentservice level, and $400,000 will be used in O<strong>the</strong>r Services and Charges for <strong>the</strong> Workforce Investment Council.$2,000,000 in Local funds will be used to draw down federal reimbursements by providing eligible services to residentsfor <strong>the</strong> Supplemental Nutrition Assistance Program Employment and Training. $100,000 in Local fundswill be added for technical assistance and capacity building activities for contracted Year Round Youth Employmentprogram vendors. In addition, a Federal Payment in <strong>the</strong> amount <strong>of</strong> $2,000,000 will be used in <strong>the</strong> WorkforceDevelopment program for job training activities.FY 2013 Proposed <strong>Budget</strong> and <strong>Financial</strong> PlanDepartment <strong>of</strong> Employment ServicesB-77
FY 2012 Approved <strong>Budget</strong> to FY 2013 Proposed <strong>Budget</strong>, by Revenue TypeTable CF0-5 itemizes <strong>the</strong> changes by revenue type between <strong>the</strong> FY 2012 approved budget and <strong>the</strong> FY 2013 proposedbudget.Table CFO-5(dollars in thousands)DIVISION BUDGET FTELOCAL FUNDS: FY 2012 Approved <strong>Budget</strong> and FTE 40,654 80.8Fringe Benefit Rate Adjustment Multiple Programs 76 0.0Consumer Price Index Multiple Programs 71 0.0Personal Services Growth Factor Multiple Programs 27 0.0FY 2013 Current Services Funding Level <strong>Budget</strong> (CSFL) 40,828 80.8Reduce: Subsidies and Transfers Multiple Programs -2,359 0.0Cost Increase: Additional FTEs, step increases and Multiple Programs 1,417 14.6Fringe Benefit ratesCost Increase: O<strong>the</strong>r Services and Charges Multiple Programs 860 0.0Cost Increase: Equipment and Supplies Multiple Programs 56 0.0Cost Increase: Contractual Services Workforce Development 27 0.0FY 2013 Initial Adjusted <strong>Budget</strong> 40,828 95.4Technical Adjustment: Health insurance contribution Multiple Programs 29 0.0FY 2013 Additionally Adjusted <strong>Budget</strong> 40,857 95.4FY 2013 Policy InitiativesCreate: Subsidies and Transfers for new Local Adult Training activity Workforce Development 7,554 0.0Create: Salary and Fringe Benefits for new Local Adult Training activity Workforce Development 745 11.6Reduce: Reduce Program Performance Monitoring (PPM) Workforce Development -7,554 0.0to support new Local Adult Training activityReduce: Subsidies and Transfers Workforce Development -2,000 0.0Reduce: FTEs from PPM to new Local Adult Training activity Workforce Development -745 -11.6Cost Increase: Personal services to partially <strong>of</strong>fset Federal Grant reduction Multiple Programs 6,100 85.0Cost Increase: Eligible services to residents for <strong>the</strong> Workforce Development 2,000 0.0Supplemental Nutrition Assistance Program Employment and TrainingCost Increase: O<strong>the</strong>r Services and Charges Workforce Development 400 0.0Cost Increase: Year Round Youth Employment program vendors Workforce Development 100 0.0LOCAL FUNDS: FY 2013 Proposed <strong>Budget</strong> and FTE 47,457 180.4FEDERAL PAYMENTS: FY 2012 Approved <strong>Budget</strong> and FTE 0 0.0FY 2013 Policy InitiativesCost Increase: Job training activities Workforce Development 2,000 0.0FEDERAL PAYMENTS: FY 2013 Proposed <strong>Budget</strong> and FTE 2,000 0.0FEDERAL GRANT FUNDS: FY 2012 Approved <strong>Budget</strong> and FTE 54,052 378.3Reduce: Reduction in Force Multiple Programs -12,299 -166.1Reduce: Net effect on fixed costs assessments for <strong>Agency</strong> Management -970 0.0Energy, Rent, Security, and Occupancy from DGSReduce: Fixed cost estimate for Telecom from OFRM <strong>Agency</strong> Management -814 0.0Cost Increase: Subsidies and Transfers Multiple Programs 277 0.0Cost Increase: Equipment Multiple Programs 191 0.0Cost Increase: O<strong>the</strong>r Services and Charges <strong>Agency</strong> Management 173 0.0Cost Decrease: Supplies and Materials Multiple Programs -21 0.0FY 2013 Initial Adjusted <strong>Budget</strong> 40,588 212.2Additional Adjustments: Reduce Subsidies and Transfers to Workforce Development -60 0.0<strong>of</strong>fset health insurance contributionTechnical Adjustment: Health insurance contribution Multiple Programs 60 0.0FY 2013 Additionally Adjusted <strong>Budget</strong> 40,588 212.2FEDERAL GRANT FUNDS: FY 2013 Proposed <strong>Budget</strong> and FTE 40,588 212.2(Continued on next page)Department <strong>of</strong> Employment ServicesB-78FY 2013 Proposed <strong>Budget</strong> and <strong>Financial</strong> Plan
Table CFO-5 (Continued)(dollars in thousands)DIVISION BUDGET FTEPRIVATE DONATIONS: FY 2012 Approved <strong>Budget</strong> and FTE 80 0.0No Changes 0 0.0FY 2013 Initial Adjusted <strong>Budget</strong> 80 0.0PRIVATE DONATIONS: FY 2013 Proposed <strong>Budget</strong> and FTE 80 0.0SPECIAL PURPOSE REVENUE FUNDS: FY 2012 Approved <strong>Budget</strong> and FTE 29,981 157.5Cost Increase: O<strong>the</strong>r Services and Charges Multiple Programs 2,506 0.0Cost Increase: Contractual Services <strong>Agency</strong> Management 1,064 0.0Cost Increase: Telecom assessment from OFRM <strong>Agency</strong> Management 635 0.0Cost Increase: Fixed cost estimates for Energy and <strong>Agency</strong> Management 291 0.0Rent from DGSCost Decrease: Equipment Multiple Programs -1,464 0.0Cost Decrease: Subsidies and Transfers Multiple Programs -1,202 0.0Cost Decrease: Align personal services with cost Multiple Programs -519 -5.1projectionsCost Decrease: Fixed cost estimate for Security and <strong>Agency</strong> Management -449 0.0Occupancy from DGSFY 2013 Initial Adjusted <strong>Budget</strong> 30,843 152.4Technical Adjustment: Health insurance contribution Multiple Programs 32 0.0FY 2013 Additionally Adjusted <strong>Budget</strong> 30,876 152.4SPECIAL PURPOSE REVENUE FUNDS: FY 2013 Proposed <strong>Budget</strong> and FTE 30,876 152.4INTRA-DISTRICT FUNDS: FY 2012 Approved <strong>Budget</strong> and FTE 1,305 1.3Cost Decrease: Align personal services with cost <strong>Agency</strong> Management -126 -0.4projectionsFY 2013 Initial Adjusted <strong>Budget</strong> 1,179 0.9Technical Adjustment: Health insurance contribution (less than $500) Multiple Programs 0 0.0FY 2013 Additionally Adjusted <strong>Budget</strong> 1,179 0.9INTRA-DISTRICT FUNDS: FY 2013 Proposed <strong>Budget</strong> and FTE 1,179 0.9Gross for CF0 - Department <strong>of</strong> Employment Services 122,179 545.9(Change is calculated by whole numbers and numbers may not add up due to rounding)FY 2013 Proposed <strong>Budget</strong> and <strong>Financial</strong> PlanDepartment <strong>of</strong> Employment ServicesB-79
<strong>Agency</strong> Performance PlanThe agency’s performance plan has <strong>the</strong> following objectives for FY 2013:1. Workforce Development Program (WDP)Objective 1: Implement an Integrated Workforce System that will improve customer service for employers andjob seekers.Workforce Development ProgramFY 2010 FY 2011 FY 2011 FY 2012 FY 2013 FY 2014Measure Actual Target Actual Target Target TargetKPI 1.1: Number <strong>of</strong> adult participants completingworkforce development training program[New for FY 2011] 1,126* 1,290 1,597* TBD TBD TBDKPI 1.2: Number <strong>of</strong> SYEP youth participants referredto summer jobs 21,243 12,000 14,062 14,000 14,000 TBDKPI 1.3: Percentage <strong>of</strong> unemployed adult customers Currently Currentlyplaced in full-time unsubsidized employment 60.90% unavailable unavailable TBD TBD TBD*KPI 1.1 data represents <strong>the</strong> following: numbers based on <strong>the</strong> date range listed below, <strong>of</strong> all adult and/or dislocated workers successfully completing training (300 series with a successfulCompletion Indicator).Data Ranges: FY 2011 represents October 1, 2010 to September 30, 2011; FY 2010 represents October 1, 2009 to September 30, 2010.KPI 1.2: The FY 2011 Actual and FY 2012 and FY 2013 Projected Targets have been impacted by legislative, administration, and budget changes that limit <strong>the</strong> number <strong>of</strong> SYEP participants.2. Unemployment Insurance (UI) ProgramObjective 1: Increase <strong>the</strong> efficiency and integrity <strong>of</strong> unemployment compensation benefits and unemploymenttax services provided to unemployment insurance claimants and District employers through <strong>the</strong> creation andleveraging <strong>of</strong> technological solutions.Unemployment InsuranceFY 2010 FY 2011 FY 2011 FY 2012 FY 2013 FY 2014Measure Actual Target Actual Target Target TargetKPI 1.1: Percentage <strong>of</strong> all first unemploymentinsurance payments made to eligible claimants within14 days <strong>of</strong> <strong>the</strong> first compensable week-ending date[87 percent is <strong>the</strong> Federal Standard] 67.40% 87% 69.36% 87% 87% TBDKPI 1.2: District <strong>of</strong> Columbia re-employment rate asreported by USDOL 46.5% 56% 44.71% 60% TBD TBDKPI 1.2 explanation: The <strong>Agency</strong> previously reported KPI 1.2 FY 2010 Actual as 43.70 percentage. USDOL now reports this result as 46.5 percentage. Please note that <strong>the</strong> performance datacharts generated by USDOL regarding <strong>the</strong> re-employment query is based on data extracted from <strong>the</strong> UI database on <strong>the</strong> date and time this query is executed. Because <strong>the</strong> UI database isdynamic, charts based on data extracted at o<strong>the</strong>r times may differ since states occasionally submit amended reports. USDOL also attempts to verify outliers and correct obviously erroneousdata from time to time. The run date for <strong>the</strong> FY 2010 re-employment percentage was Saturday, September 10, 2011.Department <strong>of</strong> Employment ServicesB-80FY 2013 Proposed <strong>Budget</strong> and <strong>Financial</strong> Plan
3. <strong>Office</strong> <strong>of</strong> Policy, Performance and Economics (OPPE)Objective 1: Increase <strong>the</strong> identification and implementation <strong>of</strong> best practice policies and continuous improvement,standard operating procedures, and utilization <strong>of</strong> tools with which to assess <strong>the</strong> future and economic state<strong>of</strong> jobs and job statutes; assess <strong>the</strong> viability <strong>of</strong> available jobs, unemployment, and wages to ensure <strong>the</strong> accuracyand efficiency <strong>of</strong> data collected across departments, <strong>of</strong>fices, and programs.<strong>Office</strong> <strong>of</strong> Policy, Performance and EconomicsFY 2010 FY 2011 FY 2012 FY 2013 FY 2014Measure Actual Actual Target Target TargetPercentage <strong>of</strong> performance data validation Not Notaccuracy [New for FY 2012] Available Available TBD TBD TBD*Note: This measure will include a combination <strong>of</strong> <strong>the</strong> Program Year (July 1 to June 30) and Fiscal Year (Oct 1 to Sept 30) periods.4. Labor Standards Program (LSP)Objective 1: Provide a more efficient and effective system to prevent workers from exposure to unsafe workingenvironments (Occupational Safety and Health Program) and from falling beneath an unacceptable income levelat times <strong>of</strong> unemployment due to injury/illness (Workers’ Compensation Program).Labor Standards ProgramFY 2010 FY 2011 FY 2011 FY 2012 FY 2013 FY 2014Measure Actual Target Actual Target Target TargetPercentage <strong>of</strong> back wages collected from employerson valid complaints 99.86% 97% 97% 97% 97% TBDPercentage <strong>of</strong> workers compensation formal hearingsresolved within 120 working days 84.03% 80% 80.09% 80% 80% TBDNote: FY 2011 YTD is through August 31, 2011.5. Operations and <strong>Agency</strong> Management (<strong>Office</strong> <strong>of</strong> <strong>the</strong> Director)Objective 1: Improve <strong>Office</strong> <strong>of</strong> <strong>the</strong> Director Management and Administration.Operations and <strong>Agency</strong> ManagementFY 2010 FY 2011 FY 2011 FY 2012 FY 2013 FY 2014Measure Actual Target Actual Target Target TargetPercentage <strong>of</strong> agency-wide cost savings Not Not NotAvailable Available Available 5% 10% TBDUSDOL description: Facilitation <strong>of</strong> Re-employment; fur<strong>the</strong>r, USDOL identifies re-employment as a core measure linked with <strong>the</strong> following: Percent <strong>of</strong> UI claimants who become re-employedwithin <strong>the</strong> quarter following <strong>the</strong>ir first UI payment.FY 2013 Proposed <strong>Budget</strong> and <strong>Financial</strong> PlanDepartment <strong>of</strong> Employment ServicesB-81
(DA0)Board <strong>of</strong> Real Property Assessments andAppealshttp://brpaa.dc.govTelephone: 202-727-6860% ChangeFY 2011 FY 2012 FY 2013 fromDescription Actual Approved Proposed FY 2012Operating <strong>Budget</strong> $1,062,693 $1,631,000 $1,663,264 2.0FTEs 2.8 11.0 11.0 0.0The mission <strong>of</strong> <strong>the</strong> Board <strong>of</strong> Real Property Assessments and Appeals(BRPAA) is to conduct fair and impartial real property assessmentappeal hearings and to ensure that appellants’ real properties areassessed at 100 percent <strong>of</strong> market value.Summary <strong>of</strong> ServicesThe real property assessment appeals process provides a second-level administrative remedy for property owners toadjudicate property assessments prior to potential formal litigation in D.C. Superior Court.The agency’s FY 2013 proposed budget is presented in <strong>the</strong> following tables:FY 2013 Proposed <strong>Budget</strong> and <strong>Financial</strong> PlanBoard <strong>of</strong> Real Property Assessments and AppealsB-83
FY 2013 Proposed Gross Funds Operating <strong>Budget</strong>, by Revenue TypeTable DA0-1 contains <strong>the</strong> proposed FY 2013 agency budget compared to <strong>the</strong> FY 2012 approved budget. It alsoprovides FY 2010 and FY 2011 actual expenditures.Table DA0-1(dollars in thousands)ChangeActual Actual Approved Proposed from PercentAppropriated Fund FY 2010 FY 2011 FY 2012 FY 2013 FY 2012 Change*General FundLocal Funds 645 1,063 1,631 1,663 32 2.0Total for General Fund 645 1,063 1,631 1,663 32 2.0Gross Funds 645 1,063 1,631 1,663 32 2.0*Percent change is based on whole dollars.Note: If applicable, for a breakdown <strong>of</strong> each Grant (Federal and Private), Special Purpose Revenue type and Intra-District agreement, pleaserefer to Schedule 80 <strong>Agency</strong> Summary by Revenue Source in <strong>the</strong> FY 2013 Operating Appendices located on <strong>the</strong> <strong>Office</strong> <strong>of</strong> <strong>the</strong> <strong>Chief</strong><strong>Financial</strong> <strong>Office</strong>r’s website.FY 2013 Proposed Full-Time Equivalents, by Revenue TypeTable DA0-2 contains <strong>the</strong> proposed FY 2013 FTE level compared to <strong>the</strong> FY 2012 approved FTE level by revenuetype. It also provides FY 2010 and FY 2011 actual data.Table DA0-2ChangeActual Actual Approved Proposed from PercentAppropriated Fund FY 2010 FY 2011 FY 2012 FY 2013 FY 2012 ChangeGeneral FundLocal Funds 4.0 2.8 11.0 11.0 0.0 0.0Total for General Fund 4.0 2.8 11.0 11.0 0.0 0.0Total Proposed FTEs 4.0 2.8 11.0 11.0 0.0 0.0Board <strong>of</strong> Real Property Assessments and AppealsB-84FY 2013 Proposed <strong>Budget</strong> and <strong>Financial</strong> Plan
FY 2013 Proposed Operating <strong>Budget</strong>, by Comptroller Source GroupTable DA0-3 contains <strong>the</strong> proposed FY 2013 budget at <strong>the</strong> Comptroller Source Group (object class) level comparedto <strong>the</strong> FY 2012 approved budget. It also provides FY 2010 and FY 2011 actual expenditures.Table DA0-3(dollars in thousands)ChangeActual Actual Approved Proposed from PercentComptroller Source Group FY 2010 FY 2011 FY 2012 FY 2013 FY 2012 Change*11 - Regular Pay - Continuing Full Time 229 157 936 849 -87 -9.212 - Regular Pay - O<strong>the</strong>r 0 0 0 100 100 N/A13 - Additional Gross Pay 0 15 0 0 0 N/A14 - Fringe Benefits - Current Personnel 52 33 188 207 20 10.415 - Overtime Pay 0 0 0 0 0 N/ASubtotal Personal Services (PS) 281 205 1,123 1,156 33 2.920 - Supplies and Materials 6 10 20 12 -8 -37.530 - Energy, Comm. and Building Rentals 16 0 0 0 0 N/A31 - Telephone, Telegraph, Telegram, Etc. 4 0 0 1 1 N/A33 - Janitorial Services 9 0 0 0 0 N/A34 - Security Services 4 0 0 0 0 N/A35 - Occupancy Fixed Costs 11 0 0 0 0 N/A40 - O<strong>the</strong>r Services and Charges 314 842 478 366 -112 -23.541 - Contractual Services - O<strong>the</strong>r 0 0 0 110 110 N/A70 - Equipment and Equipment Rental 0 6 9 18 8 87.5Subtotal Nonpersonal Services (NPS) 365 858 508 507 -1 -0.1Gross Funds 645 1,063 1,631 1,663 32 2.0*Percent change is based on whole dollars.Program DescriptionThe Real Property Tax Appeals Commission operates through <strong>the</strong> following 3 programs:Real Property Appeals Process – provides a second-level administrative remedy for property owners to adjudicateproperty assessments prior to formal litigation in <strong>the</strong> D.C. Superior Court.This program contains <strong>the</strong> 2 following activities:■ Appeals Process – provides a second-level administrative remedy for property owners to adjudicateproperty assessments prior to formal litigation in <strong>the</strong> D.C. Superior Court. Under <strong>the</strong> Real PropertyAssessments Process program, <strong>the</strong> agency schedules all real property assessment appeals and coordinates<strong>the</strong> hearings process with board members to ensure that property assessments reflect 100 percent <strong>of</strong> fairmarket value; mails all decisions; performs inspections, as required, and renders solid decisions basedon <strong>the</strong> actual condition <strong>of</strong> properties; and updates rules and regulations to include legislative revisions;andFY 2013 Proposed <strong>Budget</strong> and <strong>Financial</strong> PlanBoard <strong>of</strong> Real Property Assessments and AppealsB-85
■Commission Operations – a new activity to support direct Commission operations. This includes <strong>the</strong>development <strong>of</strong> Commission policies and procedures, direct <strong>of</strong>fice support, and Commission trainingand development.Real Property Outreach Education – provides assessment appeal services and education to residents, communities,and businesses in <strong>the</strong> District <strong>of</strong> Columbia.This program contains <strong>the</strong> following 2 activities:■ Outreach Education – provides assessment appeal services and education to residents, communities, and businessesin <strong>the</strong> District <strong>of</strong> Columbia; and■ Commission Outreach – A new activity established to support outreach operations to residents, communitiesand businesses in <strong>the</strong> District <strong>of</strong> Columbia provided directly by <strong>the</strong> Commission.<strong>Agency</strong> Management – provides for administrative support and <strong>the</strong> required tools to achieve operational and programmaticresults. This program is standard for all agencies using performance-based budgeting.Program Structure ChangeThe Board <strong>of</strong> Real Property Assessments and Appeals has added two activities to its operation in an effort to segregatedirect Commission Operations from overall agency operations.Board <strong>of</strong> Real Property Assessments and AppealsB-86FY 2013 Proposed <strong>Budget</strong> and <strong>Financial</strong> Plan
FY 2013 Proposed Operating <strong>Budget</strong> and FTEs, by Program and ActivityTable DA0-4 contains <strong>the</strong> proposed FY 2013 budget by program and activity compared to <strong>the</strong> FY 2012 approved budget.It also provides <strong>the</strong> FY 2011 actual data.Table DA0-4(dollars in thousands)Dollars in ThousandsFull-Time EquivalentsChangeChangeActual Approved Proposed from Actual Approved Proposed fromProgram/Activity FY 2011 FY 2012 FY 2013 FY 2012 FY 2011 FY 2012 FY 2013 FY 2012(1000) <strong>Agency</strong> Management Program(1010) Personnel 3 6 6 0 0.0 0.0 0.0 0.0(1015) Training and Employee Development 8 11 12 1 0.1 0.2 0.2 0.0(1020) Contracting and Procurement 20 26 23 -3 0.2 0.4 0.4 0.0(1030) Property Management 6 11 11 0 0.1 0.1 0.1 0.0(1040) Information Technology 12 20 20 0 0.1 0.1 0.1 0.0(1050) Communications 5 8 8 0 0.0 0.1 0.1 0.0(1080) Communications 47 51 59 8 0.5 1.0 1.0 0.0(1085) Customer Service 1 2 2 0 0.0 0.0 0.0 0.0Subtotal (1000) <strong>Agency</strong> Management Program 103 135 141 6 1.0 1.9 1.8 0.0(2000) Real Property Appeals Process(2010) Appeals Process 948 633 362 -270 1.6 2.9 2.6 -0.4(2020) Commission Operations 0 0 971 971 0.0 0.0 5.2 5.2Subtotal (2000) Real Property Appeals Process 948 633 1,333 700 1.6 2.9 7.8 4.8(3000) Real Property Outreach Education(3010) Outreach Education 11 863 71 -793 0.1 6.2 0.6 -5.6(3020) Commission Outreach 0 0 119 119 0.0 0.0 0.8 0.8Subtotal (3000) Real Property Outreach Education 11 863 189 -674 0.1 6.2 1.4 -4.8Total Proposed Operating <strong>Budget</strong> 1,063 1,631 1,663 32 2.8 11.0 11.0 0.0(Change is calculated by whole numbers and numbers may not add up due to rounding)Note: For more detailed information regarding <strong>the</strong> proposed funding for <strong>the</strong> activities within this agency’s programs, please see Schedule 30-PBBProgram Summary by Activity in <strong>the</strong> FY 2013 Operating Appendices located on <strong>the</strong> <strong>Office</strong> <strong>of</strong> <strong>the</strong> <strong>Chief</strong> <strong>Financial</strong> <strong>Office</strong>r’s website.FY 2013 Proposed <strong>Budget</strong> and <strong>Financial</strong> PlanBoard <strong>of</strong> Real Property Assessments and AppealsB-87
FY 2013 Proposed <strong>Budget</strong> ChangesThe Board <strong>of</strong> Real Property Assessments and Appeals’ (BRPAA) proposed FY 2013 gross budget is $1,663,264,which represents a 2.0 percent increase over its FY 2012 approved gross budget <strong>of</strong> $1,631,000. The budget is comprisedentirely <strong>of</strong> Local funds.BRPAA changed its program structure in FY 2012 from a Board structure, in which experts are paid stipendsfor <strong>the</strong>ir service, to a District-employee based structure.Current Services Funding LevelThe Current Services Funding Level (CSFL) is a Local funds ONLY representation <strong>of</strong> <strong>the</strong> true cost <strong>of</strong> operatingDistrict agencies, before consideration <strong>of</strong> policy decisions. The CSFL reflects changes from <strong>the</strong> FY 2012 approvedbudget across multiple programs, and it estimates how much it would cost an agency to continue its current programsand operations into <strong>the</strong> following fiscal year. The initial adjustments in <strong>the</strong> budget proposal representchanges that should be compared to <strong>the</strong> FY 2013 CSFL budget and not necessarily changes made to <strong>the</strong> FY 2012Local funds budget. The FY 2013 CSFL adjustments to <strong>the</strong> FY 2012 Local funds budget are described in table 5<strong>of</strong> this agency's budget chapter. Please see <strong>the</strong> CSFL Development section within Volume 1: Executive Summaryfor more information regarding <strong>the</strong> methodology used and components that comprise <strong>the</strong> CSFL.BRPAA’s FY 2013 CSFL budget is $1,658,801, which represents a $27,801, or 1.7 percent, increase over <strong>the</strong>FY 2012 approved Local funds budget <strong>of</strong> $1,631,000.Initial Adjusted <strong>Budget</strong>Create: The proposed budget in Local funds includes $685,160 to support <strong>the</strong> creation <strong>of</strong> two new activities,Commission Operations and Commission Outreach.Cost Increase: The proposed budget in Local funds includes an increase in personal services <strong>of</strong> $3,656.Cost Decrease: The agency reduced $688,817 from <strong>the</strong> Appeals Process and Outreach Education activities to <strong>of</strong>fset<strong>the</strong> cost <strong>of</strong> two new activities. The funds transferred were from Regular Pay - Continuing Full Time, O<strong>the</strong>rServices and Charges, Fringe Benefits - Current Personnel, and Supplies and Materials to create <strong>the</strong> CommissionOutreach and Commission Operations activities.Additionally Adjusted <strong>Budget</strong>:Technical Adjustments: Adjustments <strong>of</strong> Fringe Benefits to restore <strong>the</strong> District Government contribution foremployee health insurance from 72 percent, implemented in <strong>the</strong> FY 2011 budget, to 75 percent in FY 2013, resultingin an increase <strong>of</strong> $4,463 in Local funds.Board <strong>of</strong> Real Property Assessments and AppealsB-88FY 2013 Proposed <strong>Budget</strong> and <strong>Financial</strong> Plan
FY 2012 Approved <strong>Budget</strong> to FY 2013 Proposed <strong>Budget</strong>, by Revenue TypeTable DA0-5 itemizes <strong>the</strong> changes by revenue type between <strong>the</strong> FY 2012 approved budget and <strong>the</strong> FY 2013 proposedbudget.Table DA0-5(dollars in thousands)PROGRAM BUDGET FTELOCAL FUNDS: FY 2012 Approved <strong>Budget</strong> and FTE 1,631 11.0Fringe Benefit Rate Adjustment Multiple Programs 13 0.0Consumer Price Index Multiple Programs 10 0.0Personal Services Growth Factor Multiple Programs 5 0.0FY 2013 Current Services Funding Level <strong>Budget</strong> (CSFL) 1,659 11.0Create: Creation <strong>of</strong> a new commission structure and two new activities Multiple Programs 685 0.0(Commission Operations and Commission Outreach)Cost Increase: Personal services <strong>Agency</strong> Management Program 4 0.0Cost Decrease: Offset <strong>the</strong> cost <strong>of</strong> creation <strong>of</strong> two new activities Multiple Programs -689 0.0FY 2013 Initial Adjusted <strong>Budget</strong> 1,659 11.0Technical Adjustment: Health insurance contribution Multiple Programs 4 0.0FY 2013 Additionally Adjusted <strong>Budget</strong> 1,663 11.0LOCAL FUNDS: FY 2013 Proposed <strong>Budget</strong> and FTE 1,663 11.0Gross for DA0 - Board <strong>of</strong> Real Property Assessments and Appeals 1,663 11.0FY 2013 Proposed <strong>Budget</strong> and <strong>Financial</strong> PlanBoard <strong>of</strong> Real Property Assessments and AppealsB-89
<strong>Agency</strong> Performance PlanThe agency’s performance plan has <strong>the</strong> following objectives for FY 2013:Objective 1: Conduct efficient operations <strong>of</strong> <strong>the</strong> Commission’s appeals process through scheduling, conduct and deliberations<strong>of</strong> appeals cases.Objective 2: Improve service delivery through <strong>the</strong> greater use <strong>of</strong> technology.Objective 3: Ensure that <strong>the</strong> appellant receives knowledgeable, accurate and complete assessment appeals decisions.<strong>Agency</strong> Performance MeasuresFY 2010 FY 2011 FY 2011 FY 2012 FY 2013 FY 2014Measure Actual Target Actual Projection Projection ProjectionNumber <strong>of</strong> visitors to Commission website Not Not(in thousands) Available Available 11.859 25 50 75Percentage <strong>of</strong> inquiries responded to within 48 hours Not NotAvailable Available 96.90% 100% 100% 100%Percentage <strong>of</strong> inquiries responded to within 24 hours Not NotAvailable Available 85% 85% 95% 100%Percentage <strong>of</strong> residential real property cases decided Not Not Not Notwithin 30 days Available Available Available Available TBD TBDPercentage <strong>of</strong> commercial real property cases Not Not Not Notdecided within 80 days Available Available Available Available TBD TBDBoard <strong>of</strong> Real Property Assessments and AppealsB-90FY 2013 Proposed <strong>Budget</strong> and <strong>Financial</strong> Plan
Department <strong>of</strong> Consumerand Regulatory Affairs(CR0)www.dcra.dc.govTelephone: 202-442-4400% ChangeFY 2011 FY 2012 FY 2013 fromDescription Actual Approved Proposed FY 2012Operating <strong>Budget</strong> $21,698,326 $26,030,884 $32,951,767 26.6FTEs 233.3 267.0 279.0 4.5The Department <strong>of</strong> Consumer and Regulatory Affairs (DCRA) protects<strong>the</strong> health, safety, economic interests, and quality <strong>of</strong> life <strong>of</strong> residents,businesses, and visitors in <strong>the</strong> District <strong>of</strong> Columbia by ensuringcode compliance and regulating business.Summary <strong>of</strong> ServicesDCRA is responsible for regulating construction and business activity in <strong>the</strong> District <strong>of</strong> Columbia. The agencyoperates a consolidated permit intake center and reviews all construction documents to ensure compliance withbuilding codes and zoning regulations. To protect consumers, DCRA issues business licenses, pr<strong>of</strong>essional licenses,and special events permits; registers corporations; and inspects weighing and measuring devices used for monetarypr<strong>of</strong>it. Construction activity, building systems, and rental housing establishments are inspected, and housing codeviolations are abated, if necessary.The agency’s FY 2013 proposed budget is presented in <strong>the</strong> following tables:FY 2013 Proposed <strong>Budget</strong> and <strong>Financial</strong> PlanDepartment <strong>of</strong> Consumer and Regulatory AffairsB-91
FY 2013 Proposed Gross Funds Operating <strong>Budget</strong>, by Revenue TypeTable CR0-1 contains <strong>the</strong> proposed FY 2013 agency budget compared to <strong>the</strong> FY 2012 approved budget. It alsoprovides FY 2010 and FY 2011 actual expenditures.Table CR0-1(dollars in thousands)ChangeActual Actual Approved Proposed from PercentAppropriated Fund FY 2010 FY 2011 FY 2012 FY 2013 FY 2012 Change*General FundLocal Funds 15,499 7,624 10,041 16,365 6,325 63.0Special Purpose Revenue Funds 16,752 14,074 15,990 16,586 596 3.7Total for General Fund 32,251 21,698 26,031 32,952 6,921 26.6Intra-District FundsIntra-District Funds 436 0 0 0 0 N/ATotal for Intra-District Funds 436 0 0 0 0 N/AGross Funds 32,687 21,698 26,031 32,952 6,921 26.6*Percent change is based on whole dollars.Note: If applicable, for a breakdown <strong>of</strong> each Grant (Federal and Private), Special Purpose Revenue type and Intra-District agreement,please refer to Schedule 80 <strong>Agency</strong> Summary by Revenue Source in <strong>the</strong> FY 2013 Operating Appendices located on <strong>the</strong> <strong>Office</strong> <strong>of</strong> <strong>the</strong><strong>Chief</strong> <strong>Financial</strong> <strong>Office</strong>r’s website.FY 2013 Proposed Full-Time Equivalents, by Revenue TypeTable CR0-2 contains <strong>the</strong> proposed FY 2013 FTE level compared to <strong>the</strong> FY 2012 approved FTE level by revenuetype. It also provides FY 2010 and FY 2011 actual data.Table CR0-2ChangeActual Actual Approved Proposed from PercentAppropriated Fund FY 2010 FY 2011 FY 2012 FY 2013 FY 2012 ChangeGeneral FundLocal Funds 69.0 77.7 97.0 132.0 35.0 36.1Special Purpose Revenue Funds 185.6 155.6 170.0 147.0 -23.0 -13.5Total for General Fund 254.6 233.3 267.0 279.0 12.0 4.5Total Proposed FTEs 254.6 233.3 267.0 279.0 12.0 4.5Department <strong>of</strong> Consumer and Regulatory AffairsB-92FY 2013 Proposed <strong>Budget</strong> and <strong>Financial</strong> Plan
FY 2013 Proposed Operating <strong>Budget</strong>, by Comptroller Source GroupTable CR0-3 contains <strong>the</strong> proposed FY 2013 budget at <strong>the</strong> Comptroller Source Group (object class) level comparedto <strong>the</strong> FY 2012 approved budget. It also provides FY 2010 and FY 2011 actual expenditures.Table CR0-3(dollars in thousands)ChangeActual Actual Approved Proposed from PercentComptroller Source Group FY 2010 FY 2011 FY 2012 FY 2013 FY 2012 Change*11 - Regular Pay - Continuing Full Time 16,032 14,924 18,017 18,936 919 5.112 - Regular Pay - O<strong>the</strong>r 207 88 149 125 -23 -15.813 - Additional Gross Pay 1,010 409 0 0 0 N/A14 - Fringe Benefits - Current Personnel 3,640 3,223 3,915 4,441 526 13.415 - Overtime Pay 267 243 129 201 72 55.8Subtotal Personal Services (PS) 21,157 18,888 22,210 23,704 1,494 6.720 - Supplies and Materials 95 86 141 203 62 43.530 - Energy, Comm. and Building Rentals 28 0 0 0 0 N/A31 - Telephone, Telegraph, Telegram, Etc. 370 1 389 389 0 0.032 - Rentals - Land and Structures 7,454 0 0 0 0 N/A34 - Security Services 269 0 0 0 0 N/A35 - Occupancy Fixed Costs 38 0 0 0 0 N/A40 - O<strong>the</strong>r Services and Charges 1,589 852 860 1,921 1,061 123.441 - Contractual Services - O<strong>the</strong>r 1,661 1,858 2,415 6,682 4,268 176.770 - Equipment and Equipment Rental 25 13 16 53 37 227.2Subtotal Nonpersonal Services (NPS) 11,530 2,811 3,821 9,248 5,427 142.0Gross Funds 32,687 21,698 26,031 32,952 6,921 26.6*Percent change is based on whole dollars.Division DescriptionThe Department <strong>of</strong> Consumer and Regulatory Affairs operates through <strong>the</strong> following 7 divisions:Licensing – serves as a central point <strong>of</strong> <strong>the</strong> agency’s customer service intake and issuance responsibilities for business,corporate, and pr<strong>of</strong>essional licenses, and for compliance with business regulations.This division contains <strong>the</strong> following 4 activities:■ Business Service Center – provides a public-facing <strong>of</strong>fice where customers can inquire about, apply for, andreceive business licenses and vending licenses, and can register corporations;■ License and Registration Renewal – processes and conducts research for business license applications, renewals,and certifications for businesses seeking to conduct business in <strong>the</strong> District;■ Occupational and Pr<strong>of</strong>essional Licenses – develops licensing standards, administers examinations, processeslicense applications, makes recommendations for board rulings, issues licenses and certificates, and providestechnical support and administrative assistance; andFY 2013 Proposed <strong>Budget</strong> and <strong>Financial</strong> PlanDepartment <strong>of</strong> Consumer and Regulatory AffairsB-93
■Corporations – protects <strong>the</strong> health, safety, and welfare <strong>of</strong> <strong>the</strong> residents <strong>of</strong> <strong>the</strong> District <strong>of</strong> Columbia and <strong>the</strong>community through maintenance services and timely registration, including trade name registration <strong>of</strong>corporations, limited liability companies, and partnerships conducting affairs within <strong>the</strong> District <strong>of</strong> Columbia.Enforcement - coordinates and monitors enforcement <strong>of</strong> violations cited by <strong>the</strong> agency’s regulatory programs, andworks closely with <strong>the</strong> <strong>Office</strong> <strong>of</strong> <strong>the</strong> Attorney General to ensure that actions taken are legally sufficient. Thedivision also registers vacant properties to encourage <strong>the</strong>ir return to productive use and condemns existing propertiesfor <strong>the</strong> existence <strong>of</strong> unsafe and deteriorating conditions.This division contains <strong>the</strong> following 6 activities:■ Enforcement Unit – processes all civil infractions with <strong>the</strong> <strong>Office</strong> <strong>of</strong> Administrative Hearings, represents DCRAin most civil proceedings, collects fines, and places property liens on unpaid fines;■ Regulatory Investigations – investigates unlicensed business activity;■ Rehabilitation – abates housing and building code violations when cited property owners fail to do so,processes abatement contracts, and collects unpaid abatement costs;■ Vacant Property – registers vacant properties in <strong>the</strong> District <strong>of</strong> Columbia and condemns properties thatendanger <strong>the</strong> health or lives <strong>of</strong> <strong>the</strong> occupants or persons living in <strong>the</strong> vicinity;■ Weights and Measures – inspects all commercially used weighing and measuring devices in <strong>the</strong> District <strong>of</strong>Columbia; and■ Consumer Protection – serves as <strong>the</strong> District <strong>of</strong> Columbia’s central clearinghouse for consumer complaints,mediates disagreements between consumers and businesses, and investigates claims <strong>of</strong> illegal and unfair tradepractices.Inspections – protects District residents and visitors and ensures habitable housing by performing residentialinspections and by inspecting construction sites for code compliance and proper permits, manages <strong>the</strong> District’sthird-party inspection program, monitors elevators and boilers in District buildings, and maintains <strong>the</strong> District’sbuilding codes to ensure that <strong>the</strong> District’s state-<strong>of</strong>-<strong>the</strong>-art and unique buildings are structurally sound.This division contains <strong>the</strong> following 3 activities:■ Building Inspection – manages commercial building and permit-related inspection requests and issuescitations for violations <strong>of</strong> <strong>the</strong> District’s Building Codes and District’s Zoning Regulations to correctconstruction code violations;■ Residential Inspections – manages inspection requests for residential properties and issues citations <strong>of</strong> housingcode violations; and■ Construction Compliance – manages and coordinates revisions to <strong>the</strong> District’s building and trade codes tomeet current demands for adequate and safe construction and <strong>the</strong> maintenance <strong>of</strong> new and existing buildingstructures as outlined by <strong>the</strong> International Code Council Family <strong>of</strong> Codes.Permitting – certifies compliance with current building and land use codes, manages a consolidated permitapplication intake center hosting multiple agencies, issues permits for District construction projects, and maintainsland records.This division contains <strong>the</strong> following 5 activities:■ Plan Review – conducts technical building plan reviews for approval and issues building permits;■ Homeowner Center – functions as a dedicated resource center for homeowners conducting small interior andexterior renovations <strong>of</strong> <strong>the</strong>ir personal residences;■ Development Ambassador – assists large-scale projects through <strong>the</strong> permit processing to <strong>the</strong> issuance <strong>of</strong> apermit;Department <strong>of</strong> Consumer and Regulatory AffairsB-94FY 2013 Proposed <strong>Budget</strong> and <strong>Financial</strong> Plan
■■Permits – serves as <strong>the</strong> District’s central intake and issuance center for building permits and certificates <strong>of</strong>occupancy; andSurveyor – produces and maintains <strong>the</strong> District’s land records.Zoning and Construction Compliance – interprets and enforces <strong>the</strong> District’s zoning regulations.<strong>Agency</strong> Management – provides for administrative support and <strong>the</strong> required tools to achieve operational andprogrammatic results. This division is standard for all agencies using division-based budgeting.<strong>Agency</strong> <strong>Financial</strong> Operations – provides comprehensive and efficient financial management services to, and onbehalf <strong>of</strong>, District agencies so that <strong>the</strong> financial integrity <strong>of</strong> <strong>the</strong> District <strong>of</strong> Columbia is maintained. This divisionis standard for all agencies using division-based budgeting.Division Structure ChangeThe Department <strong>of</strong> Consumer and Regulatory Affairs has no division structure changes in <strong>the</strong> FY 2013 proposedbudget.FY 2013 Proposed Operating <strong>Budget</strong> and FTEs, by Division and ActivityTable CR0-4 contains <strong>the</strong> proposed FY 2013 budget by division and activity compared to <strong>the</strong> FY 2012 approved budget.It also provides <strong>the</strong> FY 2011 actual data.Table CR0-4(dollars in thousands)Dollars in ThousandsFull-Time EquivalentsChangeChangeActual Approved Proposed from Actual Approved Proposed fromDivision/Activity FY 2011 FY 2012 FY 2013 FY 2012 FY 2011 FY 2012 FY 2013 FY 2012(1000) Administrative Services(1010) Personnel 340 225 236 10 2.6 2.0 2.0 0.0(1015) Training and Employee Development -5 0 0 0 0.0 0.0 0.0 0.0(1020) Contracting and Procurement 154 134 139 5 1.9 2.0 2.0 0.0(1030) Property Management 138 178 183 5 1.8 2.0 2.0 0.0(1040) Information Technology 1,420 1,520 1,921 401 10.5 12.0 13.0 1.0(1055) Risk Management 267 337 355 18 3.5 4.0 4.0 0.0(1060) Legal 32 101 103 2 0.8 1.0 1.0 0.0(1070) Fleet Management 180 277 194 -83 1.0 1.0 1.0 0.0(1080) Communications 106 0 0 0 1.7 0.0 0.0 0.0(1085) Customer Service 889 927 912 -15 12.1 12.0 12.0 0.0(1090) Performance Management 917 933 998 65 7.4 8.0 8.0 0.0Subtotal (1000) Administrative Services 4,438 4,633 5,040 407 43.3 44.0 45.0 1.0(100F) <strong>Agency</strong> <strong>Financial</strong> Operations(110F) <strong>Budget</strong> Operations 260 270 455 185 1.9 2.0 4.0 2.0(120F) Accounting Operations 397 456 427 -29 4.6 5.0 5.0 0.0(130F) ACFO Operations 339 372 431 59 2.8 3.0 3.0 0.0Subtotal (100F) <strong>Agency</strong> <strong>Financial</strong> Operations 996 1,098 1,312 214 9.4 10.0 12.0 2.0(Continued on next page)FY 2013 Proposed <strong>Budget</strong> and <strong>Financial</strong> PlanDepartment <strong>of</strong> Consumer and Regulatory AffairsB-95
Table CR0-4 (Continued)(dollars in thousands)Dollars in ThousandsFull-Time EquivalentsChangeChangeActual Approved Proposed from Actual Approved Proposed fromDivision/Activity FY 2011 FY 2012 FY 2013 FY 2012 FY 2011 FY 2012 FY 2013 FY 2012(2000) Permitting(2020) Plan Review 2,279 2,379 2,315 -64 23.8 26.0 25.0 -1.0(2025) Homeowner Center 86 62 68 6 1.7 1.0 1.0 0.0(2030) Development Ambassador 233 329 841 512 3.5 4.0 5.0 1.0(2040) Regulatory Investigations 4 0 0 0 0.0 0.0 0.0 0.0(2050) Permits 914 868 880 12 11.8 13.0 13.0 0.0(2060) Surveyor 696 689 711 22 7.0 8.0 8.0 0.0Subtotal (2000) Permitting 4,212 4,327 4,815 488 47.9 52.0 52.0 0.0(3000) Enforcement(3020) Scheduling and Enforcement Unit 21 267 274 6 2.6 3.0 3.0 0.0(3025) Vacant Property 126 291 397 106 3.4 4.0 6.0 2.0(3045) Regulatory Investigations 918 847 948 101 8.5 9.0 10.0 1.0(3050) Rehabilitation 29 1,009 4,815 3,806 0.0 9.0 9.0 0.0(3055) Consumer Protection 146 175 263 89 1.7 2.0 3.0 1.0(3060) Weights and Measures 227 292 318 26 3.4 4.0 4.0 0.0Subtotal (3000) Enforcement 1,467 2,881 7,014 4,133 19.6 31.0 35.0 4.0(4000) Inspection(3010) Building Inspections Division 2,826 3,095 2,973 -121 33.5 36.0 34.0 -2.0(3080) Residential Inspections 1,290 2,239 2,397 159 25.5 30.0 31.0 1.0(3095) Construction Compliance 226 309 312 2 3.4 4.0 4.0 0.0Subtotal (4000) Inspection 4,342 5,643 5,683 40 62.4 70.0 69.0 -1.0(6000) Zoning and Construction Compliance(6010) Zoning Administrator 919 1,106 1,134 28 10.7 12.0 12.0 0.0Subtotal (6000) Zoning and Construction Compliance 919 1,106 1,134 28 10.7 12.0 12.0 0.0(7000) Licensing(2070) Business Service Center 320 409 415 6 4.4 5.0 5.0 0.0(2080) Corporation Division 662 1,204 1,521 318 6.8 10.0 13.0 3.0(2090) License and Registration Renewal 1,266 1,221 1,744 522 16.2 19.0 18.0 -1.0(2095) Occupational and Pr<strong>of</strong>essional Licensing 3,077 3,509 4,273 765 12.8 14.0 18.0 4.0Subtotal (7000) Licensing 5,324 6,343 7,954 1,611 40.1 48.0 54.0 6.0Total Proposed Operating <strong>Budget</strong> 21,698 26,031 32,952 6,921 233.3 267.0 279.0 12.0(Change is calculated by whole numbers and numbers may not add up due to rounding)Note: For more detailed information regarding <strong>the</strong> proposed funding for <strong>the</strong> activities within this agency’s divisions, please see Schedule 30-PBBProgram Summary by Activity in <strong>the</strong> FY 2013 Operating Appendices located on <strong>the</strong> <strong>Office</strong> <strong>of</strong> <strong>the</strong> <strong>Chief</strong> <strong>Financial</strong> <strong>Office</strong>r’s website.Department <strong>of</strong> Consumer and Regulatory AffairsB-96FY 2013 Proposed <strong>Budget</strong> and <strong>Financial</strong> Plan
FY 2013 Proposed <strong>Budget</strong> ChangesThe Department <strong>of</strong> Consumer and Regulatory Affairs’ (DCRA) proposed FY 2013 gross budget is $32,951,767,which represents a 26.6 percent increase over its FY 2012 approved gross budget <strong>of</strong> $26,030,884. The budget iscomprised <strong>of</strong> $16,365,311 in Local funds and $16,586,456 in Special Purpose Revenue funds.Current Service Funding LevelThe Current Services Funding Level (CSFL) is a Local funds ONLY representation <strong>of</strong> <strong>the</strong> true cost <strong>of</strong> operatingDistrict agencies, before consideration <strong>of</strong> policy decisions. The CSFL reflects changes from <strong>the</strong> FY 2012 approvedbudget across multiple programs, and it estimates how much it would cost an agency to continue its currentprograms and operations into <strong>the</strong> following fiscal year. The initial adjustments in <strong>the</strong> budget proposal representchanges that should be compared to <strong>the</strong> FY 2013 CSFL budget and not necessarily changes made to <strong>the</strong> FY 2012Local funds budget. The FY 2013 CSFL adjustments to <strong>the</strong> FY 2012 Local funds budget are described in table 5<strong>of</strong> this agency's budget chapter. Please see <strong>the</strong> CSFL Development section within Volume 1: Executive Summaryfor more information regarding <strong>the</strong> methodology used and components that comprise <strong>the</strong> CSFL.DCRA's FY 2013 CSFL budget is $10,201,544, which represents a $160,963, or 1.6 percent, increase over<strong>the</strong> FY 2012 approved Local funds budget <strong>of</strong> $10,040,581.Initial Adjusted <strong>Budget</strong>Enhance: Local funds increased by $1,014,729 and 9.0 FTEs to promote a fair market-place initiative thatsupports consumer education outreach services and may serve as a clearing house for consumer complaints.Cost Increase: $80,006 in Local funds to support salary, steps, and Fringe Benefits cost increases, and $2,160,301in Special Purpose Revenue funds to align with revenue estimates.Cost Decrease: $80,006 in Local funds reflects <strong>the</strong> changes in Contractual Services – O<strong>the</strong>r and O<strong>the</strong>r Servicesand Charges to <strong>of</strong>fset <strong>the</strong> increase in personal services.Technical Adjustment: $1,508,349 and 23.0 FTEs increase in Local funds, and <strong>the</strong> same decrease in SpecialPurpose Revenue funds, is a result <strong>of</strong> a shift <strong>of</strong> <strong>the</strong> Nuisance Abatement initiative to Local funds.Additionally Adjusted <strong>Budget</strong>Technical Adjustment: Adjustment <strong>of</strong> Fringe Benefits to restore <strong>the</strong> District Government contribution foremployee health insurance from 72 percent, implemented in <strong>the</strong> FY 2011 budget, to 75 percent in FY 2013,resulting in an increase <strong>of</strong> $47,518 in Local funds and $38,201 in Special Purpose Revenue funds.Policy InitiativesTechnical Adjustment: $3,500,000 in Local funds for <strong>the</strong> Enforcement program to maintain <strong>the</strong> NuisanceAbatement initiative previously funded through Capital funds.Cost Increase: $96,000 and 2.0 FTEs to identify more vacant properties, $94,000 in Local funds to fund Bill 19-80, <strong>the</strong> Accountant Mobility Act <strong>of</strong> 2011, $72,000 and 1.0 FTE to support a Rental Housing Non-complianceinitiative, $20,000 in One-Time implementation costs for 2 motor fuels testing devices <strong>of</strong> $10,000 each, and$8,000 for recurring costs for maintaining and calibrating <strong>the</strong> testing equipment.Cost Decrease: $196,829 in Local fund to align <strong>the</strong> Contractual Services budget with projected expenditures, and$94,000 in Special Purpose Revenue to also align <strong>the</strong> contractual services budget with expected revenue in FY 2013.FY 2013 Proposed <strong>Budget</strong> and <strong>Financial</strong> PlanDepartment <strong>of</strong> Consumer and Regulatory AffairsB-97
FY 2012 Approved <strong>Budget</strong> to FY 2013 Proposed <strong>Budget</strong>, by Revenue TypeTable CR0-5 itemizes <strong>the</strong> changes by revenue type between <strong>the</strong> FY 2012 approved budget and <strong>the</strong> FY 2013 proposedbudget.Table CR0-5(dollars in thousands)PROGRAM BUDGET FTELOCAL FUNDS: FY 2012 Approved <strong>Budget</strong> and FTE 10,041 97.0Fringe Benefit Rate Adjustment Multiple Programs 109 0.0Consumer Price Index Multiple Programs 16 0.0Personal Services Growth Factor Multiple Programs 36 0.0FY 2013 Current Services Funding Level <strong>Budget</strong> (CSFL) 10,202 97.0Enhance: Increase in personal services to promote Multiple Programs 1,015 9.0a fair market-place through consumer education outreach servicesCost Increase: In personal services due to salary Multiple Programs 80 0.0steps and Fringe Benefits cost increasesCost Decrease: In nonpersonal services to absorb salary, Multiple Programs -80 0.0steps and Fringe Benefits cost increasesTechnical Adjustments: Shift <strong>of</strong> FTEs from Special Enforcement 1,508 23.0Purpose Revenue funds, Nuisance Abatement InitiativeFY 2013 Initial Adjusted <strong>Budget</strong> 12,725 129.0Technical Adjustment: Health insurance contribution Multiple Programs 48 0.0FY 2013 Additionally Adjusted <strong>Budget</strong> 12,772 129.0FY 2013 Policy InitiativesTechnical Adjustment: To maintain Nuisance Abatement initiative Enforcement 3,500 0.0previously funded by Capital fundsCost Increase: To identify vacant properties in <strong>the</strong> District Enforcement 96 2.0Cost Increase: To fund Bill 19-80, Accountant Mobility Act <strong>of</strong> 2011 Licensing 94 0.0Cost Increase: To support rental housing non-compliance initiative Enforcement 72 1.0Cost Increase: One-time implementation costs for testing devices Enforcement 20 0.0Cost Increase: For maintenance <strong>of</strong> testing equipment Enforcement 8 0.0Cost Decrease: To align Contractual Services budget with projected expenditures Administrative Services -197 0.0LOCAL FUNDS: FY 2013 Proposed <strong>Budget</strong> and FTE 16,365 132.0SPECIAL PURPOSE REVENUE FUNDS: FY 2012 Approved <strong>Budget</strong> and FTE 15,990 170.0Cost Increase: In nonpersonal services due to increase in projected revenue Multiple Programs 2,160 0.0Technical Adjustments: Shift FTEs to Local funds Enforcement -1,508 -23.0FY 2013 Initial Adjusted <strong>Budget</strong> 16,642 147.0Technical Adjustment: Health insurance contribution Multiple Programs 38 0.0FY 2013 Additionally Adjusted <strong>Budget</strong> 16,680 147.0FY 2013 Policy InitiativesCost Decrease: To align contractual services budget with expected revenue Licensing -94 0.0SPECIAL PURPOSE REVENUE FUNDS: FY 2013 Proposed <strong>Budget</strong> and FTE 16,586 147.0Gross for CR0 - Department <strong>of</strong> Consumer and Regulatory Affairs 32,952 279.0(Change is calculated by whole numbers and numbers may not add up due to rounding)Department <strong>of</strong> Consumer and Regulatory AffairsB-98FY 2013 Proposed <strong>Budget</strong> and <strong>Financial</strong> Plan
<strong>Agency</strong> Performance PlanThe agency’s performance plan has <strong>the</strong> following objectives for FY 2013:1. Business and Pr<strong>of</strong>essional Licensing Administration (BPLA)Objective 1: Maintain efficient licensing operations.Objective 2: Manage corporate registration and maintenance services.Objective 3: Ensure compliance with licensing requirements.Business and Pr<strong>of</strong>essional Licensing Administration (BPLA)FY 2010 FY 2011 FY 2011 FY 2012 FY 2013 FY 2014Measure Actual Target Actual Projection Projection ProjectionPercentage <strong>of</strong> business license applications submittedonline (new and renewal) 7% 60% 16.59% 80% 90% 92%Percentage <strong>of</strong> business licenses issued withinBaseline45 business days Year 50% 42.54% 70% 85% 87%Percentage <strong>of</strong> pr<strong>of</strong>essional license applicationssubmitted online (new and renewal) 68% 60% 90.88% 80% 90% 92%Percentage <strong>of</strong> corporate filings submitted online 0% 60% 11.14% 65% 70% 75%Percentage <strong>of</strong> occupational and pr<strong>of</strong>essional licenserenewals processed in three days (when a completeapplication is submitted) 95% 100% 90% 97% 98% 98%Percentage <strong>of</strong> regulatory investigations resulting in <strong>the</strong>issuance <strong>of</strong> a notice <strong>of</strong> infraction 99% 60% 23.08% 87% 85% 85%Percentage <strong>of</strong> businesses that have obtained a business Baselinelicense after being issued a notice <strong>of</strong> infraction Year 60% 9.90% 70% 80% 80%Percentage <strong>of</strong> pre-license investigations conducted byregulatory investigations within five business days 95% 85% 95.73% 90% 95% 95%Percentage <strong>of</strong> weighing and measuring devices approved 98% 80% 96.09% 85% 90% 90%2. Permit OperationsObjective 1: Ensure building plans comply with construction codes.Objective 2: Provide superior customer service in <strong>the</strong> Permit Center.Objective 3: Manage and maintain District land records.FY 2013 Proposed <strong>Budget</strong> and <strong>Financial</strong> PlanDepartment <strong>of</strong> Consumer and Regulatory AffairsB-99
Permit OperationsFY 2010 FY 2011 FY 2011 FY 2012 FY 2013 FY 2014Measure Actual Target Actual Projection Projection ProjectionAverage length <strong>of</strong> customer wait in PermitCenter (minutes) 17 16 57.39 15 15 15Percentage <strong>of</strong> walk through applicationsprocessed same dayNotAvailable 70% 61.03% 75% 80% 82%Percentage <strong>of</strong> green building plan reviewcompleted within 30 daysNotAvailable 95% 100% 97% 99% 99%Percentage <strong>of</strong> filed plan reviews completed on-time 91.7% 94% 94% 95% 96% 97%Percentage <strong>of</strong> TPR project reviews by DCRATechnical Review within 15 business daysNotAvailable 80% 77.85% 85% 90% 92%Percentage <strong>of</strong> building plats utilizing expeditedreview service 11% 20% 22.07% 30% 35% 37%Percentage <strong>of</strong> applications submitted onlineNotAvailable Baseline 15.05% TBD TBD TBDPercentage <strong>of</strong> all permit applications held forcorrectionNotAvailable TBD Baseline TBD TBD TBDPercentage <strong>of</strong> permits issued online (postcard,supplemental, eHOP)NotAvailable TBD 13.47% TBD TBD TBDPercentage <strong>of</strong> permits issued on <strong>the</strong> same dayas application 1 NotAvailable Baseline Baseline TBD TBD TBDeHOP = electronic Home Occupancy PermitTPR: Third Party ReviewPerformance Plan Endnotes:1. Industry Standard Measure: ICMA reports that in FY 2009, 54 percent <strong>of</strong> permits issued in jurisdictions with over 100,000 in populationwere issued on <strong>the</strong> date <strong>of</strong> application. The 57 jurisdictions surveyed issued a mean 16,621 building permits in FY 2009.3. <strong>Office</strong> <strong>of</strong> Zoning AdministratorObjective 1: Enhance applicant and general citizen satisfaction through timely, efficient and accurate application zoning conformancereview processes.Objective 2: Pursue enforcement <strong>of</strong> verified zoning violations through timely and forceful action to achieve compliance.<strong>Office</strong> <strong>of</strong> <strong>the</strong> Zoning AdministratorFY 2010 FY 2011 FY 2011 FY 2012 FY 2013 FY 2014Measure Actual Target Actual Projection Projection ProjectionPercentage <strong>of</strong> Certificate <strong>of</strong> occupancy applicationsreceiving OZA initial review from <strong>the</strong> application date,in compliance with timelines (30 business days) 86% 95% 93.20% 95% 95% 95%Percentage <strong>of</strong> HOPs issued within 10 business days Not<strong>of</strong> application submission available 90% 84.25% 90% 95% 95%Percentage <strong>of</strong> successful defenses <strong>of</strong> appeals <strong>of</strong>Zoning Administrator decisions before <strong>the</strong> BZA 88% 90% 77.78% 75% 78% 79%Percentage <strong>of</strong> complaint-initiated enforcement actionsoccurring within 60 days <strong>of</strong> receipt <strong>of</strong> concern 51% 70% 773.63% 80% 90% 92%Department <strong>of</strong> Consumer and Regulatory AffairsB-100FY 2013 Proposed <strong>Budget</strong> and <strong>Financial</strong> Plan
4. InspectionsObjective 1: Manage an efficient combination inspection program.Objective 2: Manage an efficient housing inspection program.Objective 3: Develop a premier specialty inspections program.InspectionsFY 2010 FY 2011 FY 2011 FY 2012 FY 2013 FY 2014Measure Actual Target Actual Projection Projection ProjectionNumber <strong>of</strong> units inspected by ProactiveInspections Team 1,718 2,500 2,075 2,500 2,500 2,500Percentage <strong>of</strong> complaint-related inspectionsNotconducted within 3-5 days <strong>of</strong> <strong>the</strong> request Available 75% 78.83% 80% 85% 85%Percentage <strong>of</strong> permit-related inspectionscompleted within 48 hours <strong>of</strong> request 94% 100% 93.53% 87% 90% 90%Number <strong>of</strong> Quality Control inspections performedNoton Third-Party Inspections Available Baseline 165 TBD TBD TBDPercentage <strong>of</strong> Third-Party Inspection agencies with Notquality control audits found to be in compliance Available Baseline 69.70% TBD TBD TBDPercentage reduction in <strong>the</strong> number <strong>of</strong> illegalconstruction cases dismissed at <strong>the</strong> initialNotDCRA appeal hearing Available 10% 17.40% 10% 10% 10%Percentage <strong>of</strong> inspections completed as scheduled 81% 80% 92.0% 82% 85% 85%Average number <strong>of</strong> inspections per inspector dailyNotAvailable TBD 6.46 TBD TBD TBDAverage number <strong>of</strong> Housing inspections per Not Notinspector daily Available TBD Available TBD TBD TBDAverage number <strong>of</strong> Construction inspections per Not Notinspector daily Available TBD Available TBD TBD TBDFY 2013 Proposed <strong>Budget</strong> and <strong>Financial</strong> PlanDepartment <strong>of</strong> Consumer and Regulatory AffairsB-101
5. Enforcement and Legislative AffairsObjective 1: Provide efficient and effective regulatory and compliance processes.Objective 2: Protect <strong>the</strong> health and safety <strong>of</strong> people who visit, live, and work in <strong>the</strong> District <strong>of</strong> Columbia.Enforcement and Legislative AffairsFY 2010 FY 2011 FY 2011 FY 2012 FY 2013 FY 2014Measure Actual Target Actual Projection Projection ProjectionTotal number <strong>of</strong> vacant properties 2,896 3,400 6,529 3,200 3,000 TBDPercentage <strong>of</strong> registered vacant properties(includes properties that are registered and exempt) 62.5% 75% 46.81% 80% 85% TBDPercentage <strong>of</strong> rate <strong>of</strong> return on specialassessments filedNotAvailable Baseline 68.46% TBD TBD TBDTotal dollar amount <strong>of</strong> Special Assessments collected $597,556 $1,600,000 $2,404,486.14 $1,900,000 $2,000,000 TBDPercentage <strong>of</strong> cases "won" with OAH finding <strong>of</strong>liability (“upheld”) 44% 80% 42.15% 85% 90% TBDTotal dollar amount <strong>of</strong> tax liens collected $888,697 Baseline $203,648.78 TBD TBD TBDNumber <strong>of</strong> blighted properties reported to OTR 300 220 1,034 210 200 TBDPercentage <strong>of</strong> DCRA abatements completedwithin 30 days 77% 70% 82.34% 75% 80% TBDOAH: <strong>Office</strong> <strong>of</strong> Administrative HearingsOTR: <strong>Office</strong> <strong>of</strong> Tax and RevenueDepartment <strong>of</strong> Consumer and Regulatory AffairsB-102FY 2013 Proposed <strong>Budget</strong> and <strong>Financial</strong> Plan
6. <strong>Agency</strong> ManagementObjective 1: Maintain a qualified, healthy, and highly motivated workforce.Objective 2: Increase public awareness <strong>of</strong> DCRA programs and services.Objective 3: Manage agency performance and integrity.Objective 4: Provide excellent customer service.Objective 5: Support <strong>the</strong> agency by managing facilities, resources, and reducing risks to agency assets.Objective 6: Expand and maintain technology infrastructure.Objective 7: Manage <strong>the</strong> Construction Codes Coordinating Board (CCCB).<strong>Agency</strong> ManagementFY 2010 FY 2011 FY 2011 FY 2012 FY 2013 FY 2014Measure Actual Target Actual Projection Projection ProjectionPercentage <strong>of</strong> OIG inquiries completed timely 95% 100% 92.31% 100% 100% N/APercentage <strong>of</strong> FOIA requests completed timely 71.5% 90% 52.28% 95% 95% N/AFOIA: Freedom <strong>of</strong> Information ActOIG: <strong>Office</strong> <strong>of</strong> <strong>the</strong> Inspector GeneralFY 2013 Proposed <strong>Budget</strong> and <strong>Financial</strong> PlanDepartment <strong>of</strong> Consumer and Regulatory AffairsB-103
<strong>Office</strong> <strong>of</strong> <strong>the</strong> Tenant Advocate(CQ0)http://ota.dc.govTelephone: 202-719-6560% ChangeFY 2011 FY 2012 FY 2013 fromDescription Actual Approved Proposed FY 2012Operating <strong>Budget</strong> $1,755,446 $1,923,771 $2,063,971 7.3FTEs 13.3 13.5 15.0 11.1The mission <strong>of</strong> <strong>the</strong> <strong>Office</strong> <strong>of</strong> <strong>the</strong> Tenant Advocate (OTA) is toprovide technical advice and o<strong>the</strong>r legal services to tenantsregarding disputes with landlords; to educate and inform <strong>the</strong> tenantcommunity about tenant rights and rental housing matters;to advocate for <strong>the</strong> rights and interests <strong>of</strong> District renters in <strong>the</strong>legislative, regulatory, and judicial contexts; and to provide financialassistance for certain emergency housing and tenant relocationexpenses as defined in <strong>the</strong> Housing Assistance Fund statute.Summary <strong>of</strong> ServicesThe OTA provides a range <strong>of</strong> services to <strong>the</strong> tenant community to fur<strong>the</strong>r each aspect <strong>of</strong> its mission. (1) OTA advisestenants on resolving disputes with landlords, identifies legal issues and <strong>the</strong> rights and responsibilities <strong>of</strong> tenantsand landlords, and provides legal and technical assistance for fur<strong>the</strong>r action such as filing tenant petitions. (2) OTAprovides in-house representation for tenants in certain cases, and refers o<strong>the</strong>r cases to pro bono or contracted legalservice providers and attorneys. (3) OTA works with o<strong>the</strong>r governmental and non-governmental <strong>of</strong>ficials and entities,including <strong>the</strong> District Council, <strong>the</strong> Mayor’s <strong>of</strong>fice, executive agencies, <strong>the</strong> courts, tenant stakeholders, advocates,and o<strong>the</strong>rs, to promote better tenant protection laws and policies in <strong>the</strong> District. (4) OTA conducts educationalseminars in a variety <strong>of</strong> contexts to inform tenants about <strong>the</strong>ir rights and o<strong>the</strong>r rental housing concerns. (5)OTA provides financial assistance for certain emergency housing and relocation expenses to tenants displaced byfires, floods, or government closures.The FY 2013 proposed budget is presented in <strong>the</strong> following tables:FY 2013 Proposed <strong>Budget</strong> and <strong>Financial</strong> Plan<strong>Office</strong> <strong>of</strong> <strong>the</strong> Tenant AdvocateB-105
FY 2013 Proposed Gross Funds Operating <strong>Budget</strong>, by Revenue TypeTable CQ0-1 contains <strong>the</strong> proposed FY 2013 agency budget compared to <strong>the</strong> FY 2012 approved budget. It alsoprovides FY 2010 and FY 2011 actual expenditures.Table CQ0-1(dollars in thousands)ChangeActual Actual Approved Proposed from PercentAppropriated Fund FY 2010 FY 2011 FY 2012 FY 2013 FY 2012 Change*General FundLocal Funds 539 560 1,924 2,064 140 7.3Special Purpose Revenue Funds 1,780 1,195 0 0 0 N/ATotal for General Fund 2,319 1,755 1,924 2,064 140 7.3Gross Funds 2,319 1,755 1,924 2,064 140 7.3*Percent change is based on whole dollars.Note: If applicable, for a breakdown <strong>of</strong> each Grant (Federal and Private), Special Purpose Revenue type and Intra-District agreement,please refer to Schedule 80 <strong>Agency</strong> Summary by Revenue Source in <strong>the</strong> FY 2013 Operating Appendices located on <strong>the</strong> <strong>Office</strong> <strong>of</strong> <strong>the</strong><strong>Chief</strong> <strong>Financial</strong> <strong>Office</strong>r’s website.FY 2013 Proposed Full-Time Equivalents, by Revenue TypeTable CQ0-2 contains <strong>the</strong> proposed FY 2013 FTE level compared to <strong>the</strong> FY 2012 approved FTE level by revenuetype. It also provides FY 2010 and FY 2011 actual data.Table CQ0-2ChangeActual Actual Approved Proposed from PercentAppropriated Fund FY 2010 FY 2011 FY 2012 FY 2013 FY 2012 ChangeGeneral FundLocal Funds 4.3 7.4 13.5 15.0 1.5 11.1Special Purpose Revenue Funds 9.6 6.0 0.0 0.0 0.0 N/ATotal for General Fund 13.8 13.3 13.5 15.0 1.5 11.1Total Proposed FTEs 13.8 13.3 13.5 15.0 1.5 11.1<strong>Office</strong> <strong>of</strong> <strong>the</strong> Tenant AdvocateB-106FY 2013 Proposed <strong>Budget</strong> and <strong>Financial</strong> Plan
FY 2013 Proposed Operating <strong>Budget</strong>, by Comptroller Source GroupTable CQ0-3 contains <strong>the</strong> proposed FY 2013 budget at <strong>the</strong> Comptroller Source Group (object class) level comparedto <strong>the</strong> FY 2012 approved budget. It also provides FY 2010 and FY 2011 actual expenditures.Table CQ0-3(dollars in thousands)ChangeActual Actual Approved Proposed from PercentComptroller Source Group FY 2010 FY 2011 FY 2012 FY 2013 FY 2012 Change*11 - Regular Pay - Continuing Full Time 936 916 942 1,061 120 12.712 - Regular Pay - O<strong>the</strong>r 27 16 14 0 -14 -100.013 - Additional Gross Pay 21 13 0 0 0 N/A14 - Fringe Benefits - Current Personnel 224 230 170 285 115 67.415 - Overtime Pay 6 2 0 0 0 N/ASubtotal Personal Services (PS) 1,213 1,176 1,126 1,347 220 19.620 - Supplies and Materials 39 0 22 22 0 0.131 - Telephone, Telegraph, Telegram, Etc. 31 13 38 0 -38 -100.032 - Rentals - Land and Structures 171 0 0 0 0 N/A35 - Occupancy Fixed Costs 1 0 0 0 0 N/A40 - O<strong>the</strong>r Services and Charges 129 542 290 375 85 29.441 - Contractual Services - O<strong>the</strong>r 736 24 434 310 -125 -28.750 - Subsidies and Transfers 0 0 10 2 -8 -75.070 - Equipment and Equipment Rental 0 0 2 8 5 200.0Subtotal Nonpersonal Services (NPS) 1,106 579 797 717 -80 -10.1Gross Funds 2,319 1,755 1,924 2,064 140 7.3*Percent change is based on whole dollars.FY 2013 Proposed <strong>Budget</strong> and <strong>Financial</strong> Plan<strong>Office</strong> <strong>of</strong> <strong>the</strong> Tenant AdvocateB-107
Program DescriptionThe <strong>Office</strong> <strong>of</strong> <strong>the</strong> Tenant Advocate operates through <strong>the</strong> following 6 programs:Legal Representation – implements <strong>the</strong> agency’s statutory duty to represent tenants, at its discretion and as itdetermines to be in <strong>the</strong> public interest, in Federal or District judicial or administrative proceedings.This program contains <strong>the</strong> following 3 activities:■ In-House Legal Representation – provides in-house legal representation in certain “high-impact” cases ifcertain criteria are met, and refers o<strong>the</strong>r clients to pro bono or contracted legal service providers and attorneysor assists <strong>the</strong>m in finding o<strong>the</strong>r representation;■ Scheduling and Enforcement – provides advice and analysis regarding legal rights in response to individualtenant inquiries regarding disputes with <strong>the</strong>ir landlords. Assists tenants in completing and filing tenant petitionsand drafting o<strong>the</strong>r court documents. Provides in-house legal representation based on public interest impact andas resources allow; or provides funding for o<strong>the</strong>r legal service providers; or o<strong>the</strong>rwise assists tenants in findingrepresentation for court and administrative proceedings; and■ Housing Service Center – provides a web-based “Ask <strong>the</strong> Director” forum and responds to Mayoral, Council,inter-agency, and community inquiries about tenant rights and rental housing law.Legal Advocacy Program – provides support to community-based programs that inform tenants regarding <strong>the</strong>irlegislative and regulatory legal protections. It serves as <strong>the</strong> legal expert on all legislation relating to tenant rights,o<strong>the</strong>r affordable housing, tenant, and housing-related laws. The agency tracks legislative and regulatory issues andrecommends appropriate changes.OTA Educational Institute – provides a more formal series <strong>of</strong> educational and outreach forums with educationalmaterial regarding rental housing laws, rules, and policies, especially rights to petition and to form tenantassociations.Emergency Housing – implements <strong>the</strong> agency’s statutory duty to “provide emergency housing and relocationassistance to qualified tenants” in certain situations by:■ Providing financial assistance to temporarily house tenants displaced by fires, floods, or government closures;■ Providing assistance to tenants regarding <strong>the</strong> packing, moving and storing <strong>of</strong> personal possessions;■ Providing first month’s rent, security and/ or utility deposits, and application fees for replacement rentalhousing; and■ Coordinating with o<strong>the</strong>r District agencies and community-based organizations to ensure that displacedtenants receive appropriate services.Case Management Administration and Community Outreach – implements <strong>the</strong> agency’s statutory duty to advisetenants and tenant organizations on filing complaints and petitions, including petitions in response to disputes withlandlords.This program contains <strong>the</strong> following 2 activities:■ Case Management Administration – provides legal and technical assistance to tenants regarding rentalhousing disputes with landlords, including identifying legal issues and <strong>the</strong> tenant’s and <strong>the</strong> landlord’srespective rights and responsibilities, and assisting with follow-up action items, such as completing and filingtenant petitions and monitoring rental housing case hearings; and<strong>Office</strong> <strong>of</strong> <strong>the</strong> Tenant AdvocateB-108FY 2013 Proposed <strong>Budget</strong> and <strong>Financial</strong> Plan
■Community Outreach – provides outreach and educational programs regarding tenant rights and rentalhousing matters and sends “rapid response” letters to tenants affected by certain administrative actions toapprise <strong>the</strong>m <strong>of</strong> <strong>the</strong>ir rights and <strong>of</strong> <strong>the</strong> OTA’s availability to provide fur<strong>the</strong>r assistance.Administrative Services – Provides for administrative support and <strong>the</strong> required tools to achieve operational andprogrammatic results. The program is standard for all agencies using performance-based budgeting. TheAdministrative Services program performs <strong>the</strong> agency management functions for <strong>the</strong> agency.Program Structure ChangeThe <strong>Office</strong> <strong>of</strong> Tenant Advocate has eliminated <strong>the</strong> Housing Assistance Community Service program and addedtwo programs in FY 2013: <strong>the</strong> Emergency Housing program and <strong>the</strong> Case Management Administration andCommunity Outreach program.FY 2013 Proposed <strong>Budget</strong> and <strong>Financial</strong> Plan<strong>Office</strong> <strong>of</strong> <strong>the</strong> Tenant AdvocateB-109
FY 2013 Proposed Operating <strong>Budget</strong> and FTEs, by Program and ActivityTable CQ0-4 contains <strong>the</strong> proposed FY 2013 budget by program and activity compared to <strong>the</strong> FY 2012 approved budget.It also provides <strong>the</strong> FY 2011 actual data.Table CQ0-4(dollars in thousands)Dollars in ThousandsFull-Time EquivalentsChangeChangeActual Approved Proposed from Actual Approved Proposed fromProgram/Activity FY 2011 FY 2012 FY 2013 FY 2012 FY 2011 FY 2012 FY 2013 FY 2012(1000) Administrative Services(1030) Property Management -1 0 0 0 0.0 0.0 0.0 0.0(1040) Information Technology 0 38 17 -21 0.0 0.0 0.0 0.0(1090) Performance Management 387 327 407 80 4.4 3.5 4.0 0.5Subtotal (1000) Administrative Services 386 365 424 59 4.4 3.5 4.0 0.5(2000) Housing Assistance Community Service Program(2010) Housing Assistance Community Service Program 681 561 0 -561 4.9 4.0 0.0 -4.0Subtotal (2000) Housing Assistance Community Service Program 681 561 0 -561 4.9 4.0 0.0 -4.0(3000) Legal Representation(3010) Housing Assistance 503 273 0 -273 3.0 3.0 0.0 -3.0(3015) In-House Legal Representation 0 0 519 519 0.0 0.0 5.0 5.0(3020) Scheduling and Enforcement Unit 0 168 45 -123 0.0 0.0 0.0 0.0(3030) Housing Service Center 0 328 260 -69 0.0 1.0 0.0 -1.0Subtotal (3000) Legal Representation 503 769 824 55 3.0 4.0 5.0 1.0(4000) Legal Advocacy Program(4010) Legal Advocacy Program 186 109 123 14 1.0 1.0 1.0 0.0(4020) Research and Development 0 19 0 -19 0.0 0.0 0.0 0.0Subtotal (4000) Legal Advocacy Program 186 128 123 -5 1.0 1.0 1.0 0.0(5000) OTA Educational Institute(5010) OTA Educational Institute 0 100 106 5 0.0 1.0 1.0 0.0Subtotal (5000) OTA Educational Institute 0 100 106 5 0.0 1.0 1.0 0.0(6000) Emergency Housing(6010) Emergency Housing 0 0 250 250 0.0 0.0 0.0 0.0Subtotal (6000) Emergency Housing 0 0 250 250 0.0 0.0 0.0 0.0(8000) Case Management Admin and Comm Outreach(8010) Case Management Administration 0 0 287 287 0.0 0.0 4.0 4.0(8020) Community Outreach 0 0 50 50 0.0 0.0 0.0 0.0Subtotal (8000) Case Management Admin and Comm Outreach 0 0 337 337 0.0 0.0 4.0 4.0Total Proposed Operating <strong>Budget</strong> 1,755 1,924 2,064 140 13.3 13.5 15.0 1.5(Change is calculated by whole numbers and numbers may not add up due to rounding)Note: For more detailed information regarding <strong>the</strong> proposed funding for <strong>the</strong> activities within this agency’s programs, please see Schedule 30-PBBProgram Summary by Activity in <strong>the</strong> FY 2013 Operating Appendices located on <strong>the</strong> <strong>Office</strong> <strong>of</strong> <strong>the</strong> <strong>Chief</strong> <strong>Financial</strong> <strong>Office</strong>r’s website.<strong>Office</strong> <strong>of</strong> <strong>the</strong> Tenant AdvocateB-110FY 2013 Proposed <strong>Budget</strong> and <strong>Financial</strong> Plan
FY 2013 Proposed <strong>Budget</strong> ChangesThe <strong>Office</strong> <strong>of</strong> <strong>the</strong> Tenant Advocate’s (OTA) proposed FY 2013 gross budget is $2,063,971, which represents a 7.3percent increase over its FY 2012 approved gross budget <strong>of</strong> $1,923,771. The budget is comprised entirely <strong>of</strong> Localfunds.Current Services Funding LevelThe Current Services Funding Level (CSFL) is a Local funds ONLY representation <strong>of</strong> <strong>the</strong> true cost <strong>of</strong> operatingDistrict agencies, before consideration <strong>of</strong> policy decisions. The CSFL reflects changes from <strong>the</strong> FY 2012 approvedbudget across multiple programs, and it estimates how much it would cost an agency to continue its currentprograms and operations into <strong>the</strong> following fiscal year. The initial adjustments in <strong>the</strong> budget proposal representchanges that should be compared to <strong>the</strong> FY 2013 CSFL budget and not necessarily changes made to <strong>the</strong> FY 2012Local funds budget. The FY 2013 CSFL adjustments to <strong>the</strong> FY 2012 Local funds budget are described in table 5<strong>of</strong> this agency's budget chapter. Please see <strong>the</strong> CSFL Development section within Volume 1: Executive Summaryfor more information regarding <strong>the</strong> methodology used and components that comprise <strong>the</strong> CSFL.OTA’s FY 2013 CSFL budget is $1,955,461, which represents a $31,690, or 1.6 percent, increase over <strong>the</strong> FY2012 approved Local funds budget <strong>of</strong> $1,923,771.Initial Adjusted <strong>Budget</strong>Cost Increase: The budget proposal allows <strong>the</strong> <strong>Office</strong> <strong>of</strong> <strong>the</strong> Tenant Advocate to continue to provide services t<strong>of</strong>amilies that have been displaced from <strong>the</strong>ir homes. The agency will increase <strong>the</strong> total FTE count by 0.5 andpersonal services costs by $95,187. This increase allows for planned step increases and associated fringe benefitcosts. Additionally, <strong>the</strong> OTA is projecting increases in O<strong>the</strong>r Services and Charges <strong>of</strong> $79,508 and Equipmentpurchases <strong>of</strong> $4,950.Cost Decrease: A reduction <strong>of</strong> $133,272 in Contractual Services will not affect <strong>the</strong> level <strong>of</strong> service provided andwill partially <strong>of</strong>fset <strong>the</strong> o<strong>the</strong>r increases proposed by <strong>the</strong> agency. OTA will realize additional savings <strong>of</strong> $38,444 in<strong>the</strong> Telecom assessment from <strong>the</strong> <strong>Office</strong> <strong>of</strong> Finance and Resource Management, and a savings <strong>of</strong> $7,929 byreducing Supplies and Subsidies and Transfers.Additionally Adjusted <strong>Budget</strong>Technical Adjustment: Adjustment <strong>of</strong> Fringe Benefits to restore <strong>the</strong> District Government contribution for employeehealth insurance from 72 percent, implemented in <strong>the</strong> FY 2011 budget, to 75 percent in FY 2013, resulting inan increase <strong>of</strong> $5,681 in Local funds.Policy InitiativeCost Increase: The Legal Representation program will increase Local funding by $102,829 and 1.0 FTE for <strong>the</strong>salary and fringe benefits for an Attorney Advisor.FY 2013 Proposed <strong>Budget</strong> and <strong>Financial</strong> Plan<strong>Office</strong> <strong>of</strong> <strong>the</strong> Tenant AdvocateB-111
FY 2012 Approved <strong>Budget</strong> to FY 2013 Proposed <strong>Budget</strong>, by Revenue TypeTable CQ0-5 itemizes <strong>the</strong> changes by revenue type between <strong>the</strong> FY 2012 approved budget and <strong>the</strong> FY 2013 proposedbudget.Table CQ0-5(dollars in thousands)PROGRAM BUDGET FTELOCAL FUNDS: FY 2012 Approved <strong>Budget</strong> and FTE 1,924 13.5Fringe Benefit Rate Adjustment Multiple Programs 12 0.0Consumer Price Index Multiple Programs 15 0.0Personal Services Growth Factor Multiple Programs 5 0.0FY 2013 Current Services Funding Level <strong>Budget</strong> (CSFL): 1,955 13.5Cost Increase: Align personal services with projected costs Multiple Programs 95 0.5Cost Increase: O<strong>the</strong>r Services and Charges Multiple Programs 80 0.0Cost Increase: Equipment purchases OTA Educational Institute 5 0.0Cost Decrease: Contractual Services Multiple Programs -133 0.0Cost Decrease: Telecom Administrative Services -38 0.0Cost Decrease: Supplies, Subsidies and Transfers Multiple Programs -8 0.0FY 2013 Initial Adjusted <strong>Budget</strong> 1,955 14.0Technical Adjustment: Health insurance contribution Multiple Programs 6 0.0FY 2013 Additionally Adjusted <strong>Budget</strong>: 1,961 14.0FY 2013 Policy InitiativeCost Increase: Attorney Advisor position Legal Representation 103 1.0LOCAL FUNDS: FY 2013 Proposed <strong>Budget</strong> and FTE 2,064 15.0Gross for CQ0 - <strong>Office</strong> <strong>of</strong> <strong>the</strong> Tenant Advocate 2,064 15.0(Change is calculated by whole numbers and numbers may not add up due to rounding)<strong>Office</strong> <strong>of</strong> <strong>the</strong> Tenant AdvocateB-112FY 2013 Proposed <strong>Budget</strong> and <strong>Financial</strong> Plan
<strong>Agency</strong> Performance PlanThe agency’s performance plan has <strong>the</strong> following objectives for FY 2013:Objective 1: Create and improve channels <strong>of</strong> communication between <strong>the</strong> agency and <strong>the</strong> tenant community.Objective 2: Inform <strong>the</strong> tenant communities about tenant rights and related issues.Objective 3: Provide financial assistance to cover certain emergency housing and tenant relocation expenses under<strong>the</strong> OTA’s Emergency Housing Assistance Program.<strong>Agency</strong> Performance MeasuresFY 2010 FY 2011 FY 2011 FY 2012 FY 2013 FY 2014Measure 1 Actual Target Actual Projection Projection ProjectionPercentage <strong>of</strong> tenant intake cases resolved 100% 85% 100% 87% 89% 89%Not Not Not NotNumber <strong>of</strong> cases initiated 2,261 Available 2,615 Available Available AvailableNumber <strong>of</strong> rental housing case abstracts to beincluded in database 100 75 118 150 180 210Percentage <strong>of</strong> identified tenant associations to be 53% 85%represented in tenant summit. (8/15) 50% (34/40) 50% 50% 50%Percentage <strong>of</strong> all emergency housing cases resolved 100% 85% 100% 85% 85% 85%Percentage <strong>of</strong> households eligible for housingassistance for whom OTA made emergencyhousing available within 24 hours 100% 90% 100% 90% 90% 90%Not Not Not NotNumber <strong>of</strong> Emergency Housing cases 95 Available 111 Available Available Available1 In addition to <strong>the</strong> KIPs listed, OTA will provide year-end data on <strong>the</strong> outcomes <strong>of</strong> cases referred to legal services.FY 2013 Proposed <strong>Budget</strong> and <strong>Financial</strong> Plan<strong>Office</strong> <strong>of</strong> <strong>the</strong> Tenant AdvocateB-113
D.C. Commission on <strong>the</strong> Arts andHumanitieswww.dcarts.dc.govTelephone: 202-724-5613(BX0)% ChangeFY 2011 FY 2012 FY 2013 fromDescription Actual Approved Proposed FY 2012Operating <strong>Budget</strong> $5,694,956 $4,798,246 $14,435,142 200.8FTEs 12.6 16.0 18.0 12.5The mission <strong>of</strong> <strong>the</strong> D.C. Commission on <strong>the</strong> Arts and Humanities(DCCAH) is to provide grants, programs, and educational activitiesthat encourage diverse artistic expressions and learning opportunitiesso that all District <strong>of</strong> Columbia residents and visitors can experience<strong>the</strong> rich culture <strong>of</strong> our city.Summary <strong>of</strong> ServicesDCCAH <strong>of</strong>fers a wide range <strong>of</strong> grant programs to support practicing artists and arts organizations in <strong>the</strong> District<strong>of</strong> Columbia. In partnership with both national and community-based organizations, DCCAH promotes excellencein <strong>the</strong> arts by initiating and supporting programs and activities that reflect <strong>the</strong> diversity <strong>of</strong> art forms and populationin <strong>the</strong> District.The agency’s FY 2013 proposed budget is presented in <strong>the</strong> following tables:FY 2013 Proposed <strong>Budget</strong> and <strong>Financial</strong> PlanD.C. Commission on <strong>the</strong> Arts and HumanitiesB-115
FY 2013 Proposed Gross Funds Operating <strong>Budget</strong>, by Revenue TypeTable BX0-1 contains <strong>the</strong> proposed FY 2013 agency budget compared to <strong>the</strong> FY 2012 approved budget. It alsoprovides FY 2010 and FY 2011 actual expenditures.Table BX0-1(dollars in thousands)ChangeActual Actual Approved Proposed from PercentAppropriated Fund FY 2010 FY 2011 FY 2012 FY 2013 FY 2012 Change*General FundLocal Funds 5,160 4,182 3,920 11,090 7,170 182.9Special Purpose Revenue Funds 51 542 100 100 0 0.0Total for General Fund 5,211 4,724 4,020 11,190 7,170 178.4Federal ResourcesFederal Payments 0 0 0 2,500 2,500 N/AFederal Grant Funds 1,028 816 779 746 -33 -4.2Total for Federal Resources 1,028 816 779 3,246 2,467 316.8Intra-District FundsIntra-District Funds 289 155 0 0 0 N/ATotal for Intra-District Funds 289 155 0 0 0 N/AGross Funds 6,527 5,695 4,798 14,435 9,637 200.8*Percent change is based on whole dollars.Note: If applicable, for a breakdown <strong>of</strong> each Grant (Federal and Private), Special Purpose Revenue type and Intra-District agreement,please refer to Schedule 80 <strong>Agency</strong> Summary by Revenue Source in <strong>the</strong> FY 2013 Operating Appendices located on <strong>the</strong> <strong>Office</strong> <strong>of</strong> <strong>the</strong><strong>Chief</strong> <strong>Financial</strong> <strong>Office</strong>r’s website.D.C. Commission on <strong>the</strong> Arts and HumanitiesB-116FY 2013 Proposed <strong>Budget</strong> and <strong>Financial</strong> Plan
FY 2013 Proposed Full-Time Equivalents, by Revenue TypeTable BX0-2 contains <strong>the</strong> proposed FY 2013 FTE level compared to <strong>the</strong> FY 2012 approved FTE level by revenuetype. It also provides FY 2010 and FY 2011 actual data.Table BX0-2ChangeActual Actual Approved Proposed from PercentAppropriated Fund FY 2010 FY 2011 FY 2012 FY 2013 FY 2012 ChangeGeneral FundLocal Funds 4.4 3.6 8.0 10.0 2.0 25.0Total for General Fund 4.4 3.6 8.0 10.0 2.0 25.0Federal ResourcesFederal Grant Funds 8.5 9.0 8.0 8.0 0.0 0.0Total for Federal Resources 8.5 9.0 8.0 8.0 0.0 0.0Total Proposed FTEs 12.9 12.6 16.0 18.0 2.0 12.5FY 2013 Proposed Operating <strong>Budget</strong>, by Comptroller Source GroupTable BX0-3 contains <strong>the</strong> proposed FY 2013 budget at <strong>the</strong> Comptroller Source Group (object class) level comparedto <strong>the</strong> FY 2012 approved budget. It also provides FY 2010 and FY 2011 actual expenditures.Table BX0-3(dollars in thousands)ChangeActual Actual Approved Proposed from PercentComptroller Source Group FY 2010 FY 2011 FY 2012 FY 2013 FY 2012 Change*11 - Regular Pay - Continuing Full Time 482 207 518 534 16 3.112 - Regular Pay - O<strong>the</strong>r 255 439 470 613 144 30.613 - Additional Gross Pay 12 53 9 0 -9 -100.014 - Fringe Benefits - Current Personnel 135 135 211 266 55 26.2Subtotal Personal Services (PS) 883 833 1,207 1,412 206 17.020 - Supplies and Materials 18 7 7 7 0 0.031 - Telephone, Telegraph, Telegram, Etc. 25 1 0 2 2 N/A32 - Rentals - Land and Structures 213 0 0 0 0 N/A35 - Occupancy Fixed Costs 2 0 0 0 0 N/A40 - O<strong>the</strong>r Services and Charges 322 119 100 110 10 10.341 - Contractual Services - O<strong>the</strong>r 15 331 150 305 155 103.150 - Subsidies and Transfers 5,032 4,392 3,328 12,592 9,265 278.470 - Equipment and Equipment Rental 17 11 7 7 0 0.0Subtotal Nonpersonal Services (NPS) 5,644 4,862 3,592 13,023 9,431 262.6Gross Funds 6,527 5,695 4,798 14,435 9,637 200.8*Percent change is based on whole dollars.FY 2012 Proposed <strong>Budget</strong> and <strong>Financial</strong> PlanD.C. Commission on <strong>the</strong> Arts and HumanitiesB-117
Program DescriptionThe D.C. Commission on <strong>the</strong> Arts and Humanities operates through <strong>the</strong> following 5 programs:Arts Building Communities – provides grants, performances, exhibitions, and o<strong>the</strong>r services to individual artists,arts organizations, and neighborhood and community groups so that <strong>the</strong>y can express, experience, and access <strong>the</strong>rich cultural diversity <strong>of</strong> <strong>the</strong> District. A particular emphasis is placed on traditionally underserved populations,including first-time applicants, seniors, young emerging artists, experimental artists, folk and traditional artists, andartists in East <strong>of</strong> <strong>the</strong> River neighborhoods.D.C. Creates Public Art – provides <strong>the</strong> placement <strong>of</strong> high-quality art installations and administrative supportservices for <strong>the</strong> public so that <strong>the</strong>y can benefit from an enhanced visual and cultural environment, with aparticular emphasis on geographically challenged areas <strong>of</strong> <strong>the</strong> city. This program places artwork within <strong>the</strong> Metrotransit system and <strong>the</strong> numerous murals and sculptures in and around <strong>the</strong> city’s neighborhoods. The goals are promotingeconomic development and building sustainable neighborhoods.This program contains <strong>the</strong> following 2 activities:■ Neighborhood and Public Art – Projects are identified through <strong>the</strong> culmination <strong>of</strong> intensive public realm planningprocesses in partnership with neighborhood advisory groups, Main Street programs, o<strong>the</strong>r Districtgovernment agencies, and private developers. Large-scale works are permanently installed in prominent publiclocations throughout all eight wards <strong>of</strong> <strong>the</strong> District. The program is a citywide benefit because it producestangible art installations for display in public spaces. The art is inventoried, maintained and owned by <strong>the</strong>District. The program also provides partial financial support for artists and organizations to produce public artin public space that <strong>the</strong> artist or arts organization owns, manages, and maintains; and■ Lincoln Theatre - provides for <strong>the</strong> maintenance <strong>of</strong> <strong>the</strong> Lincoln Theatre and associated projects.Arts Learning and Outreach – provides grants, educational activities, and outreach services for youth, young adults,and <strong>the</strong> general public so that <strong>the</strong>y can gain a deeper appreciation for <strong>the</strong> arts, and to enhance <strong>the</strong> overall quality<strong>of</strong> <strong>the</strong>ir lives. Specific focus is on providing quality arts education and training experiences to District youth fromthose in pre-kindergarten through 21 years <strong>of</strong> age, as well as grants and cultural events to <strong>the</strong> general public so that<strong>the</strong>y can access and participate in educational opportunities in <strong>the</strong> arts.This program contains <strong>the</strong> following 2 activities:■ Arts Learning for Youth – provides grants, program consulting, and advocacy services to school and communitypartners so that <strong>the</strong>y can deliver quality and age-appropriate arts learning opportunities both in and out <strong>of</strong>school. The goal is to ensure a quality arts experience for District youth from pre-kindergarten through 21 years<strong>of</strong> age; and■ Lifelong Learning – provides grants and cultural events to <strong>the</strong> public so that <strong>the</strong>y can access and participate ineducational opportunities in <strong>the</strong> arts. The goal is long-term development <strong>of</strong> interest and education in <strong>the</strong> artsto <strong>the</strong> broader community.Administration – provides technical assistance and legislative services to <strong>the</strong> Commission so that it can providefunding opportunities to District artists and arts organizations.<strong>Agency</strong> Management Program – provides for administrative support and <strong>the</strong> required tools to achieve operationaland programmatic results. This program is standard for all agencies using performance-based budgeting.Program Structure ChangeThe D.C. Commission on <strong>the</strong> Arts and Humanities has no program structure changes in <strong>the</strong> FY 2013 proposedbudget.D.C. Commission on <strong>the</strong> Arts and HumanitiesB-118FY 2013 Proposed <strong>Budget</strong> and <strong>Financial</strong> Plan
FY 2013 Proposed Operating <strong>Budget</strong> and FTEs, by Program and ActivityTable BX0-4 contains <strong>the</strong> proposed FY 2013 budget by program and activity compared to <strong>the</strong> FY 2012 approvedbudget. It also provides <strong>the</strong> FY 2011 actual data.Table BX0-4(dollars in thousands)Dollars in ThousandsFull-Time EquivalentsChangeChangeActual Approved Proposed from Actual Approved Proposed fromProgram/Activity FY 2011 FY 2012 FY 2013 FY 2012 FY 2011 FY 2012 FY 2013 FY 2012(1000) <strong>Agency</strong> Management Program(1010) Personnel 25 27 26 -1 0.2 0.2 0.2 0.0(1015) Training and Employee Development 21 29 27 -2 0.1 0.2 0.2 0.0(1020) Contracting and Procurement 12 12 33 21 0.1 0.1 0.4 0.2(1030) Property Management 24 25 33 8 0.1 0.2 0.3 0.1(1040) Information Technology 33 4 8 4 0.0 0.0 0.0 0.0(1050) <strong>Financial</strong> Services 12 19 47 28 0.1 0.1 0.5 0.4(1055) Risk Management 9 17 19 2 0.1 0.1 0.2 0.0(1080) Communications 34 50 46 -4 0.2 0.4 0.4 0.0(1085) Customer Service 13 21 19 -2 0.1 0.2 0.2 0.0(1090) Performance Management 62 92 84 -9 0.4 0.6 0.6 0.0Subtotal (1000) <strong>Agency</strong> Management Program 245 297 343 45 1.5 2.0 2.8 0.8(2000) Arts Building Communities(2010) Arts Building Communities 4,109 2,027 8,221 6,193 6.0 6.4 5.5 -0.9Subtotal (2000) Arts Building Communities 4,109 2,027 8,221 6,193 6.0 6.4 5.5 -0.9(3000) D.C. Creates Public Art(3010) Neighborhood and Public Art 576 206 199 -8 0.0 3.0 3.0 0.0(3030) Lincoln Theatre 0 0 350 350 0.0 0.0 1.0 1.0Subtotal (3000) D.C. Creates Public Art 576 206 549 343 0.0 3.0 4.0 1.0(4000) Arts Learning and Outreach(4010) Arts Learning for Youth 500 2,091 5,043 2,952 1.0 2.0 1.5 -0.5(4020) Lifelong Learning 234 141 244 103 3.8 2.1 3.7 1.6Subtotal (4000) Arts Learning and Outreach 735 2,232 5,286 3,055 4.8 4.1 5.2 1.1(5000) Administration(5010) Legislative and Grants Management 30 36 37 1 0.3 0.4 0.4 0.0Subtotal (5000) Administration 30 36 37 1 0.3 0.4 0.4 0.0Total Proposed Operating <strong>Budget</strong> 5,695 4,798 14,435 9,637 12.6 16.0 18.0 2.0(Change is calculated by whole numbers and numbers may not add up due to rounding)Note: For more detailed information regarding <strong>the</strong> proposed funding for <strong>the</strong> activities within this agency’s programs, please see Schedule 30-PBBProgram Summary by Activity in <strong>the</strong> FY 2013 Operating Appendices located on <strong>the</strong> <strong>Office</strong> <strong>of</strong> <strong>the</strong> <strong>Chief</strong> <strong>Financial</strong> <strong>Office</strong>r’s website.FY 2013 Proposed <strong>Budget</strong> and <strong>Financial</strong> PlanD.C. Commission on <strong>the</strong> Arts and HumanitiesB-119
FY 2013 Proposed <strong>Budget</strong> ChangesD.C. Commission on <strong>the</strong> Arts and Humanities’ (DCCAH) proposed FY 2013 gross budget is $14,435,142, whichrepresents a 200.8 percent increase over its FY 2012 approved gross budget <strong>of</strong> $4,798,246. The budget is comprised<strong>of</strong> $11,089,642 <strong>of</strong> Local funds, $100,000 in Special Purpose Revenue funds, $745,500 <strong>of</strong> Federal Grantfunds, and $2,500,000 <strong>of</strong> Federal Payments.Current Services Funding LevelThe Current Services Funding Level (CSFL) is a Local funds ONLY representation <strong>of</strong> <strong>the</strong> true cost <strong>of</strong> operatingDistrict agencies, before consideration <strong>of</strong> policy decisions. The CSFL reflects changes from <strong>the</strong> FY 2012 approvedbudget across multiple programs, and it estimates how much it would cost an agency to continue its currentprograms and operations into <strong>the</strong> following fiscal year. The initial adjustments in <strong>the</strong> budget proposal representchanges that should be compared to <strong>the</strong> FY 2013 CSFL budget and not necessarily changes made to <strong>the</strong> FY 2012Local funds budget. The FY 2013 CSFL adjustments to <strong>the</strong> FY 2012 Local funds budget are described in table 5<strong>of</strong> this agency's budget chapter. Please see <strong>the</strong> CSFL Development section within Volume 1: Executive Summaryfor more information regarding <strong>the</strong> methodology used and components that comprise <strong>the</strong> CSFL.DCCAH’s FY 2013 CSFL budget is $3,936,312, which represents a $16,656, or 0.4 percent, increase over <strong>the</strong>FY 2012 approved Local funds budget <strong>of</strong> $3,919,657.Initial Adjusted <strong>Budget</strong>Cost Increase: Local funds – DCCAH increased Regular Pay – O<strong>the</strong>r by $131,530 and 2.0 FTEs and FringeBenefits by $7,635 for projected step increases. In addition, <strong>the</strong>re were increases in nonpersonal services: $6,869 inO<strong>the</strong>r Services and Charges and $1,500 in Telecom. Federal Grant funds – Regular Pay – O<strong>the</strong>r was increased by$11,191, Fringe Benefits by $6,173, and O<strong>the</strong>r Services and Charges by $1,500 for out-<strong>of</strong>-city travel. FederalPayments – CAH’s budget was increased by $2,500,000 to align it with <strong>the</strong> President’s 2013 budget submission toCongress.Cost Decrease: Local funds – Regular Pay – Continuing Full Time was decreased by $97,921 and 1.0 FTE acrossmultiple programs. In addition, Contractual Services were reduced by $40,562, Additional Gross Pay by $8,700,Supplies and Materials by $140, Equipment and Equipment Rental by $140, and Subsidies and Transfers by $70.Federal Grant funds – Subsidies and Transfers were reduced by $33,536 for Grants and Gratuities, ContractualServices by $10,000, and Regular Pay – Continuing Full Time by $8,418.Additionally Adjusted <strong>Budget</strong>Technical Adjustment: Adjustment <strong>of</strong> Fringe Benefits to restore <strong>the</strong> District Government contribution for employeehealth insurance from 72 percent, implemented in <strong>the</strong> FY 2011 budget, to 75 percent in FY 2013, resulting inan increase <strong>of</strong> $3,114 to DCCAH’s Local funds and $1,613 to Federal Grant funds.Additional Adjustments: Federal Grant funds – Subsidies and Transfers’ Grants and Gratuities were reduced by$1,613 to <strong>of</strong>fset <strong>the</strong> cost <strong>of</strong> reversing <strong>the</strong> health insurance contribution.Policy InitiativeEnhance: Local funds – <strong>the</strong> Arts Building Communities and Arts Learning and Outreach programs were increased$6,800,000 to support local art programs, which is designated as one–time. Contractual Services were alsoincreased $202,400 for management <strong>of</strong> <strong>the</strong> Lincoln Theatre. Regular Pay – Continuing Full Time was increasedby $147,816 and 1.0 FTE, for an Executive Director to manage <strong>the</strong> Lincoln Theatre.D.C. Commission on <strong>the</strong> Arts and HumanitiesB-120FY 2013 Proposed <strong>Budget</strong> and <strong>Financial</strong> Plan
FY 2012 Approved <strong>Budget</strong> to FY 2013 Proposed <strong>Budget</strong>, by Revenue TypeTable BX0-5 itemizes <strong>the</strong> changes by revenue type between <strong>the</strong> FY 2012 approved budget and <strong>the</strong> FY 2013 proposedbudget.Table BX0-5(dollars in thousands)PROGRAM BUDGET FTELOCAL FUNDS: FY 2012 Approved <strong>Budget</strong> and FTE 3,920 8.0Fringe Benefit Rate Adjustment Multiple Programs 9 0.0Consumer Price Index Multiple Programs 5 0.0Personal Services Growth Factor Multiple Programs 3 0.0FY 2013 Current Services Funding Level <strong>Budget</strong> (CSFL) 3,936 8.0Cost Increase: Increase Regular Pay - O<strong>the</strong>r Multiple Programs 132 2.0Cost Increase: Align Fringe Benefits with projections Multiple Programs 8 0.0Cost Increase: Increase O<strong>the</strong>r Services and Charges Multiple Programs 7 0.0Cost Increase: Increase Telephone, Telegraph, Telegram, etc. Arts Building Communities 2 0.0Cost Decrease: Reduce Regular Pay - Continuing Full Time Multiple Programs -98 -1.0Cost Decrease: Reduce Contractual Services - O<strong>the</strong>r Arts Building Communities -41 0.0Cost Decrease: Reduce Additional Gross Pay Arts Building Communities -9 0.0Cost Decrease: Reduce Supplies and Materials, Equipment Multiple Programs 0 0.0and Equipment Rental, and Subsidies and Transfers (less than $500)FY 2013 Initial Adjusted <strong>Budget</strong> 3,936 9.0Technical Adjustment: Health insurance contribution Multiple Programs 3 0.0FY 2013 Additionally Adjusted <strong>Budget</strong> 3,939 9.0FY 2013 Policy InitiativesEnhance: Increase funding to support local art programs- (one-time costs) Multiple Programs 6,000 0.0Enhance: Additional funding to support local art programs- (one-time costs) Arts Building Communities 800 0.0Enhance: Contractual Services for Lincoln Theatre D.C. Creates Public Art 202 0.0Enhance: New FTE to manage <strong>the</strong> Lincoln Theatre D.C. Creates Public Art 148 1.0LOCAL FUNDS: FY 2013 Proposed <strong>Budget</strong> and FTE 11,090 10.0FEDERAL PAYMENTS: FY 2012 Approved <strong>Budget</strong> and FTE 0 0.0Cost Increase: Align CAH's budget with <strong>the</strong> President's 2013 budget Arts Building Communities 2,500 0.0submission to CongressFY 2013 Initial Adjusted <strong>Budget</strong> 2,500 0.0FEDERAL PAYMENTS: FY 2013 Proposed <strong>Budget</strong> and FTE 2,500 0.0(Continued on next page)FY 2013 Proposed <strong>Budget</strong> and <strong>Financial</strong> PlanD.C. Commission on <strong>the</strong> Arts and HumanitiesB-121
FY 2012 Approved <strong>Budget</strong> to FY 2013 Proposed <strong>Budget</strong>, by Revenue Type (Cont.)Table BX0-5 itemizes <strong>the</strong> changes by revenue type between <strong>the</strong> FY 2012 approved budget and <strong>the</strong> FY 2013 proposedbudget.Table BX0-5(dollars in thousands)PROGRAM BUDGET FTEFEDERAL GRANT FUNDS: FY 2012 Approved <strong>Budget</strong> and FTE 779 8.0Cost Increase: Increase Regular Pay - O<strong>the</strong>r Multiple Programs 11 0.0Cost Increase: Align Fringe Benefits with projected costs Multiple Programs 6 0.0Cost Increase: Increase O<strong>the</strong>r Services and Charges Arts Building Communities 2 0.0Cost Decrease: Reduce Subsidies and Transfers Multiple Programs -34 0.0Cost Decrease: Reduce Contractual Services - O<strong>the</strong>r Arts Learning and Outreach -10 0.0Cost Decrease: Reduce Regular Pay - Continuing Full Time Multiple Programs -8 0.0FY 2013 Initial Adjusted <strong>Budget</strong> 746 8.0Additional Adjustments: Reduce Subsidies and Transfers Arts Building Communities -2 0.0to <strong>of</strong>fset Health insurance contributionTechnical Adjustment: Health insurance contribution Multiple Programs 2 0.0FY 2013 Additionally Adjusted <strong>Budget</strong> 746 8.0FEDERAL GRANT FUNDS: FY 2013 Proposed <strong>Budget</strong> and FTE 746 8.0SPECIAL PURPOSE REVENUE FUNDS: FY 2012 Approved <strong>Budget</strong> and FTE 100 0.0No Changes 0 0.0FY 2013 Initial Adjusted <strong>Budget</strong> 100 0.0SPECIAL PURPOSE REVENUE FUNDS: FY 2013 Proposed <strong>Budget</strong> and FTE 100 0.0Gross for BX0 - Commission on Arts and Humanities 14,435 18.0(Change is calculated by whole numbers and numbers may not add up due to rounding)D.C. Commission on <strong>the</strong> Arts and HumanitiesB-122FY 2013 Proposed <strong>Budget</strong> and <strong>Financial</strong> Plan
<strong>Agency</strong> Performance PlansThe agency’s performance plan has <strong>the</strong> following objectives for FY 2013:Objective 1: Provide access to <strong>the</strong> arts for all District residents.Objective 2: Promote lifelong learning and interest in <strong>the</strong> arts and arts education for all ages.Objective 3: Enhance communities through public and private engagement in <strong>the</strong> arts.<strong>Agency</strong> Performance MeasuresFY 2010 FY 2011 FY 2011 FY 2012 FY 2013 FY 2014Measure Actual Target Actual Projection Projection ProjectionPercentage <strong>of</strong> grants to new applicants 1 41.70% 25% 7.43% 4% 5% 6%Per capita spending on arts 2 $11.11 $10.00 $8.55 $8.00 $8.50 $9.00Number <strong>of</strong> D.C. schools, DPR Centers, and communitycenters benefiting from DCCAH grants. 3 112 100 141 120 130 140Dollars invested from non-District governmentsources per $1 investment by DCCAH. 4 $10.31 $10.00 $6.74 $6.25 $6.75 $7.25Percentage <strong>of</strong> grant payments processed within six toeight weeks. 94.29% 97% 98.63% 97% 97% 97%Percentage <strong>of</strong> scheduled monitoring reports asdefined in agency monitoring plan completed Not 65% 90% 100% 100% 100%for each grant award. 5AvailablePerformance Plan Endnotes:1. New applicants are those who have not received funding from DCCAH within <strong>the</strong> prior five years.2. NASAA uses <strong>the</strong> most recent population estimates from <strong>the</strong> U.S. Census Bureau and <strong>the</strong> total dollar amount appropriated to anagency by its state legislature.3. This measure now reflects a hard number, ra<strong>the</strong>r than a percentage, because <strong>of</strong> constantly changing data on <strong>the</strong> number <strong>of</strong>active schools and recreation centers in <strong>the</strong> District.4. This is <strong>the</strong> ratio <strong>of</strong> funds leveraged for DCCAH-funded projects to funds invested directly by DCCAH.5. Pursuant to Section 11.4 <strong>of</strong> <strong>the</strong> Grants Manual and Source Book all District agencies must complete monitoring reports. AllDistrict agencies should be in compliance with this standard. The standard is 100 percent.FY 2013 Proposed <strong>Budget</strong> and <strong>Financial</strong> PlanD.C. Commission on <strong>the</strong> Arts and HumanitiesB-123
Alcoholic Beverage RegulationAdministration(LQ0)www.abra.dc.govTelephone: 202-442-4423% ChangeFY 2011 FY 2012 FY 2013 fromDescription Actual Approved Proposed FY 2012Operating <strong>Budget</strong> $4,637,390 $5,964,010 $6,834,924 14.6FTEs 41.4 47.0 49.0 4.3The mission <strong>of</strong> <strong>the</strong> Alcoholic Beverage Regulation Administration(ABRA) is to support <strong>the</strong> public’s health, safety, and welfare through<strong>the</strong> control and regulation <strong>of</strong> <strong>the</strong> sale and distribution <strong>of</strong> alcoholic beverages.Summary <strong>of</strong> ServicesABRA conducts licensing, training, adjudication, and community outreach and enforcement efforts to servelicensees, law enforcement agencies, Advisory Neighborhood Commissions (ANCs), civic associations, and <strong>the</strong>general community so that <strong>the</strong>y understand and adhere to all District laws, regulations, and ABRA policies andprocedures.The agency’s FY 2013 proposed budget is presented in <strong>the</strong> following tables:FY 2013 Proposed <strong>Budget</strong> and <strong>Financial</strong> PlanAlcoholic Beverage Regulation AdministrationB-125
FY 2013 Proposed Gross Funds Operating <strong>Budget</strong>, by Revenue TypeTable LQ0-1 contains <strong>the</strong> proposed FY 2013 agency budget compared to <strong>the</strong> FY 2012 approved budget. It alsoprovides FY 2010 and FY 2011 actual expenditures.Table LQ0-1(dollars in thousands)ChangeActual Actual Approved Proposed from PercentAppropriated Fund FY 2010 FY 2011 FY 2012 FY 2013 FY 2012 Change*General FundLocal Funds 400 0 279 0 -279 -100.0Dedicated Taxes 0 0 460 460 0 0.0Special Purpose Revenue Funds 4,851 4,526 5,225 6,375 1,150 22.0Total for General Fund 5,251 4,526 5,964 6,835 871 14.6Intra-District FundsIntra-District Funds 117 112 0 0 0 N/ATotal for Intra-District Funds 117 112 0 0 0 N/AGross Funds 5,368 4,637 5,964 6,835 871 14.6*Percent change is based on whole dollars.Note: If applicable, for a breakdown <strong>of</strong> each Grant (Federal and Private), Special Purpose Revenue type and Intra-District agreement,please refer to Schedule 80 <strong>Agency</strong> Summary by Revenue Source in <strong>the</strong> FY 2013 Operating Appendices located on <strong>the</strong> <strong>Office</strong> <strong>of</strong> <strong>the</strong><strong>Chief</strong> <strong>Financial</strong> <strong>Office</strong>r’s website.FY 2013 Proposed Full-Time Equivalents, by Revenue TypeTable LQ0-2 contains <strong>the</strong> proposed FY 2013 FTE level compared to <strong>the</strong> FY 2012 approved FTE level by revenuetype. It also provides FY 2010 and FY 2011 actual data.Table LQ0-2ChangeActual Actual Approved Proposed from PercentAppropriated Fund FY 2010 FY 2011 FY 2012 FY 2013 FY 2012 ChangeGeneral FundSpecial Purpose Revenue Funds 43.4 41.4 47.0 49.0 2.0 4.3Total for General Fund 43.4 41.4 47.0 49.0 2.0 4.3Total Proposed FTEs 43.4 41.4 47.0 49.0 2.0 4.3Alcoholic Beverage Regulation AdministrationB-126FY 2013 Proposed <strong>Budget</strong> and <strong>Financial</strong> Plan
FY 2013 Proposed Operating <strong>Budget</strong>, by Comptroller Source GroupTable LQ0-3 contains <strong>the</strong> proposed FY 2013 budget at <strong>the</strong> Comptroller Source Group (object class) level comparedto <strong>the</strong> FY 2012 approved budget. It also provides FY 2010 and FY 2011 actual expenditures.Table LQ0-3(dollars in thousands)ChangeActual Actual Approved Proposed from PercentComptroller Source Group FY 2010 FY 2011 FY 2012 FY 2013 FY 2012 Change*11 - Regular Pay - Continuing Full Time 1,713 1,748 1,842 2,348 506 27.412 - Regular Pay - O<strong>the</strong>r 971 784 1,278 1,043 -235 -18.413 - Additional Gross Pay 55 65 0 0 0 N/A14 - Fringe Benefits - Current Personnel 519 522 685 771 86 12.515 - Overtime Pay 147 100 66 147 81 122.7Subtotal Personal Services (PS) 3,404 3,218 3,871 4,309 437 11.320 - Supplies and Materials 74 58 76 88 12 15.830 - Energy, Comm. and Building Rentals 0 110 91 105 13 14.831 - Telephone, Telegraph, Telegram, Etc. 12 56 33 74 41 127.032 - Rentals - Land and Structures 83 0 0 0 0 N/A34 - Security Services 0 116 116 117 2 1.435 - Occupancy Fixed Costs 0 108 112 187 75 67.340 - O<strong>the</strong>r Services and Charges 246 237 486 530 44 9.141 - Contractual Services - O<strong>the</strong>r 243 185 135 168 32 24.150 - Subsidies and Transfers 1,244 536 1,000 1,152 152 15.270 - Equipment and Equipment Rental 62 14 45 106 61 136.0Subtotal Nonpersonal Services (NPS) 1,964 1,419 2,093 2,526 434 20.7Gross Funds 5,368 4,637 5,964 6,835 871 14.6*Percent change is based on whole dollars.FY 2013 Proposed <strong>Budget</strong> and <strong>Financial</strong> PlanAlcoholic Beverage Regulation AdministrationB-127
Program DescriptionThe Alcoholic Beverage Regulation Administration operates through <strong>the</strong> following 5 programs:Licensing - issues new and renewal licenses to liquor stores, grocery stores, restaurants, hotels, nightclubs, and o<strong>the</strong>restablishments that manufacture, distribute, sell, or serve alcoholic beverages in <strong>the</strong> District <strong>of</strong> Columbia, and workswith Records Management to keep accurate and accessible paper and data records <strong>of</strong> all licensing programactivities. This program provides customer services directly to <strong>the</strong> general public, <strong>the</strong> business community, ANCs,and community groups and associations.Investigations - conducts regulatory and voluntary agreement compliance inspections, underage compliancechecks, and joint investigations as needed with <strong>the</strong> Metropolitan Police Department, <strong>the</strong> Fire and EmergencyMedical Services Department, <strong>the</strong> <strong>Office</strong> <strong>of</strong> Tax and Revenue, <strong>the</strong> Department <strong>of</strong> Consumer and RegulatoryAffairs, and o<strong>the</strong>rs; and conducts various inspections associated with licensing and adjudicatory processes such asfinal, compliance, placard, special event, and financial audit investigations. All activities serve to streng<strong>the</strong>n <strong>the</strong>awareness <strong>of</strong>, and compliance with, <strong>the</strong> appropriate laws and regulations <strong>of</strong> <strong>the</strong> District <strong>of</strong> Columbia.Adjudication - provides administrative support for <strong>the</strong> Alcoholic Beverage and Control (ABC) Board actions andadjudicatory hearings.Records Management - provides files, documents, and database information to ABRA staff, <strong>the</strong> ABC Board, and<strong>the</strong> general public so that <strong>the</strong>y can receive accurate information and files. The program also provides certificationservices, responds to and tracks Freedom <strong>of</strong> Information Act requests, and responds to subpoena requests.<strong>Agency</strong> Management - provides for administrative support and <strong>the</strong> required tools to achieve operational andprogrammatic results. This program is standard for all agencies using performance-based budgeting.Program Structure ChangeThe Alcoholic Beverage Regulation Administration has no program structure changes in <strong>the</strong> FY 2013 proposedbudget.Alcoholic Beverage Regulation AdministrationB-128FY 2013 Proposed <strong>Budget</strong> and <strong>Financial</strong> Plan
FY 2013 Proposed Operating <strong>Budget</strong> and FTEs, by Program and ActivityTable LQ0-4 contains <strong>the</strong> proposed FY 2013 budget by program and activity compared to <strong>the</strong> FY 2012 approved budget.It also provides <strong>the</strong> FY 2011 actual data.Table LQ0-4(dollars in thousands)Dollars in ThousandsFull-Time EquivalentsChangeChangeActual Approved Proposed from Actual Approved Proposed fromProgram/Activity FY 2011 FY 2012 FY 2013 FY 2012 FY 2011 FY 2012 FY 2013 FY 2012(1000) <strong>Agency</strong> Management Program(1010) Personnel 42 41 0 -41 0.0 0.0 0.0 0.0(1015) Training and Employee Development 1 30 10 -20 0.0 0.0 0.0 0.0(1030) Property Management 590 644 615 -29 1.9 2.0 0.0 -2.0(1040) Information Technology 124 263 324 61 0.0 0.0 0.0 0.0(1060) Legal 690 764 934 171 5.6 6.0 7.0 1.0(1070) Fleet Management 32 24 105 81 0.0 0.0 0.0 0.0(1080) Communications 91 96 97 1 0.9 1.0 1.0 0.0(1085) Customer Service 59 60 61 0 0.9 1.0 1.0 0.0(1087) Language Access 4 10 10 0 0.0 0.0 0.0 0.0(1090) Performance Management 494 526 593 68 3.8 4.0 5.0 1.0Subtotal (1000) <strong>Agency</strong> Management Program 2,126 2,458 2,749 291 13.2 14.0 14.0 0.0(2000) Licensing(2010) Licensing 690 748 823 75 9.4 10.0 11.0 1.0Subtotal (2000) Licensing 690 748 823 75 9.4 10.0 11.0 1.0(3000) Investigations(3010) Investigations 1,719 2,528 3,056 528 17.0 19.0 21.0 2.0Subtotal (3000) Investigations 1,719 2,528 3,056 528 17.0 19.0 21.0 2.0(4000) Adjudication(4010) Adjudication 31 101 56 -45 0.9 2.0 1.0 -1.0Subtotal (4000) Adjudication 31 101 56 -45 0.9 2.0 1.0 -1.0(5000) Records Management(5010) Records Management 71 128 151 22 0.9 2.0 2.0 0.0Subtotal (5000) Records Management 71 128 151 22 0.9 2.0 2.0 0.0(6000) Medical Marijuana(6010) Medical Marijuana 0 0 0 0 0.0 0.0 0.0 0.0Subtotal (6000) Medical Marijuana 0 0 0 0 0.0 0.0 0.0 0.0Total Proposed Operating <strong>Budget</strong> 4,637 5,964 6,835 871 41.4 47.0 49.0 2.0(Change is calculated by whole numbers and numbers may not add up due to rounding)Note: For more detailed information regarding <strong>the</strong> proposed funding for <strong>the</strong> activities within this agency’s programs, please see Schedule 30-PBBProgram Summary by Activity in <strong>the</strong> FY 2013 Operating Appendices located on <strong>the</strong> <strong>Office</strong> <strong>of</strong> <strong>the</strong> <strong>Chief</strong> <strong>Financial</strong> <strong>Office</strong>r’s website.FY 2013 Proposed <strong>Budget</strong> and <strong>Financial</strong> PlanAlcoholic Beverage Regulation AdministrationB-129
FY 2013 Proposed <strong>Budget</strong> ChangesThe Alcoholic Beverage Regulation Administration’s (ABRA) proposed FY 2013 gross budget is $6,834,924, whichrepresents a 14.6 percent increase over its FY 2012 approved gross budget <strong>of</strong> $5,964,010. The budget is comprised<strong>of</strong> $460,000 in Dedicated Taxes and $6,374,924 in Special Purpose Revenue funds.Current Services Funding LevelThe Current Services Funding Level (CSFL) is a Local funds ONLY representation <strong>of</strong> <strong>the</strong> true cost <strong>of</strong> operatingDistrict agencies, before consideration <strong>of</strong> policy decisions. The CSFL reflects changes from <strong>the</strong> FY 2012 approvedbudget across multiple programs, and it estimates how much it would cost an agency to continue its currentprograms and operations into <strong>the</strong> following fiscal year. The initial adjustments in <strong>the</strong> budget proposal representchanges that should be compared to <strong>the</strong> FY 2013 CSFL budget and not necessarily changes made to <strong>the</strong> FY 2012Local funds budget. The FY 2013 CSFL adjustments to <strong>the</strong> FY 2012 Local funds budget are described in table 5<strong>of</strong> this agency's budget chapter. Please see <strong>the</strong> CSFL Development section within Volume 1: Executive Summaryfor more information regarding <strong>the</strong> methodology used and components that comprise <strong>the</strong> CSFL.ABRA's FY 2013 CSFL budget is $0, which represents a $279,313, or 100.0 percent, decrease from <strong>the</strong> FY2012 approved Local funds budget <strong>of</strong> $279,313.Initial Adjusted <strong>Budget</strong>Cost Increase: Special Purpose Revenue funds increased by $275,879 in Occupancy Fixed Costs as provided by<strong>the</strong> Department <strong>of</strong> General Services (DGS) and by $234,753 and 1.0 FTE in personal services.Additionally Adjusted <strong>Budget</strong>Technical Adjustment: Adjustment <strong>of</strong> Fringe Benefits to restore <strong>the</strong> District Government contribution foremployee health insurance from 72 percent, implemented in <strong>the</strong> FY 2011 budget, to 75 percent in FY 2013, resultingin an increase <strong>of</strong> $12,750 in Special Purpose Revenue funds.Policy InitiativeCost Increase: There were increases in Special Purpose Revenue funds <strong>of</strong> $279,000 to cover <strong>the</strong> <strong>Office</strong> <strong>of</strong> <strong>Chief</strong>Technology <strong>Office</strong>r (OCTO) assessment, $107,000 to cover sales <strong>of</strong> alcohol to minors enforcement initiative,$82,000 and 1.0 FTE to cover <strong>the</strong> salary and Fringe Benefits <strong>of</strong> a supervisory manager’s position, $27,000 for salaryand Fringe Benefits adjustment <strong>of</strong> one attorney’s position, and $132,000 for extended alcoholic beverage salesduring <strong>the</strong> 2013 Presidential Inauguration week.Alcoholic Beverage Regulation AdministrationB-130FY 2013 Proposed <strong>Budget</strong> and <strong>Financial</strong> Plan
FY 2012 Approved <strong>Budget</strong> to FY 2013 Proposed <strong>Budget</strong>, by Revenue TypeTable LQ0-5 itemizes <strong>the</strong> changes by revenue type between <strong>the</strong> FY 2012 approved budget and <strong>the</strong> FY 2013 proposedbudget.Table LQ0-5(dollars in thousands)PROGRAM BUDGET FTELOCAL FUNDS: FY 2012 Approved <strong>Budget</strong> and FTE 279 0.0Removal <strong>of</strong> One-time Funding Multiple Programs -279 0.0FY 2013 Current Services Funding Level <strong>Budget</strong> (CSFL) 0 0.0No Changes 0 0.0FY 2013 Initial Adjusted <strong>Budget</strong> 0 0.0LOCAL FUNDS: FY 2013 Proposed <strong>Budget</strong> and FTE 0 0.0DEDICATED TAXES: FY 2012 Approved <strong>Budget</strong> and FTE 460 0.0No Change s 0 0.0FY 2013 Initial Adjusted <strong>Budget</strong> 460 0.0DEDICATED TAXES: FY 2013 Proposed <strong>Budget</strong> and FTE 460 0.0SPECIAL PURPOSE REVENUE FUNDS: FY 2012 Approved <strong>Budget</strong> and FTE 5,225 47.0Cost Increase: In nonpersonal services <strong>Agency</strong> Management Program 276 0.0Cost Increase: In personal services Multiple Programs 235 1.0FY 2013 Initial Adjusted <strong>Budget</strong> 5,735 48.0Technical Adjustment: Health insurance contribution Multiple Programs 13 0.0FY 2013 Additionally Adjusted <strong>Budget</strong> 5,748 48.0FY 2013 Policy InitiativesCost Increase: To cover OCTO assessment <strong>Agency</strong> Management Program 279 0.0Cost Increase: To cover sales <strong>of</strong> alcohol to minors Licensing 107 0.0enforcement initiativeCost Increase: To cover <strong>the</strong> salary and Fringe Benefits Licensing 82 1.0for a supervisory manager's positionCost Increase: To cover salary and Fringe Benefits <strong>Agency</strong> Management Program 27 0.0adjustment <strong>of</strong> one attorney's positionCost Increase: For extended alcoholic beverage sales during <strong>the</strong> 2013 Investigations 132 0.0Presidential Inauguration weekSPECIAL PURPOSE REVENUE FUNDS: FY 2013 Proposed <strong>Budget</strong> and FTE 6,375 49.0Gross for LQ0 - Alcoholic Beverage Regulation Administration 6,835 49.0(Change is calculated by whole numbers and numbers may not add up due to rounding)FY 2013 Proposed <strong>Budget</strong> and <strong>Financial</strong> PlanAlcoholic Beverage Regulation AdministrationB-131
<strong>Agency</strong> Performance PlanThe agency’s performance plan has <strong>the</strong> following objectives for FY 2013:Objective 1: Prevent <strong>the</strong> sale <strong>of</strong> alcoholic beverages to underage individuals.Objective 2: Ensure that licensed establishments are in compliance with <strong>the</strong> ABC laws and regulations.Objective 3: Issue licenses to qualified applicants in an efficient manner.<strong>Agency</strong> Performance MeasuresFY 2010 FY 2011 FY 2011 FY 2012 FY 2013 FY 2014Measure Actual Target Actual Projection Projection ProjectionNumber <strong>of</strong> new licenses and permits issued 1,432 850 1,506 900 1,000 1,000Number <strong>of</strong> establishments inspected to ensurecompliance with underage drinking laws 1,432 600 937 700 ** 700 ** 700 **Number <strong>of</strong> inspections, investigations, and monitoringactivities conducted by Enforcement Division 11,266 7,000 7,304 7,000 7,000 7,000Amount <strong>of</strong> revenue generated by licenses $5.5 $3.7 $4.9 $3.7 $3.7 $3.7and permits Million Million Million Million Million MillionAmount <strong>of</strong> revenue generated by fines $488,735 $290,000 $365,780 $290,000 $290,000 $290,000Total number <strong>of</strong> citations issued 503 250 349 250 250 250Percentage <strong>of</strong> one-day and substantial changeNotpermits issued within 15 days or less *** Available 80% 93% 90% 90% 90%Note: These numbers are current through <strong>the</strong> end <strong>of</strong> Q3 on June 30, 2011.Performance Plan Endnotes:**Grant funding for this program is expected to fluctuate in <strong>the</strong> out-years; <strong>the</strong>refore, <strong>the</strong> number <strong>of</strong> inspections have been adjustedto reflect future funding expectations.***Measure is an industry standard based on <strong>the</strong> average <strong>of</strong> 19 processing days for 17 states.Alcoholic Beverage Regulation AdministrationB-132FY 2013 Proposed <strong>Budget</strong> and <strong>Financial</strong> Plan
Public Service Commission(DH0)www.dcpsc.orgTelephone: 202-626-5100% ChangeFY 2011 FY 2012 FY 2013 fromDescription Actual Approved Proposed FY 2012Operating <strong>Budget</strong> $9,798,598 $10,375,515 $10,822,922 4.3FTEs 70.5 72.6 72.6 0.0The mission <strong>of</strong> <strong>the</strong> Public Service Commission (PSC) is to serve<strong>the</strong> public interest by ensuring that financially healthy electric,natural gas, and telecommunications companies provide safe,reliable, and quality services at reasonable rates for District <strong>of</strong>Columbia residential, business, and government customers. Thismission includes:■■■■■■■Protecting consumers to ensure public safety, reliability, and quality utility services;Regulating monopoly utility services to ensure that <strong>the</strong>ir rates are just and reasonable;Fostering fair and open competition among utility service providers;Conserving natural resources and preserving environmental quality;Resolving disputes among consumers and utility service providers;Educating utility consumers and informing <strong>the</strong> public; andMotivating customer and results-oriented employees.Summary <strong>of</strong> ServicesThe Public Service Commission regulates public utilities operating in <strong>the</strong> District <strong>of</strong> Columbia by issuing ordersin formal proceedings that may include written comments or testimony, hearings, studies, and investigations; ensuringfair and appropriate utility prices; fostering competition by licensing utility service providers and supervising<strong>the</strong> competitive bidding process; ensuring that utility providers meet various environmental regulations and standardsby operating in ways that conserve natural resources and preserve environmental quality; and resolving disputesamong consumers and utility service providers.In addition to its regulatory services, <strong>the</strong> Commission also conducts outreach via its website, public forums, andvarious literature in order to educate utility consumers and inform <strong>the</strong> public.The agency’s FY 2013 proposed budget is presented in <strong>the</strong> following tables:FY 2013 Proposed <strong>Budget</strong> and <strong>Financial</strong> PlanPublic Service CommissionB-133
FY 2013 Proposed Gross Funds Operating <strong>Budget</strong>, by Revenue TypeTable DH0-1 contains <strong>the</strong> proposed FY 2013 agency budget compared to <strong>the</strong> FY 2012 approved budget. It alsoprovides FY 2010 and FY 2011 actual expenditures.Table DH0-1(dollars in thousands)ChangeActual Actual Approved Proposed from PercentAppropriated Fund FY 2010 FY 2011 FY 2012 FY 2013 FY 2012 Change*General FundSpecial Purpose Revenue Funds 9,561 9,239 9,901 10,360 459 4.6Total for General Fund 9,561 9,239 9,901 10,360 459 4.6Federal ResourcesFederal Grant Funds 220 509 475 463 -12 -2.5Total for Federal Resources 220 509 475 463 -12 -2.5Intra-District FundsIntra-District Funds 70 50 0 0 0 N/ATotal for Intra-District Funds 70 50 0 0 0 N/AGross Funds 9,851 9,799 10,376 10,823 447 4.3*Percent change is based on whole dollars.Note: If applicable, for a breakdown <strong>of</strong> each Grant (Federal and Private), Special Purpose Revenue type and Intra-District agreement,please refer to Schedule 80 <strong>Agency</strong> Summary by Revenue Source in <strong>the</strong> FY 2013 Operating Appendices located on <strong>the</strong> <strong>Office</strong> <strong>of</strong> <strong>the</strong><strong>Chief</strong> <strong>Financial</strong> <strong>Office</strong>r’s website.FY 2013 Proposed Full-Time Equivalents, by Revenue TypeTable DH0-2 contains <strong>the</strong> proposed FY 2013 FTE level compared to <strong>the</strong> FY 2012 approved FTE level by revenuetype. It also provides FY 2010 and FY 2011 actual data.Table DH0-2ChangeActual Actual Approved Proposed from PercentAppropriated Fund FY 2010 FY 2011 FY 2012 FY 2013 FY 2012 ChangeGeneral FundSpecial Purpose Revenue Funds 64.8 66.3 67.2 68.0 0.8 1.1Total for General Fund 64.8 66.3 67.2 68.0 0.8 1.1Federal ResourcesFederal Grant Funds 1.1 4.2 5.4 4.7 -0.7 -13.7Total for Federal Resources 1.1 4.2 5.4 4.7 -0.7 -13.7Total Proposed FTEs 65.9 70.5 72.6 72.6 0.0 0.0Public Service CommissionB-134FY 2013 Proposed <strong>Budget</strong> and <strong>Financial</strong> Plan
FY 2013 Proposed Operating <strong>Budget</strong>, by Comptroller Source GroupTable DH0-3 contains <strong>the</strong> proposed FY 2013 budget at <strong>the</strong> Comptroller Source Group (object class) level comparedto <strong>the</strong> FY 2012 approved budget. It also provides FY 2010 and FY 2011 actual expenditures.Table DH0-3(dollars in thousands)ChangeActual Actual Approved Proposed from PercentComptroller Source Group FY 2010 FY 2011 FY 2012 FY 2013 FY 2012 Change*11 - Regular Pay - Continuing Full Time 4,927 4,861 5,309 5,442 134 2.512 - Regular Pay - O<strong>the</strong>r 1,008 1,203 1,229 1,263 34 2.813 - Additional Gross Pay 25 29 0 0 0 N/A14 - Fringe Benefits - Current Personnel 1,079 1,104 1,301 1,349 48 3.7Subtotal Personal Services (PS) 7,039 7,197 7,839 8,054 215 2.720 - Supplies and Materials 43 31 40 44 3 8.030 - Energy, Comm. and Building Rentals 2 2 2 2 1 57.331 - Telephone, Telegraph, Telegram, Etc. 76 74 80 76 -4 -5.132 - Rentals - Land and Structures 1,517 1,607 1,671 1,693 22 1.333 - Janitorial Services 0 0 2 0 -2 -100.035 - Occupancy Fixed Costs 9 0 8 6 -2 -20.540 - O<strong>the</strong>r Services and Charges 383 388 347 508 161 46.441 - Contractual Services - O<strong>the</strong>r 601 350 204 257 52 25.770 - Equipment and Equipment Rental 181 148 182 182 0 0.0Subtotal Nonpersonal Services (NPS) 2,812 2,601 2,537 2,769 232 9.2Gross Funds 9,851 9,799 10,376 10,823 447 4.3*Percent change is based on whole dollars.FY 2013 Proposed <strong>Budget</strong> and <strong>Financial</strong> PlanPublic Service CommissionB-135
Program DescriptionThe Public Service Commission operates through <strong>the</strong> following 4 programs:Natural Gas Pipeline Safety – conducts inspections, investigations, and audits, and issues notices <strong>of</strong> probableviolations to Washington Gas so that it can provide safe and reliable natural gas service to District consumers incompliance with federal grant provisions and to prevent harmful incidents. Conducts inspections <strong>of</strong> natural gasconstruction projects, investigates incidents, audits Washington Gas’ records, and issues notices <strong>of</strong> probable violationsto ensure compliance with federal and District standards.Utility Regulation – regulates natural gas, electric, and local telecommunications services to ensure providers <strong>of</strong>fersafe, reliable, and quality services at reasonable rates to District <strong>of</strong> Columbia residential, business, and governmentcustomers.This program contains <strong>the</strong> following 6 activities:■ Public Safety and Reliability – issues orders and regulations, monitors implementation <strong>of</strong> plans and qualityservice standards, and proposes legislation for services <strong>of</strong>fered by natural gas, electric, and local telecommunicationsproviders serving <strong>the</strong> District;■ Regulate Monopoly – provides rate-setting services to natural gas, electric and local telecommunicationsutility companies through <strong>the</strong> issuance <strong>of</strong> orders and regulations;■ Foster Competition – monitors performance <strong>of</strong> natural gas, electric, and telecommunications service providerswhere <strong>the</strong> markets have been opened to competition, and ensures compliance with <strong>the</strong> Commission’srestructuring rules;■ Dispute Resolution – provides investigation, mediation, and resolution services to District consumers andcustomers <strong>of</strong> energy and telecommunications services so that <strong>the</strong>y can have <strong>the</strong>ir complaints resolved andinquiries addressed in a timely manner in accordance with applicable laws, regulations, and tariffs;■ Public Information and Consumer Education – facilitates <strong>the</strong> public’s access to <strong>the</strong> Commission through itswebsite and provides oral and written information services to District consumers and customers <strong>of</strong> energy andtelecommunications services so that <strong>the</strong>y can make informed choices in obtaining quality services at reasonablerates; and■ Conserving Natural Resources and Preserving <strong>the</strong> Environment – processes Renewable Energy Portfolioapplications, monitors <strong>the</strong> fuel mix <strong>of</strong> electricity suppliers, participates in <strong>the</strong> Sustainable Energy Utilityprogram, and implements sub-metering rules for commercial electricity customers.<strong>Agency</strong> Management - provides for administrative support and <strong>the</strong> required tools to achieve operational andprogrammatic results. This program is standard for all agencies using performance-based budgeting.<strong>Agency</strong> <strong>Financial</strong> Operations – provides comprehensive and efficient financial management services to, and onbehalf <strong>of</strong>, District agencies so that <strong>the</strong> financial integrity <strong>of</strong> <strong>the</strong> District <strong>of</strong> Columbia is maintained. This programis standard for all agencies using performance-based budgeting.Program Structure ChangeThe Public Service Commission has no program structure changes in <strong>the</strong> FY 2013 proposed budget.Public Service CommissionB-136FY 2013 Proposed <strong>Budget</strong> and <strong>Financial</strong> Plan
FY 2013 Proposed Operating <strong>Budget</strong> and FTEs, by Program and ActivityTable DH0-4 contains <strong>the</strong> proposed FY 2013 budget by program and activity compared to <strong>the</strong> FY 2012 approvedbudget. It also provides <strong>the</strong> FY 2011 actual data.Table DH0-4(dollars in thousands)Dollars in ThousandsFull-Time EquivalentsChangeChangeActual Approved Proposed from Actual Approved Proposed fromProgram/Activity FY 2011 FY 2012 FY 2013 FY 2012 FY 2011 FY 2012 FY 2013 FY 2012(1000) <strong>Agency</strong> Management(1010) Personnel 297 303 307 4 3.2 2.9 2.9 0.0(1015) Training and Development 211 232 236 4 0.4 1.2 1.2 0.0(1020) Contracting and Procurement 62 205 207 2 0.4 1.8 1.8 0.0(1030) Property Management 1,953 2,114 2,128 14 1.2 0.6 0.6 0.0(1040) Information Technology 296 295 301 6 1.1 1.3 1.3 0.0(1050) <strong>Financial</strong> Management 71 79 79 0 0.3 0.4 0.4 0.0(1060) Legal 307 194 203 9 0.8 0.9 0.9 0.0(1070) Fleet Management 1 2 2 1 0.0 0.0 0.0 0.0(1080) Communications 60 177 173 -4 0.5 2.1 2.1 0.0(1085) Customer Service 138 185 184 -1 1.7 2.2 2.2 0.0(1090) Performance Management 41 51 52 1 0.3 0.4 0.4 0.0Subtotal (1000) <strong>Agency</strong> Management 3,438 3,836 3,873 36 9.8 13.7 13.7 0.0(100F) <strong>Agency</strong> <strong>Financial</strong> Operations(110F) <strong>Budget</strong> Operations 182 190 208 18 1.6 1.6 1.6 0.0(120F) Accounting Operations 82 87 88 1 1.0 1.0 1.0 0.0Subtotal (100F) <strong>Agency</strong> <strong>Financial</strong> Operations 264 277 295 19 2.6 2.6 2.6 0.0(2000) Pipeline Safety(2010) Pipeline Safety 661 594 314 -280 5.6 6.7 2.7 -4.0Subtotal (2000) Pipeline Safety 661 594 314 -280 5.6 6.7 2.7 -4.0(3000) Utility Regulation(3010) Public Safety and Reliability 784 788 1,239 451 7.6 6.4 9.6 3.2(3020) Regulate Monopoly 1,660 1,818 1,901 84 14.6 14.7 14.8 0.2(3030) Foster Competition 1,275 1,060 1,084 25 11.4 8.6 8.5 -0.1(3040) Resolve Dispute 825 677 709 32 9.1 6.5 6.7 0.1(3050) Public Information/Consumer Education 795 682 707 25 9.8 7.9 8.3 0.4(3060) Conserving Energy and Preserving Environment 2 644 701 57 0.0 5.6 5.9 0.3Subtotal (3000) Utility Regulation 5,341 5,669 6,341 672 52.6 49.7 53.7 4.0(Continued on next page)FY 2013 Proposed <strong>Budget</strong> and <strong>Financial</strong> PlanPublic Service CommissionB-137
Table DH0-4 (continued)(dollars in thousands)Dollars in ThousandsFull-Time EquivalentsChangeChangeActual Approved Proposed from Actual Approved Proposed fromProgram/Activity FY 2011 FY 2012 FY 2013 FY 2012 FY 2011 FY 2012 FY 2013 FY 2012(7000) Intra-District - Broadband Mapping(7010) Intra-District - Broadband Mapping 50 0 0 0 0.0 0.0 0.0 0.0Subtotal (7000) Intra-District - Broadband Mapping 50 0 0 0 0.0 0.0 0.0 0.0(8000) Public Service Commission(8010) Pipeline Safety - One Call Grant 45 0 0 0 0.0 0.0 0.0 0.0Subtotal (8000) Public Service Commission 45 0 0 0 0.0 0.0 0.0 0.0(9960) Audit Adjustments(9960) Audit Adjustments 3 0 0 0 0.0 0.0 0.0 0.0Subtotal (9960) Audit Adjustments 3 0 0 0 0.0 0.0 0.0 0.0(9980) Payroll Default Program(9980) Payroll Default Program -3 0 0 0 0.0 0.0 0.0 0.0Subtotal (9980) Payroll Default Program -3 0 0 0 0.0 0.0 0.0 0.0Total Proposed Operating <strong>Budget</strong> 9,799 10,376 10,823 447 70.5 72.6 72.6 0.0(Change is calculated by whole numbers and numbers may not add up due to rounding)Note: For more detailed information regarding <strong>the</strong> proposed funding for <strong>the</strong> activities within this agency’s programs, please see Schedule 30-PBBProgram Summary by Activity in <strong>the</strong> FY 2013 Operating Appendices located on <strong>the</strong> <strong>Office</strong> <strong>of</strong> <strong>the</strong> <strong>Chief</strong> <strong>Financial</strong> <strong>Office</strong>r’s website.Public Service CommissionB-138FY 2013 Proposed <strong>Budget</strong> and <strong>Financial</strong> Plan
FY 2013 Proposed <strong>Budget</strong> ChangesThe Public Service Commission’s (PSC) proposed FY 2013 gross budget is $10,822,922, which represents a 4.3percent increase over its FY 2012 approved gross budget <strong>of</strong> $10,375,515. The budget is comprised <strong>of</strong> $10,359,612in Special Purpose Revenue funds and $463,310 in Federal Grant funds.Initial Adjusted <strong>Budget</strong>Cost Increase: The Public Service Commission will add $45,000 in Federal Grant funds for <strong>the</strong> One Call grant.These funds will be allocated to <strong>the</strong> Pipeline Safety program in Contractual Services. The agency will also increaseFederal Grant funding by $7,750 in Equipment and $5,717 in Supplies. Special Purpose Revenue funds willreceive an increase <strong>of</strong> $186,416 in O<strong>the</strong>r Services and Charges. These funds will primarily be used to support publicsafety and reliability initiatives. An additional $146,113 aligns personal services to historical spending, $22,748covers utility and rent assessments, and $7,500 supports Contractual Services.Cost Decrease: The agency will reduce <strong>the</strong> amount <strong>of</strong> Federal Grant funding allocated to personal services by$45,902 and Training and Education by $25,257. Special Purpose Revenue fund decreases <strong>of</strong> $10,249 in Suppliesand Equipment, $4,064 in Telecom, and $3,277 in Janitorial and Occupancy assessments from <strong>the</strong> Department<strong>of</strong> General Services (DGS) will not impact service delivery.Additionally Adjusted <strong>Budget</strong>Technical Adjustment: Adjustment <strong>of</strong> Fringe Benefits to restore <strong>the</strong> District Government contribution foremployee health insurance from 72 percent, implemented in <strong>the</strong> FY 2011 budget, to 75 percent in FY 2013, resultingin an increase <strong>of</strong> $21,881 in Special Purpose Revenue funds and $1,031 in Federal Grant funds.Policy InitiativeCost Increase: PSC will add an additional $92,000 in <strong>the</strong> Utility Regulation program for union salary increasesto comply with <strong>the</strong> collective bargaining agreement confirmed by <strong>the</strong> Compensation Unit 34 Approval Resolution<strong>of</strong> 2012.FY 2013 Proposed <strong>Budget</strong> and <strong>Financial</strong> PlanPublic Service CommissionB-139
FY 2012 Approved <strong>Budget</strong> to FY 2013 Proposed <strong>Budget</strong>, by Revenue TypeTable DH0-5 itemizes <strong>the</strong> changes by revenue type between <strong>the</strong> FY 2012 approved budget and <strong>the</strong> FY 2013 proposedbudget.Table DH0-5(dollars in thousands)PROGRAM BUDGET FTEFEDERAL GRANT FUNDS: FY 2012 Approved <strong>Budget</strong> and FTE 475 5.4Cost Increase: One Call grant to be used for Contractual Services Pipeline Safety 45 0.0Cost Increase: Pipeline Safety grant increase in Equipment Pipeline Safety 8 0.0Cost Increase: American Recovery and Reinvestment Act (ARRA) Pipeline Safety 6 0.0and Pipeline Safety funding for SuppliesCost Decrease: Align personal services with projected costs Pipeline Safety -46 -0.7Cost Decrease: ARRA grant reduction in Training and Education Pipeline Safety -25 0.0FY 2013 Initial Adjusted <strong>Budget</strong> 462 4.7Technical Adjustment: Health insurance contribution Multiple Programs 1 0.0FY 2013 Additionally Adjusted <strong>Budget</strong> 463 4.7FEDERAL GRANT FUNDS: FY 2013 Proposed <strong>Budget</strong> and FTE 463 4.7SPECIAL PURPOSE REVENUE FUNDS: FY 2012 Approved <strong>Budget</strong> and FTE 9,901 67.2Cost Increase: O<strong>the</strong>r Services and Charges <strong>Agency</strong> Management 186 0.0Cost Increase: Align personal services with projected costs Multiple Programs 146 0.8Cost Increase: Utility and rent assessments from DGS <strong>Agency</strong> Management 23 0.0Cost Increase: Contractual Services <strong>Agency</strong> Management 8 0.0Cost Decrease: Supplies and Equipment <strong>Agency</strong> Management -10 0.0Cost Decrease: Efficient use <strong>of</strong> Telecom devices <strong>Agency</strong> Management -4 0.0Cost Decrease: Janitorial and Occupancy assessments from DGS <strong>Agency</strong> Management -3 0.0FY 2013 Initial Adjusted <strong>Budget</strong> 10,246 68.0Technical Adjustment: Health insurance contribution Multiple Programs 22 0.0FY 2013 Additionally Adjusted <strong>Budget</strong> 10,268 68.0FY 2013 Policy InitiativesCost Increase: Union salary increases per collective Utility Regulation 92 0.0bargaining agreementSPECIAL PURPOSE REVENUE FUNDS: FY 2013 Proposed <strong>Budget</strong> and FTE 10,360 68.0Gross for DH0 - Public Service Commission 10,823 72.7(Change is calculated by whole numbers and numbers may not add up due to rounding)Public Service CommissionB-140FY 2013 Proposed <strong>Budget</strong> and <strong>Financial</strong> Plan
<strong>Agency</strong> Performance PlanThe agency’s performance plan has <strong>the</strong> following objectives for FY 2013:Objective 1: Ensure safe and quality service by managing <strong>the</strong> Natural Gas Pipeline Safety Program, monitoringutility providers’ compliance with <strong>the</strong> Commission’s service quality standards, and investigating outages.Objective 2: Ensure reliable electricity service by facilitating <strong>the</strong> transition to a “Smart Grid,” a more technologicallyadvanced network that includes advanced metering, communications, and delivery systems.<strong>Agency</strong> Performance MeasuresFY 2010 FY 2011 FY 2011 FY 2012 FY 2013 FY 2014Measure Actual Projection Actual Projection Projection ProjectionIndustry Benchmark Measure - USDOT rating for <strong>the</strong>NotCommission's Pipeline Safety program 94% 1 98% Available 98% 98% 98%Adjudicative case decisions to be issued within 90days from <strong>the</strong> close <strong>of</strong> <strong>the</strong> record 100% 95% 100% 2 95% 95% 95%Cost per informal consumer complaint 3 $63.57 $67.84 $66.43 $67.84 $69.87 $71.97Number <strong>of</strong> hits to EducateDConsumer section <strong>of</strong> <strong>the</strong> 280,000 380,000homepage <strong>of</strong> <strong>the</strong> website (includes customer choice revised to revised tosections) 153,298 205,000 209,508 266,640 4 337,445 408,000Performance Plan Endnotes:1. USDOT’s pipeline safety program ratings are for prior calendar year performance. The PSC’s rating <strong>of</strong> 94 percent in FY 2010 for<strong>the</strong> 2009 calendar year is below target in part because federal evaluators determined that one <strong>of</strong> <strong>the</strong> District’s standards wasless stringent than <strong>the</strong> federal standard. The PSC disputed <strong>the</strong> rating received in 2010 and agreed to modify its rules to avoidfur<strong>the</strong>r argument- See Initiative 1.1.2. The Commission had only one adjudicative proceeding in FY 2011 – F.C. No. 1079.3. Cost refers to agency personnel expenses in processing informal consumer complaints. The target originally included a 3percent escalator due to District government-mandated cost-<strong>of</strong>-living increases and step increases. However, no Districtgovernment pay increases were approved for FY 2010 through FY 2011, and step increases were eliminated as <strong>of</strong> <strong>the</strong>beginning <strong>of</strong> FY 2011. The 3 percent escalator is reapplied in FY 2013 and FY 2014.4. The revised FY 2012- FY 2014 projections were computed using a linear projectional algorithm based on historic monthlyvalues.FY 2013 Proposed <strong>Budget</strong> and <strong>Financial</strong> PlanPublic Service CommissionB-141
<strong>Office</strong> <strong>of</strong> <strong>the</strong> People’s Counsel(DJ0)www.opc-dc.govTelephone: 202-727-3071% ChangeFY 2011 FY 2012 FY 2013 fromDescription Actual Approved Proposed FY 2012Operating <strong>Budget</strong> $4,960,137 $5,447,184 $6,115,878 12.3FTEs 32.4 33.4 36.4 9.0The mission <strong>of</strong> <strong>the</strong> <strong>Office</strong> <strong>of</strong> <strong>the</strong> People's Counsel (“OPC” or“<strong>Office</strong>”) is to advocate for <strong>the</strong> provision <strong>of</strong> safe and reliable qualityutility service and equitable treatment at rates that are just, reasonable,and nondiscriminatory; assist individual consumers in disputes withutility providers; provide technical assistance, education and outreachto consumers and ratepayers, community groups, associations and <strong>the</strong>Consumer Utility Board; and provide legislative analysis andinformation to <strong>the</strong> Council <strong>of</strong> <strong>the</strong> District <strong>of</strong> Columbia on mattersrelating to utilities. The <strong>Office</strong>’s mission fur<strong>the</strong>r includes consideration<strong>of</strong> <strong>the</strong> District’s economy and promotion <strong>of</strong> <strong>the</strong> environmentalsustainability <strong>of</strong> <strong>the</strong> District. Specifically, OPC's mission includes:■■■■■■■■Advocating on behalf <strong>of</strong> District consumers in adjudicatory and regulatory proceedings before <strong>the</strong> D.C. PublicService Commission, federal agencies, and courts;Representing District consumers in individual disputes involving gas, electric, and telephone companiesproviding residential service in <strong>the</strong> District <strong>of</strong> Columbia;Educating consumers about ongoing and emerging utility issues;Collaborating and forming alliances with District agencies and o<strong>the</strong>r stakeholders involved in <strong>the</strong> utilityregulatory process;Informing and advising District policy makers, including <strong>the</strong> Executive <strong>Office</strong> <strong>of</strong> <strong>the</strong> Mayor and <strong>the</strong> DistrictCouncil, <strong>of</strong> emerging utility issues affecting <strong>the</strong>ir constituents;Advising <strong>the</strong> District Council on <strong>the</strong> need for legislative action to address consumer-based utility issues; andServing as a statutory member on <strong>the</strong> Sustainable Energy Utility Advisory Board to assist in <strong>the</strong> development<strong>of</strong> a city-wide sustainable energy policy; andConducting hands-on energy workshops for consumers in all eight wards <strong>of</strong> <strong>the</strong> District.FY 2013 Proposed <strong>Budget</strong> and <strong>Financial</strong> Plan<strong>Office</strong> <strong>of</strong> <strong>the</strong> People’s CounselB-143
Summary <strong>of</strong> ServicesOPC is a party to all utility-related proceedings before <strong>the</strong> Public Service Commission and represents <strong>the</strong> interests<strong>of</strong> <strong>the</strong> District ratepayers before federal regulatory agencies, courts, and commissions. The <strong>of</strong>fice assists individualconsumers in disputes with utility companies over billing or services, and it provides consumer education and outreachto community, civic, and consumer organizations and associations on emerging issues impacting <strong>the</strong> quality,reliability, and affordability <strong>of</strong> utility services. OPC also provides legislative analysis for, assistance to and testimonybefore, <strong>the</strong> District Council on utility matters.The agency’s FY 2013 proposed budget is presented in <strong>the</strong> following tables:FY 2013 Proposed Gross Funds Operating <strong>Budget</strong>, by Revenue TypeTable DJ0-1 contains <strong>the</strong> proposed FY 2013 agency budget compared to <strong>the</strong> FY 2012 approved budget. It alsoprovides FY 2010 and FY 2011 actual expenditures.Table DJ0-1(dollars in thousands)ChangeActual Actual Approved Proposed from PercentAppropriated Fund FY 2010 FY 2011 FY 2012 FY 2013 FY 2012 Change*General FundSpecial Purpose Revenue Funds 4,723 4,960 5,447 6,116 669 12.3Total for General Fund 4,723 4,960 5,447 6,116 669 12.3Gross Funds 4,723 4,960 5,447 6,116 669 12.3*Percent change is based on whole dollars.Note: If applicable, for a breakdown <strong>of</strong> each Grant (Federal and Private), Special Purpose Revenue type and Intra-District agreement,please refer to Schedule 80 <strong>Agency</strong> Summary by Revenue Source in <strong>the</strong> FY 2013 Operating Appendices located on <strong>the</strong> <strong>Office</strong> <strong>of</strong> <strong>the</strong><strong>Chief</strong> <strong>Financial</strong> <strong>Office</strong>r’s website.FY 2013 Proposed Full-Time Equivalents, by Revenue TypeTable DJ0-2 contains <strong>the</strong> proposed FY 2013 FTE level compared to <strong>the</strong> FY 2012 approved FTE level by revenuetype. It also provides FY 2010 and FY 2011 actual data.Table DJ0-2ChangeActual Actual Approved Proposed from PercentAppropriated Fund FY 2010 FY 2011 FY 2012 FY 2013 FY 2012 ChangeGeneral FundSpecial Purpose Revenue Funds 32.5 32.4 33.4 36.4 3.0 9.0Total for General Fund 32.5 32.4 33.4 36.4 3.0 9.0Total Proposed FTEs 32.5 32.4 33.4 36.4 3.0 9.0<strong>Office</strong> <strong>of</strong> <strong>the</strong> People’s CounselB-144FY 2013 Proposed <strong>Budget</strong> and <strong>Financial</strong> Plan
FY 2013 Proposed Operating <strong>Budget</strong>, by Comptroller Source GroupTable DJ0-3 contains <strong>the</strong> proposed FY 2013 budget at <strong>the</strong> Comptroller Source Group (object class) level comparedto <strong>the</strong> FY 2012 approved budget. It also provides FY 2010 and FY 2011 actual expenditures.Table DJ0-3(dollars in thousands)ChangeActual Actual Approved Proposed from PercentComptroller Source Group FY 2010 FY 2011 FY 2012 FY 2013 FY 2012 Change*11 - Regular Pay - Continuing Full Time 2,793 2,768 3,241 3,435 194 6.013 - Additional Gross Pay 65 59 0 0 0 N/A14 - Fringe Benefits - Current Personnel 446 477 587 629 42 7.2Subtotal Personal Services (PS) 3,304 3,304 3,828 4,064 236 6.220 - Supplies and Materials 51 31 40 40 0 0.030 - Energy, Comm. and Building Rentals 0 0 0 1 1 130.331 - Telephone, Telegraph, Telegram, Etc. 118 32 17 29 12 68.632 - Rentals - Land and Structures 605 836 796 1,031 234 29.433 - Janitorial Services 0 0 2 0 -2 -100.035 - Occupancy Fixed Costs 5 0 8 6 -2 -20.540 - O<strong>the</strong>r Services and Charges 367 373 325 484 159 48.941 - Contractual Services - O<strong>the</strong>r 144 254 242 272 30 12.470 - Equipment and Equipment Rental 129 130 189 189 0 0.0Subtotal Nonpersonal Services (NPS) 1,419 1,656 1,620 2,052 432 26.7Gross Funds 4,723 4,960 5,447 6,116 669 12.3*Percent change is based on whole dollars.Program DescriptionThe <strong>Office</strong> <strong>of</strong> <strong>the</strong> People’s Counsel operates through <strong>the</strong> following 3 programs:<strong>Office</strong> <strong>of</strong> People’s Counsel - provides consumer advocacy for utility consumers in <strong>the</strong> District so that <strong>the</strong>y receivequality utility service and equitable treatment at rates that are just, reasonable, and nondiscriminatory.This program contains <strong>the</strong> following 2 activities:■ Consumer Advocacy and Representation - provides legal and technical analysis and consumer advocacyservices for District consumers to ensure safe, reliable services at rates that are just, reasonable, and consistentwith new statutory mandates; and advocates for <strong>the</strong> conservation <strong>of</strong> natural resources <strong>of</strong> <strong>the</strong> District,consideration <strong>of</strong> <strong>the</strong> economy, and <strong>the</strong> preservation <strong>of</strong> environmental quality; and■ Public Information Dissemination - provides consumer education and outreach and technical assistance toDistrict consumers so that <strong>the</strong>y understand <strong>the</strong>ir rights as ratepayers and make informed decisions about <strong>the</strong>irutility services.<strong>Agency</strong> Management - provides for administrative support and <strong>the</strong> required tools to achieve operational andprogrammatic results. This program is standard for all agencies using performance-based budgeting.<strong>Agency</strong> <strong>Financial</strong> Operations – provides comprehensive and efficient financial management services to, and onbehalf <strong>of</strong>, District agencies so that <strong>the</strong> financial integrity <strong>of</strong> <strong>the</strong> District <strong>of</strong> Columbia is maintained. This programis standard for all agencies using performance-based budgeting.FY 2013 Proposed <strong>Budget</strong> and <strong>Financial</strong> Plan<strong>Office</strong> <strong>of</strong> <strong>the</strong> People’s CounselB-145
Program Structure ChangeThe <strong>Office</strong> <strong>of</strong> <strong>the</strong> People’s Counsel has no program structure changes in <strong>the</strong> FY 2013 proposed budget.FY 2013 Proposed Operating <strong>Budget</strong> and FTEs, by Program and ActivityTable DJ0-4 contains <strong>the</strong> proposed FY 2013 budget by program and activity compared to <strong>the</strong> FY 2012 approved budget.It also provides <strong>the</strong> FY 2011 actual data.Table DJ0-4(dollars in thousands)Dollars in ThousandsFull-Time EquivalentsChangeChangeActual Approved Proposed from Actual Approved Proposed fromProgram/Activity FY 2011 FY 2012 FY 2013 FY 2012 FY 2011 FY 2012 FY 2013 FY 2012(1000) <strong>Agency</strong> Management(1010) Personnel 113 115 116 1 1.2 1.2 1.2 0.0(1020) Contracting and Procurement 214 213 170 -43 1.9 2.0 1.4 -0.5(1030) Property Management 970 1,083 1,329 246 0.0 0.0 0.0 0.0(1040) Information Technology 244 345 356 11 2.9 3.0 3.0 0.0(1050) <strong>Financial</strong> Management 86 76 125 49 0.0 0.0 0.0 0.0(1070) Fleet Management 9 10 10 1 0.0 0.0 0.0 0.0(1085) Customer Service 42 48 48 0 1.0 1.0 1.0 0.0Subtotal (1000) <strong>Agency</strong> Management 1,678 1,890 2,154 263 6.9 7.2 6.6 -0.5(100F) <strong>Agency</strong> <strong>Financial</strong> Operations(110F) <strong>Budget</strong> Operations 114 172 267 95 1.4 1.4 2.4 1.0Subtotal (100F) <strong>Agency</strong> <strong>Financial</strong> Operations 114 172 267 95 1.4 1.4 2.4 1.0(2000) <strong>Office</strong> <strong>of</strong> People’s Counsel(2010) Consumer Advocacy and Representation 2,170 2,254 2,456 202 13.8 13.8 16.0 2.2(2020) Public Information Dissemination 998 1,131 1,239 108 10.4 11.0 11.3 0.3Subtotal (2000) <strong>Office</strong> <strong>of</strong> People’s Counsel 3,168 3,385 3,695 310 24.1 24.8 27.4 2.5Total Proposed Operating <strong>Budget</strong> 4,960 5,447 6,116 669 32.4 33.4 36.4 3.0(Change is calculated by whole numbers and numbers may not add up due to rounding)Note: For more detailed information regarding <strong>the</strong> proposed funding for <strong>the</strong> activities within this agency’s programs, please see Schedule 30-PBBProgram Summary by Activity in <strong>the</strong> FY 2013 Operating Appendices located on <strong>the</strong> <strong>Office</strong> <strong>of</strong> <strong>the</strong> <strong>Chief</strong> <strong>Financial</strong> <strong>Office</strong>r’s website.FY 2013 Proposed <strong>Budget</strong> ChangesThe <strong>Office</strong> <strong>of</strong> <strong>the</strong> People’s Counsel’s (OPC) proposed FY 2013 gross budget is $6,115,878, which represents a 12.3percent increase over its FY 2012 approved gross budget <strong>of</strong> $5,447,184. The budget is comprised entirely <strong>of</strong> SpecialPurpose Revenue funds.Initial Adjusted <strong>Budget</strong>Cost Increase: The agency’s fixed cost assessment for rent will increase by $234,419. Personal services will increaseby $225,477 to account for 3.0 additional FTEs, planned step increases, and increased fringe benefit rates. The<strong>Office</strong> <strong>of</strong> <strong>the</strong> People’s CounselB-146FY 2013 Proposed <strong>Budget</strong> and <strong>Financial</strong> Plan
agency will devote $100,000 <strong>of</strong> additional resources across all programs and multiple activities to pr<strong>of</strong>essional servicecontracts. OPC will serve an important role in supporting <strong>the</strong> new sustainability energy initiative and compliancewith <strong>the</strong> Americans with Disabilities Act and language access requirements, as it will increase funding by$50,724 and $30,000, respectfully. Increases totaling $11,806, $7,497, and $720 will support telecommunications,an assessment from <strong>the</strong> <strong>Office</strong> <strong>of</strong> <strong>the</strong> <strong>Chief</strong> Technology <strong>Office</strong>r (OCTO), and Call Center operations costs,respectively.Cost Decrease: The Department <strong>of</strong> General Services (DGS) has projected <strong>the</strong> combined fixed costs <strong>of</strong> energy,janitorial services, and occupancy fees to decrease by $2,771.Additionally Adjusted <strong>Budget</strong>Cost Increase: Adjustment <strong>of</strong> Fringe Benefits to restore <strong>the</strong> District Government contribution for employee healthinsurance from 72 percent, implemented in <strong>the</strong> FY 2011 budget, to 75 percent in FY 2013, resulting in an increase<strong>of</strong> $10,820.FY 2012 Approved <strong>Budget</strong> to FY 2013 Proposed <strong>Budget</strong>, by Revenue TypeTable DJ0-5 itemizes <strong>the</strong> changes by revenue type between <strong>the</strong> FY 2012 approved budget and <strong>the</strong> FY 2013 proposedbudget.Table DJ0-5(dollars in thousands)PROGRAM BUDGET FTESPECIAL PURPOSE REVENUE FUNDS: FY 2012 Approved <strong>Budget</strong> and FTE 5,447 33.4Cost Increase: Rent projection from <strong>the</strong> Department <strong>Agency</strong> Management 234 0.0<strong>of</strong> General Services (DGS)Cost Increase: Align personal services based on historical Multiple Programs 225 3.0spending patternsCost Increase: Pr<strong>of</strong>essional service contracts Multiple Programs 100 0.0Cost Increase: Printing and advertising costs to Multiple Programs 51 0.0support new sustainability energy initiativeCost Increase: To support ADA and language access <strong>Office</strong> <strong>of</strong> People’s Counsel 30 0.0compliance activitiesCost Increase: Telecommunications projections from <strong>Agency</strong> Management 12 0.0OCTOCost Increase: OCTO assessment Multiple Programs 7 0.0Cost Increase: Call Center operations <strong>Agency</strong> Management 1 0.0Cost Decrease: Net effect <strong>of</strong> DGS projections in energy, <strong>Agency</strong> Management -3 0.0janitorial services, and occupancy feesFY 2013 Initial Adjusted <strong>Budget</strong> 6,105 36.4Technical Adjustment: Health Care Contribution Multiple Programs 11 0.0FY 2013 Additionally Adjusted <strong>Budget</strong> 6,116 36.4SPECIAL PURPOSE REVENUE FUNDS: FY 2013 Proposed <strong>Budget</strong> and FTE 6,116 36.4Gross for DJ0 - <strong>Office</strong> <strong>of</strong> <strong>the</strong> People's Counsel 6,116 36.4(Change is calculated by whole numbers and numbers may not add up due to rounding)FY 2013 Proposed <strong>Budget</strong> and <strong>Financial</strong> Plan<strong>Office</strong> <strong>of</strong> <strong>the</strong> People’s CounselB-147
<strong>Agency</strong> Performance PlanThe agency’s performance plan has <strong>the</strong> following objectives for FY 2013:Objective 1: Ensure effective advocacy on behalf <strong>of</strong> consumers and ratepayers <strong>of</strong> natural gas, electric, and telephoneservices in <strong>the</strong> District.Objective 2: Provide community education outreach and technical assistance to District ratepayers and consumerson matters relating to utilities.Objective 3: Provide assistance to individual consumers regarding <strong>the</strong>ir billing and service complaints against <strong>the</strong>utilities.Objective 4: Promote GreenDC agenda.Objective 5: Increase services to <strong>the</strong> District's limited and non-English pr<strong>of</strong>icient (LEP/NEP) residents.<strong>Agency</strong> Performance MeasuresFY 2010 FY 2011 FY 2011 FY 2012 FY 2013 FY 2014Measure Actual Target YTD Projection Projection ProjectionNumber <strong>of</strong> consumer education and outreachmeetings/encounters attended 145 150 135 160 160 165Percentage <strong>of</strong> consumer complaints closed 92% 90% 100% 90% 90% 90%<strong>Office</strong> <strong>of</strong> <strong>the</strong> People’s CounselB-148FY 2013 Proposed <strong>Budget</strong> and <strong>Financial</strong> Plan
Department <strong>of</strong> Insurance,Securities, and Banking(SR0)www.disb.dc.govTelephone: 202-727-8000% ChangeFY 2011 FY 2012 FY 2013 fromDescription Actual Approved Proposed FY 2012Operating <strong>Budget</strong> $14,026,336 $17,042,318 $20,860,023 22.4FTEs 99.6 111.8 125.6 12.4The mission <strong>of</strong> <strong>the</strong> Department <strong>of</strong> Insurance, Securities, and Banking (DISB)is two-fold: 1) Consumer protection by providing thorough, efficient, andprompt regulatory supervision <strong>of</strong> financial services firms operating in <strong>the</strong>District <strong>of</strong> Columbia; and 2) Economic development by creating conditionsthat will attract and retain financial service firms to <strong>the</strong> District <strong>of</strong> Columbia.Summary <strong>of</strong> ServicesDISB regulates <strong>the</strong> following financial services entities and financial market activities: (1) insurance companies,insurance producers, health maintenance organizations, captive insurance companies, and risk retention groups; (2)investment advisors, investment advisor representatives, broker-dealers, broker-dealer agents, securities <strong>of</strong>ferings,issuers, and agents <strong>of</strong> issuers; and (3) District and state-chartered banks, mortgage lenders and brokers, mortgageloan originators, check cashers, money transmitters, consumer-sales-finance companies, money lenders, and consumer-credit-serviceorganizations.The agency’s FY 2013 proposed budget is presented in <strong>the</strong> following tables:FY 2013 Proposed <strong>Budget</strong> and <strong>Financial</strong> PlanDepartment <strong>of</strong> Insurance, Securities, and BankingB-149
FY 2013 Proposed Gross Funds Operating <strong>Budget</strong>, by Revenue TypeTable SR0-1 contains <strong>the</strong> proposed FY 2013 agency budget compared to <strong>the</strong> FY 2012 approved budget. It alsoprovides <strong>the</strong> FY 2010 and FY 2011 actual expenditures.Table SR0-1(dollars in thousands)ChangeActual Actual Approved Proposed from PercentAppropriated Fund FY 2010 FY 2011 FY 2012 FY 2013 FY 2012 Change*General FundSpecial Purpose Revenue Funds 14,953 13,753 17,042 17,868 826 4.8Total for General Fund 14,953 13,753 17,042 17,868 826 4.8Federal ResourcesFederal Grant Funds 0 115 0 2,544 2,544 N/ATotal for Federal Resources 0 115 0 2,544 2,544 N/APrivate FundsPrivate Grant Funds 0 59 0 448 448 N/ATotal for Private Funds 0 59 0 448 448 N/AIntra-District FundsIntra-District Funds 60 100 0 0 0 N/ATotal for Intra-District Funds 60 100 0 0 0 N/AGross Funds 15,013 14,026 17,042 20,860 3,818 22.4*Percent change is based on whole dollars.Note: If applicable, for a breakdown <strong>of</strong> each Grant (Federal and Private), Special Purpose Revenue type and Intra-District agreement,please refer to Schedule 80 <strong>Agency</strong> Summary by Revenue Source in <strong>the</strong> FY 2013 Operating Appendices located on <strong>the</strong> <strong>Office</strong> <strong>of</strong> <strong>the</strong><strong>Chief</strong> <strong>Financial</strong> <strong>Office</strong>r’s website.Department <strong>of</strong> Insurance, Securities, and BankingB-150FY 2013 Proposed <strong>Budget</strong> and <strong>Financial</strong> Plan
FY 2013 Proposed Full-Time Equivalents, by Revenue TypeTable SR0-2 contains <strong>the</strong> proposed FY 2013 FTE level compared to <strong>the</strong> FY 2012 approved FTE level by revenuetype. It also provides FY 2010 and FY 2011 actual data.Table SR0-2ChangeActual Actual Approved Proposed from PercentAppropriated Fund FY 2010 FY 2011 FY 2012 FY 2013 FY 2012 ChangeGeneral FundSpecial Purpose Revenue Funds 92.4 99.6 111.8 114.6 2.8 2.5Total for General Fund 92.4 99.6 111.8 114.6 2.8 2.5Federal ResourcesFederal Grant Funds 0.0 0.0 0.0 8.0 8.0 N/ATotal for Federal Resources 0.0 0.0 0.0 8.0 8.0 N/APrivate FundsPrivate Grant Funds 0.0 0.0 0.0 3.0 3.0 N/ATotal for Private Funds 0.0 0.0 0.0 3.0 3.0 N/ATotal Proposed FTEs 92.4 99.6 111.8 125.6 13.8 12.4FY 2013 Proposed <strong>Budget</strong> and <strong>Financial</strong> PlanDepartment <strong>of</strong> Insurance, Securities, and BankingB-151
FY 2013 Proposed Operating <strong>Budget</strong>, by Comptroller Source GroupTable SR0-3 contains <strong>the</strong> proposed FY 2013 budget at <strong>the</strong> Comptroller Source Group (object class) level comparedto <strong>the</strong> FY 2012 approved budget. It also provides FY 2010 and FY 2011 actual expenditures.Table SR0-3(dollars in thousands)ChangeActual Actual Approved Proposed from PercentComptroller Source Group FY 2010 FY 2011 FY 2012 FY 2013 FY 2012 Change*11 - Regular Pay - Continuing Full Time 8,324 7,722 9,304 11,085 1,780 19.112 - Regular Pay - O<strong>the</strong>r 389 433 252 330 78 31.013 - Additional Gross Pay 251 603 113 113 0 0.014 - Fringe Benefits - Current Personnel 1,675 1,615 1,934 2,323 389 20.115 - Overtime Pay 1 2 21 21 0 0.0Subtotal Personal Services (PS) 10,640 10,375 11,624 13,871 2,247 19.320 - Supplies and Materials 38 14 75 56 -19 -25.331 - Telephone, Telegraph, Telegram, Etc. 72 75 85 87 2 2.332 - Rentals - Land and Structures 2,013 1,643 1,763 1,868 105 5.933 - Janitorial Services 0 0 23 0 -23 -100.035 - Occupancy Fixed Costs 7 0 0 33 33 N/A40 - O<strong>the</strong>r Services and Charges 823 594 1,334 1,435 101 7.641 - Contractual Services - O<strong>the</strong>r 10 11 200 629 429 214.550 - Subsidies and Transfers 1,072 1,087 1,337 2,339 1,002 74.970 - Equipment and Equipment Rental 338 228 602 543 -59 -9.8Subtotal Nonpersonal Services (NPS) 4,372 3,652 5,418 6,989 1,571 29.0Gross Funds 15,013 14,026 17,042 20,860 3,818 22.4*Percent change is based on whole dollars.Division DescriptionThe Department <strong>of</strong> Insurance, Securities and Banking operates through <strong>the</strong> following 9 divisions:Insurance Bureau - monitors <strong>the</strong> financial solvency <strong>of</strong> insurance companies and Health MaintenanceOrganizations (HMO) operating in <strong>the</strong> District <strong>of</strong> Columbia; issues licenses to insurance companies, insuranceproducers, and related entities; resolves consumer complaints; approves rates and policy forms <strong>of</strong> insuranceproducts marketed in <strong>the</strong> District; and monitors underwriting, policy holder services, claims, marketing, producerlicensing, and <strong>the</strong> complaint handling processes <strong>of</strong> licensed insurers to ensure a viable insurance market in <strong>the</strong>District.This division contains <strong>the</strong> following 5 activities:■ Insurance Products - reviews all types <strong>of</strong> insurance policy forms and actuarial memoranda to determinewhe<strong>the</strong>r <strong>the</strong>y conform to District insurance laws and regulations; analyzes rating rules, rate manuals and ratingschedules; and conducts actuarial and statistical analysis <strong>of</strong> rate increase requests, maintaining a database forclaims and investment experience;■ <strong>Financial</strong> Surveillance - provides solvency and compliance monitoring, rate approval, and technical assistancefor <strong>the</strong> insurance industry, o<strong>the</strong>r regulators, and <strong>the</strong> public so that <strong>the</strong>re is a viable insurance market in <strong>the</strong>District;Department <strong>of</strong> Insurance, Securities, and BankingB-152FY 2013 Proposed <strong>Budget</strong> and <strong>Financial</strong> Plan
■■■Health Maintenance Organization (HMO) - provides solvency and compliance monitoring, rate approval,and technical assistance for <strong>the</strong> HMO industry, o<strong>the</strong>r regulators, and <strong>the</strong> public so that <strong>the</strong>re is a viablemanaged care insurance market in <strong>the</strong> District;DC Market Operations Insurance - provides for administrative support and <strong>the</strong> required tools for <strong>the</strong> bureauto achieve operational and programmatic results; andHealth Insurance Review - reviews health insurance rate filings submitted for products sold in <strong>the</strong> District toensure compliance with District law and federal health care reform, and conducts analysis on rate filing trendsand provides consumer information on health insurance rates.Securities Bureau - oversees <strong>the</strong> regulatory activities <strong>of</strong> stock brokerage and investment firms in <strong>the</strong> District toproactively protect District residents against malpractice and fraud by securities pr<strong>of</strong>essionals, and to ensureproper marketing and disclosure <strong>of</strong> securities products in compliance with <strong>the</strong> District Code.This division contains <strong>the</strong> following 4 activities:■ Corporate Finance - reviews and analyzes securities <strong>of</strong>ferings to investors to ensure full disclosure with <strong>the</strong>District’s securities laws;■ Securities Examinations – provides public information and performs examinations <strong>of</strong> financial condition andregulatory compliance <strong>of</strong> securities firms and <strong>the</strong>ir representatives so that <strong>the</strong>y can have effective measures forachieving compliance with <strong>the</strong> District Code;■ Securities Licensing – reviews and approves, subject to District laws, investment advisors, investment advisorrepresentatives, broker-dealers, and broker-dealer agents doing business in <strong>the</strong> District; and■ DC Market Operations Securities – provides for administrative support and <strong>the</strong> required tools for <strong>the</strong> bureauto achieve operational and programmatic results.Enforcement Bureau - directs programs designed to detect and take actions against individuals and companiesengaged in fraudulent financial operations and services, and investigate compliance complaints.This division contains <strong>the</strong> following 3 activities:■ Enforcement – ensures observance <strong>of</strong> District laws by providing remedies to individuals, insurance, securitiesand banking entities and o<strong>the</strong>r jurisdictions in order to prevent, detect, and prosecute insurance, securities andbanking fraudulent activities;■ Investigations – responds to inquiries and complaints from consumers, and investigates and establishes <strong>the</strong>underlying facts to ensure adherence with <strong>the</strong> District’s financial services and relevant consumer protection laws;and■ DC Market Compliance Enforcement – provides technical and administrative authority for <strong>the</strong> bureau toachieve operational and programmatic results.Banking Bureau - regulates <strong>the</strong> activities <strong>of</strong> depository and non-depository financial institutions within <strong>the</strong> Districtto protect consumers from unfair practices by conducting timely financial examinations and providing a fairfinancial market that benefits District consumers and businesses.This division contains <strong>the</strong> following 4 activities:■ State Small Business Credit Initiative – reviews and approves applications submitted by participating financialinstitutions to determine eligibility to receive federal and local SSBCI matching funds;■ Licensing – reviews and approves, subject to District laws, District chartered banks, mortgage lenders andbrokers, loan originators, money transmitters, check cashers, money lenders, and consumer credit serviceorganizations doing business in <strong>the</strong> District;■ Market Services – administers <strong>the</strong> foreclosure mediation, Certified Capital Company (CAPCO), and CapitalAccess (CAP) programs; andFY 2013 Proposed <strong>Budget</strong> and <strong>Financial</strong> PlanDepartment <strong>of</strong> Insurance, Securities, and BankingB-153
■DC Market Operations Banking – provides for administrative support and <strong>the</strong> required tools for <strong>the</strong> bureauto achieve operational and programmatic results.Risk Finance Bureau – reviews and approves licensing applications for <strong>the</strong> formation <strong>of</strong> captive insurance companiesand maintains regulatory oversight <strong>of</strong> captive insurers and risk retention groups that operate or plan to do businessin <strong>the</strong> District.This division contains <strong>the</strong> following 4 activities:■ Compliance – provides solvency and compliance monitoring, and technical assistance for <strong>the</strong> captive insuranceindustry and o<strong>the</strong>r regulators to maintain a viable alternative insurance market in <strong>the</strong> District;■ <strong>Financial</strong> Analysis – analyzes financial and actuarial reports to ensure captive insurance companies and riskretention groups maintain capital and surplus required under District law;■ Regulatory Review and Licensing – reviews and approves, subject to District laws, licensing applications <strong>of</strong>captive insurance companies and risk retention groups; and provides technical assistance to o<strong>the</strong>r regulators;and■ DC Market Operations Risk Finance – provides for administrative support and <strong>the</strong> required tools for <strong>the</strong>bureau to achieve operational and programmatic results.Market Examinations Bureau – conducts on-site examinations <strong>of</strong> all domiciled insurance companies; inspectsDistrict-based investment advisers and broker-dealers, District-chartered banks, and non-depository financial servicesinstitutions doing business in <strong>the</strong> District; monitors solvency <strong>of</strong> financial firms doing business in <strong>the</strong> District<strong>of</strong> Columbia; and develops comprehensive analysis <strong>of</strong> financial services market to identify current and emergingsystematic issues and coordinate regulatory actions.This division contains <strong>the</strong> following 5 activities:■ Insurance Exams – provides solvency and compliance monitoring <strong>of</strong> insurance companies to ensurecompliance with District laws;■ Securities Exams – performs examinations <strong>of</strong> financial condition and regulatory compliance <strong>of</strong> securities firmsand <strong>the</strong>ir representatives;■ Banking Exams – provides chartering, examination and enforcement services pertaining to District charteredbanks and District licensed non-depository institutions;■ Risk Finance Exams – provides solvency and compliance monitoring, and technical assistance for captiveinsurance industry and o<strong>the</strong>r regulators; and■ DC Market Compliance Exams – provides technical and administrative authority over <strong>the</strong> MarketExaminations process.Compliance Analysis Bureau – provides research and analysis <strong>of</strong> industry sectors to establish best practices, andcoordinates information from <strong>the</strong> Market Examinations Bureau with o<strong>the</strong>r Bureaus to identify and define key marketfactors that drive changes in each industry sector.This division contains <strong>the</strong> following 3 activities:■ Consumer Services – Reviews consumer complaints regarding financial institutions and firms operating in <strong>the</strong>District to determine compliance with District laws and regulations, and conducts analysis and investigatesmatters regarding consumer issues;■ Market Research Analysis – provides research and analysis <strong>of</strong> industry sectors to establish “best practices”standards and guidelines for design, delivery, and results monitoring <strong>of</strong> financial products and services; and■ DC Market Compliance Analysis – provides technical and administrative authority over Consumer Servicesand Market Research Analysis.Department <strong>of</strong> Insurance, Securities, and BankingB-154FY 2013 Proposed <strong>Budget</strong> and <strong>Financial</strong> Plan
<strong>Agency</strong> Management - provides for administrative support and <strong>the</strong> required tools to achieve operational andprogrammatic results. This division is standard for all agencies using performance-based budgeting.<strong>Agency</strong> <strong>Financial</strong> Operations – provides comprehensive and efficient financial management services to, and onbehalf <strong>of</strong>, District agencies so that <strong>the</strong> financial integrity <strong>of</strong> <strong>the</strong> District <strong>of</strong> Columbia is maintained. This division isstandard for all agencies using performance-based budgeting.Division Structure ChangeThere have been changes in <strong>the</strong> operations and compliance reporting structure within <strong>the</strong> Department aimed atproviding more comprehensive analysis <strong>of</strong> market conditions and more robust consumer protection capabilities.The realignment outlining <strong>the</strong>se changes was approved on November 10, 2011.FY 2013 Proposed Operating <strong>Budget</strong> and FTEs, by Division and ActivityTable SR0-4 contains <strong>the</strong> proposed FY 2013 budget by division and activity compared to <strong>the</strong> FY 2012 approved budget.It also provides <strong>the</strong> FY 2011 actual data.Table SR0-4(dollars in thousands)Dollars in ThousandsFull-Time EquivalentsChangeChangeActual Approved Proposed from Actual Approved Proposed fromDivision/Activity FY 2011 FY 2012 FY 2013 FY 2012 FY 2011 FY 2012 FY 2013 FY 2012(1000) <strong>Agency</strong> Management Program(1010) Personnel 92 98 171 73 1.0 1.0 2.0 1.0(1017) Labor Partnership 72 70 0 -70 1.0 1.0 0.0 -1.0(1040) <strong>Office</strong> <strong>of</strong> Info Tech and Support 885 922 5,446 4,524 7.8 11.0 14.0 3.0(1055) Risk Management 359 248 0 -248 4.9 2.0 0.0 -2.0(1080) Public Affairs 310 325 785 460 2.9 3.0 5.0 2.0(1090) Performance Management 478 569 390 -178 3.0 4.0 3.0 -1.0(1095) Consumer Protection 111 0 0 0 2.9 0.0 0.0 0.0Subtotal (1000) <strong>Agency</strong> Management Program 2,307 2,233 6,792 4,560 23.5 22.0 24.0 2.0(100F) <strong>Agency</strong> <strong>Financial</strong> Operations(110F) <strong>Budget</strong> Operation 165 127 140 13 1.0 1.0 1.0 0.0(120F) Accounting Operations 383 386 384 -2 3.9 4.0 4.0 0.0(130F) ACFO 163 173 176 3 1.0 1.0 1.0 0.0Subtotal (100F) <strong>Agency</strong> <strong>Financial</strong> Operations 711 685 700 14 5.9 6.0 6.0 0.0(2000) Insurance Program(2010) Insurance Products -13 0 981 981 0.0 0.0 7.5 7.5(2015) <strong>Financial</strong> Surveillance 0 0 670 670 0.0 0.0 5.3 5.3(2020) Consumer and Pr<strong>of</strong> Licensing -16 0 0 0 0.0 0.0 0.0 0.0(2030) <strong>Financial</strong> Examination -12 0 0 0 0.0 0.0 0.0 0.0(2040) Forms Analysis 2,318 3,149 0 -3,149 5.9 6.0 0.0 -6.0(2045) Market Conduct 238 177 0 -177 1.0 1.0 0.0 -1.0(2050) HMO 483 623 918 295 1.0 3.0 8.8 5.8(2055) Consumer Services 569 1,071 0 -1,071 5.9 11.0 0.0 -11.0(2060) Pr<strong>of</strong>essional Services 460 521 0 -521 4.9 6.0 0.0 -6.0(2065) <strong>Financial</strong> Regulatory 589 683 0 -683 5.7 7.3 0.0 -7.3(2070) Actuarial Analysis 311 379 0 -379 3.9 4.5 0.0 -4.5(2080) DC Market Operations Insurance 0 0 131 131 0.0 0.0 0.2 0.2(2090) Health Insurance Review 115 0 1,325 1,325 0.0 0.0 7.0 7.0Subtotal (2000) Insurance Program 5,041 6,603 4,026 -2,577 28.1 38.8 28.8 -10.0(3000) Securities Program(3010) Corporate Finance 1,346 0 627 627 4.4 0.0 5.5 5.5(3020) Securities Examination 580 0 1 1 5.1 0.0 0.0 0.0(Continued on next page)FY 2013 Proposed <strong>Budget</strong> and <strong>Financial</strong> PlanDepartment <strong>of</strong> Insurance, Securities, and BankingB-155
Table SR0-4 (Continued)(dollars in thousands)Dollars in ThousandsFull-Time EquivalentsChangeChangeActual Approved Proposed from Actual Approved Proposed fromDivision/Activity FY 2011 FY 2012 FY 2013 FY 2012 FY 2011 FY 2012 FY 2013 FY 2012(3030) Securities Licensing 340 0 515 515 4.2 0.0 4.5 4.5(3080) DC Market Operations Securities 0 0 180 180 0.0 0.0 0.2 0.2Subtotal (3000) Securities Program 2,266 0 1,323 1,323 13.7 0.0 10.2 10.2(4000) Enforcement Program(4010) Compliance 9 0 0 0 0.0 0.0 0.0 0.0(4020) Investigative 54 0 0 0 0.0 0.0 0.0 0.0(4050) Enforcement 184 207 417 210 2.5 1.5 3.5 2.0(4060) Investigations 677 821 812 -8 6.4 7.5 7.5 0.0(4080) DC Market Compliance Enforcement 0 0 86 86 0.0 0.0 0.3 0.3Subtotal (4000) Enforcement Program 924 1,028 1,316 288 8.8 9.0 11.4 2.3(5000) Banking(5010) Depository -7 0 0 0 0.0 0.0 0.0 0.0(5015) SSBCI 0 0 1,219 1,219 0.0 0.0 1.0 1.0(5020) Non Depository 66 0 0 0 0.0 0.0 0.0 0.0(5055) Examination 1,576 0 0 0 7.3 0.0 0.0 0.0(5060) Licensing 0 0 389 389 5.4 0.0 4.5 4.5(5070) Market Services 0 0 811 811 0.0 0.0 5.5 5.5(5080) DC Market Operations Banking 0 0 168 168 0.0 0.0 0.2 0.2Subtotal (5000) Banking 1,635 0 2,587 2,587 12.7 0.0 11.2 11.2(6000) Risk Finance(6010) Compliance -3 0 323 323 0.0 0.0 2.5 2.5(6020) <strong>Financial</strong> Analysis 1,145 1,511 1 -1,510 6.8 8.0 0.0 -8.0(6030) Regulatory Review and Licensing 0 0 240 240 0.0 0.0 2.5 2.5(6080) DC Market Operations Risk Finance 0 0 79 79 0.0 0.0 0.2 0.2Subtotal (6000) Risk Finance 1,142 1,511 643 -867 6.8 8.0 5.2 -2.8(7000) Securities and Banking(7010) Corporate Finance 0 2,951 0 -2,951 0.0 7.5 0.0 -7.5(7020) Securities and Banking Examination 0 1,226 0 -1,226 0.0 11.2 0.0 -11.2(7030) Securities and Banking Licensing 0 805 0 -805 0.0 9.2 0.0 -9.2Subtotal (7000) Securities and Banking 0 4,983 0 -4,983 0.0 28.0 0.0 -28.0(8000) Market Examinations(8010) Insurance Exams 0 0 341 341 0.0 0.0 3.2 3.2(8020) Securities Exams 0 0 509 509 0.0 0.0 4.2 4.2(8030) Banking Exams 0 0 583 583 0.0 0.0 5.2 5.2(8040) Risk Finance Exams 0 0 424 424 0.0 0.0 3.2 3.2(8080) DC Market Compliance Exams 0 0 166 166 0.0 0.0 0.3 0.3Subtotal (8000) Market Examinations 0 0 2,023 2,023 0.0 0.0 16.3 16.3(9000) Compliance Analysis(9010) Consumer Services 0 0 733 733 0.0 0.0 7.0 7.0(9020) Market Research Analysis 0 0 542 542 0.0 0.0 5.0 5.0(9080) DC Market Compliance Analysis 0 0 174 174 0.0 0.0 0.3 0.3Subtotal (9000) Compliance Analysis 0 0 1,449 1,449 0.0 0.0 12.3 12.3Total Proposed Operating <strong>Budget</strong> 14,026 17,042 20,860 3,818 99.6 111.8 125.6 13.8(Change is calculated by whole numbers and numbers may not add up due to rounding)Note: For more detailed information regarding <strong>the</strong> proposed funding for <strong>the</strong> activities within this agency’s divisions, please see Schedule 30-PBBProgram Summary by Activity in <strong>the</strong> FY 2013 Operating Appendices located on <strong>the</strong> <strong>Office</strong> <strong>of</strong> <strong>the</strong> <strong>Chief</strong> <strong>Financial</strong> <strong>Office</strong>r’s website.Department <strong>of</strong> Insurance, Securities, and BankingB-156FY 2013 Proposed <strong>Budget</strong> and <strong>Financial</strong> Plan
FY 2013 Proposed <strong>Budget</strong> ChangesThe Department <strong>of</strong> Insurance, Securities and Bankings’ (DISB) proposed FY 2013 gross budget is $20,860,023,which represents a 22.4 percent increase over its FY 2012 approved gross budget <strong>of</strong> $17,042,318. The budget iscomprised <strong>of</strong> $17,868,052 in Special Purpose Revenue funds, $2,544,319 in Federal Grant funds, and $447,652in Private Grant funds.Initial Adjusted <strong>Budget</strong>Create: In FY 2013, DISB has been awarded Federal Grant funding for <strong>the</strong> State Small Business Credit Initiative(SSBCI) and Health Insurance Rate Review (HIRR). Funds from <strong>the</strong> SSBCI grant may be used to guaranteeloans from District banking institutions made to small businesses. The agency will allocate <strong>the</strong>se funds in <strong>the</strong>Banking program by budgeting $1,000,000 in Subsidies and Transfers, $142,318 for 1.0 FTE in personal services,and $76,145 for Supplies, Equipment, and O<strong>the</strong>r Services and Charges. Funds from <strong>the</strong> HIRR grant will be usedto support activities associated with <strong>the</strong> Affordable Care Act, which aims to improve <strong>the</strong> current health care systemby increasing access to health coverage for Americans. HIRR funds, budgeted in <strong>the</strong> Insurance division, willinclude $827,164 for 7.0 FTEs in personal services, $250,856 in O<strong>the</strong>r Services and Charges and Equipment, and$245,000 in Contractual Services.Enhance: DISB will dedicate $238,428 in personal services for 3.0 FTEs and $208,616 in contracts from PrivateGrant funding. These funds were not available during FY 2012 and will be used to enhance services provided in<strong>the</strong> Banking division.Cost Increase: The budget proposal includes an additional 2.8 FTEs and $999,273 in Special Purpose Revenuefunds to cover projected step increases, increases in <strong>the</strong> Fringe Benefit rate, and alignment <strong>of</strong> <strong>the</strong> budgets based onhistorical spending patterns. The provisional fixed costs assessment from <strong>the</strong> <strong>Office</strong> <strong>of</strong> <strong>the</strong> <strong>Chief</strong> Technology <strong>Office</strong>rwill increase by $117,073 in Special Purpose Revenue funds.Cost Decrease: The proposed budget includes several adjustments to Special Purpose Revenues to partially <strong>of</strong>fset<strong>the</strong> proposal for cost increases. DISB will reduce its purchases <strong>of</strong> computers and equipment for savings <strong>of</strong>$197,999. The agency will save an additional $84,159 by reducing its postage and printing needs. O<strong>the</strong>r effortsto streamline operations will result in decreases <strong>of</strong> $24,550 in consulting and Contractual Services and $21,931 inSupplies and Materials.Additionally Adjusted <strong>Budget</strong>Technical Adjustment: Adjustment <strong>of</strong> Fringe Benefits to restore <strong>the</strong> District Government contribution foremployee health insurance from 72 percent, implemented in <strong>the</strong> FY 2011 budget, to 75 percent in FY 2013,resulting in increases <strong>of</strong> $2,836 in Federal Grant funds, $608 in Private Grant funds, and $36,428 in SpecialPurpose Revenue funds.Policy InitiativeAn initiative that will enhance <strong>the</strong> captive insurance company program, which will attract more captive insurancecompanies to <strong>the</strong> District, is reflected in an increase <strong>of</strong> $1,600 in Special Purpose Revenue funds.FY 2013 Proposed <strong>Budget</strong> and <strong>Financial</strong> PlanDepartment <strong>of</strong> Insurance, Securities, and BankingB-157
FY 2012 Approved <strong>Budget</strong> to FY 2013 Proposed <strong>Budget</strong>, by Revenue TypeTable SR0-5 itemizes <strong>the</strong> changes by revenue type between <strong>the</strong> FY 2012 approved budget and <strong>the</strong> FY 2013 proposedbudget.Table SR0-5(dollars in thousands)PROGRAM BUDGET FTEFEDERAL GRANT FUNDS: FY 2012 Approved <strong>Budget</strong> and FTE 0 0.0Create: Subsidies and Transfers for <strong>the</strong> State Small Banking 1,000 0.0Business Credit Initiative (SSBCI)Create: SSBCI personal services projection Banking 142 1.0Create: Supplies, Equipment, and O<strong>the</strong>r Services and Banking 76 0.0Charges for SSBCICreate: Health Insurance Rate Review (HIRR) personal Insurance Program 827 7.0services projectionCreate: O<strong>the</strong>r Services and Charges and Equipment for HIRR Insurance Program 251 0.0Create: Contractual Services for HIRR Insurance Program 245 0.0FY 2013 Initial Adjusted <strong>Budget</strong> 2,541 8.0Technical Adjustment: Health insurance contribution Multiple Programs 3 0.0FY 2013 Additionally Adjusted <strong>Budget</strong> 2,544 8.0FEDERAL GRANT FUNDS: FY 2013 Proposed <strong>Budget</strong> and FTE 2,544 8.0PRIVATE GRANT FUNDS: FY 2012 Approved <strong>Budget</strong> and FTE 0 0.0Enhance: Salary and Fringe Benefits Banking 238 3.0Enhance: Contractual Services Banking 209 0.0FY 2013 Initial Adjusted <strong>Budget</strong> 447 3.0Technical Adjustment: Health insurance contribution Multiple Programs 1 0.0FY 2013 Additionally Adjusted <strong>Budget</strong> 448 3.0PRIVATE GRANT FUNDS: FY 2013 Proposed <strong>Budget</strong> and FTE 448 3.0SPECIAL PURPOSE REVENUE FUNDS: FY 2012 Approved <strong>Budget</strong> and FTE 17,042 111.8Cost Increase: Align personal services with projected Multiple Programs 999 2.8expensesCost Increase: Adjustments for fixed costs based on assessments <strong>Agency</strong> Management Program 117 0.0from <strong>the</strong> <strong>Office</strong> <strong>of</strong> <strong>the</strong> <strong>Chief</strong> Technology <strong>Office</strong>rCost Decrease: Computer and equipment purchases <strong>Agency</strong> Management Program -198 0.0Cost Decrease: Savings derived from improved technology Multiple Programs -84 0.0and reductions in Postage and PrintingCost Decrease: Consultant and Contractual Services Multiple Programs -25 0.0Cost Decrease: Supplies and Materials <strong>Agency</strong> Management Program -22 0.0FY 2013 Initial Adjusted <strong>Budget</strong> 17,830 114.6Technical Adjustment: Health insurance contribution Multiple Programs 36 0.0FY 2013 Additionally Adjusted <strong>Budget</strong> 17,866 114.6FY 2013 Policy InitiativesCost Increase: Align with additional resources <strong>Agency</strong> Management Program 2 0.0SPECIAL PURPOSE REVENUE FUNDS: FY 2013 Proposed <strong>Budget</strong> and FTE 17,868 114.6Gross for SR0 - Department <strong>of</strong> Insurance, Securities, and Banking 20,860 125.6(Change is calculated by whole numbers and numbers may not add up due to rounding)Department <strong>of</strong> Insurance, Securities, and BankingB-158FY 2013 Proposed <strong>Budget</strong> and <strong>Financial</strong> Plan
<strong>Agency</strong> Performance PlanThe agency’s performance plan has <strong>the</strong> following objectives for FY 2013:1. <strong>Agency</strong> ManagementObjective 1: Increase <strong>the</strong> affordability and availability <strong>of</strong> health insurance coverage.Objective 2: Protect DC citizens from insurance, securities and banking fraud through prevention, detection andenforcement.Objective 3: Improve consumer confidence in, and increase availability <strong>of</strong>, financial services to District residents.Objective 4: Support agency bureaus through effective management.<strong>Agency</strong> Performance MeasuresFY 2010 FY 2011 FY 2011 FY 2012 FY 2013 FY 2014Measure Actual Target Actual Projection Projection ProjectionNumber residents insured by high risk healthNotinsurance pool 285 314 1,692 0.00 2,200 AvailableNumber medical malpractice insurance premium Not Notrate filings > 10 percent increase reviewed Available Available 0.00 0.00 0.00 0.00Percentage <strong>of</strong> written Insurance complaints resolvedwithin 45 days <strong>of</strong> receipt 96% 90% 100% 95% 95% 95%Percentage <strong>of</strong> open investigative cases reviewedwithin 90 days for correctness and compliance toinvestigative procedures 100% 100% 100% 95% 96% 97%Number <strong>of</strong> administrative hearings conductedregarding violations <strong>of</strong> producer licensing laws 34 28 28 0 21 20Number <strong>of</strong> District residents receiving financialliteracy training and information 1,118 700 1,746 800 900 1,000Percentage <strong>of</strong> CAPCOs examined 100% 100% 100% 100% 100% 100%Percentage <strong>of</strong> DC residents who participated in <strong>the</strong>Foreclosure Mediation program 97% 85% 100% 85% 25% 25%Percentage <strong>of</strong> DC based investment firmsexamined annually 6.63% 25% 100% 95% 100% 100%Percentage <strong>of</strong> banking complaints resolved withinNot45 days <strong>of</strong> receipt 98% 85% Available 95% 85% 85%Number <strong>of</strong> Captive Insurance Company applicationsprocessed within 30 Days <strong>of</strong> receipt 100% 100% 100% 100% 100% 100%Percentage <strong>of</strong> scheduled financial examinationscompleted annually on Captive Insurance Companies 100% 100% 100% 100% 100% 100%Percentage <strong>of</strong> Security Notice filings processedwithin 30 days <strong>of</strong> receipt 53% 90% 99% 85% 80% 80%FY 2013 Proposed <strong>Budget</strong> and <strong>Financial</strong> PlanDepartment <strong>of</strong> Insurance, Securities, and BankingB-159
2. Banking BureauObjective 1: Improve consumer confidence.Banking BureauFY 2010 FY 2011 FY 2011 FY 2012 FY 2013 FY 2014Measure Actual Target Actual Projection Projection ProjectionPercentage <strong>of</strong> DC Residents who participated in <strong>the</strong>Foreclosure Mediation Program 97% 85% 100% 85% 25% 25%Percentage <strong>of</strong> written complaints resolved within45 days <strong>of</strong> receipt 98% 85% 100% 85% 85% 85%3. Enforcement and Investigation BureauObjective 1: Improve <strong>the</strong> DISB insurance, securities and banking consumer protection anti-fraud program.Objective 2: Protect DC Residents from Fraudulent Insurance Producer activities.Enforcement and Investigation BureauFY 2010 FY 2011 FY 2011 FY 2012 FY 2013 FY 2014Measure Actual Target Actual Projection Projection ProjectionPercentage <strong>of</strong> open investigative cases reviewedwithin 90 days for correctness and compliance with 100% 90% 100% 90% 96% 97%investigative proceduresPercentage <strong>of</strong> agent enforcement investigations Not Notcompleted within 60 days Available Available 0.00 85% 86% 87%Percentage <strong>of</strong> written complaints resolved within45 days <strong>of</strong> receipt 98% 85% 100% 95.00% 95.00% 95%Department <strong>of</strong> Insurance, Securities, and BankingB-160FY 2013 Proposed <strong>Budget</strong> and <strong>Financial</strong> Plan
4. Compliance Analysis Division (CAD)Objective 1: Improve <strong>the</strong> overall consumer protection capabilities <strong>of</strong> <strong>the</strong> Compliance Analysis Division.Objective 2: Improve <strong>the</strong> DISB Consumer Advocate - Anti-fraud Program.5. Insurance BureauObjective 1: Increase <strong>the</strong> affordability and availability <strong>of</strong> health insurance coverage.Objective 2: Post consumer insurance information to DISB website.Insurance BureauFY 2010 FY 2011 FY 2011 FY 2012 FY 2013 FY 2014Measure Actual Target Actual Projection Projection ProjectionPercentage <strong>of</strong> rate and form filings approved,accepted or rejected within 30 days <strong>of</strong> receipt 92.7% 95% 94.73% 87.50% 90.00% 90.00%6. <strong>Office</strong> <strong>of</strong> <strong>the</strong> CommunicationsObjective 1: Improve <strong>the</strong> DISB Anti-fraud Consumer Protection.Objective 2: Increase <strong>the</strong> amount <strong>of</strong> consumer insurance information available on <strong>the</strong> DISB website.Objective 3: Improve consumer confidence.<strong>Office</strong> <strong>of</strong> <strong>the</strong> CommunicationsFY 2010 FY 2011 FY 2011 FY 2012 FY 2013 FY 2014Measure Actual Target Actual Projection Projection ProjectionNumber <strong>of</strong> District residents receiving financial literacytraining and consumer protection information 1,118 700 1,746 800 900 1,000FY 2013 Proposed <strong>Budget</strong> and <strong>Financial</strong> PlanDepartment <strong>of</strong> Insurance, Securities, and BankingB-161
7. Risk Finance BureauObjective 1: Improve consumer confidence.Risk Finance BureauFY 2010 FY 2011 FY 2011 FY 2012 FY 2013 FY 2014Measure Actual Target Actual Projection Projection ProjectionPercentage <strong>of</strong> Captive Insurance Company applicationsprocessed within 30 days <strong>of</strong> receipt 100% 100% 100% 100% 100% 100%Percentage <strong>of</strong> scheduled financial examinationscompleted annually on Captive Insurance Companies 100% 100% 100% 100% 100% 100%Percentage <strong>of</strong> CAPCOs examined annually 100% 100% 100% 100% 100% 100%8. Securities BureauObjective 1: Improve consumer confidence.Objective 2: Improve securities industry awareness and compliance with conduct and disclosure requirements tobetter serve District residents.Securities BureauFY 2010 FY 2011 FY 2011 FY 2012 FY 2013 FY 2014Measure Actual Target Actual Projection Projection ProjectionPercentage <strong>of</strong> DC based investment firms examinedfor compliance within 12 months 92% 90% 101% 95% 100% 100%Percentage <strong>of</strong> securities notice filings processedwithin 30 days 53% 90% 100% 85% 80% 80%Department <strong>of</strong> Insurance, Securities, and BankingB-162FY 2013 Proposed <strong>Budget</strong> and <strong>Financial</strong> Plan
<strong>Office</strong> <strong>of</strong> Cable Televisionwww.oct.dc.govTelephone: 202-671-0066(CT0)% ChangeFY 2011 FY 2012 FY 2013 fromDescription Actual Approved Proposed FY 2012Operating <strong>Budget</strong> $6,975,985 $8,524,970 $8,591,720 0.8FTEs 31.9 35.5 39.5 11.3The mission <strong>of</strong> <strong>the</strong> <strong>Office</strong> <strong>of</strong> Cable Television (OCT) is to: (1) regulate<strong>the</strong> provision <strong>of</strong> “cable service” in <strong>the</strong> District <strong>of</strong> Columbia (as that termis defined by <strong>the</strong> District’s cable television laws); (2) protect and advance<strong>the</strong> cable television-related interests <strong>of</strong> <strong>the</strong> District and its residents; and(3) produce and cablecast live and recorded video and o<strong>the</strong>r programmingby way <strong>of</strong> <strong>the</strong> District’s public, educational and government(PEG) cable channels.Summary <strong>of</strong> ServicesOCT (1) regulates <strong>the</strong> provision <strong>of</strong> cable television services by <strong>the</strong> District’s cable television franchisees; (2) manages<strong>the</strong> District’s two municipal government channels (TV-13 and TV-16); and (3) manages <strong>the</strong> DistrictKnowledge Network (DKN) (formerly “District Schools Television” (DSTV)). TV-13 provides gavel-to-gavel coverage<strong>of</strong> <strong>the</strong> Council <strong>of</strong> <strong>the</strong> District <strong>of</strong> Columbia. TV-16 provides information regarding <strong>the</strong> many programs, servicesand opportunities made available by <strong>the</strong> Government <strong>of</strong> <strong>the</strong> District <strong>of</strong> Columbia. DKN (<strong>the</strong> District’s reformattedschools/educational cable channel) is designed to provide residents with superior quality educational programmingthat not only fosters and encourages student learning and achievement, but also provides life-long learningopportunities to <strong>the</strong> community. Via <strong>the</strong>se channels, OCT provides to District residents immediate and comprehensiveaccess to <strong>the</strong> activities and processes <strong>of</strong> <strong>the</strong>ir government.OCT is dedicated to providing quality diverse programming and services that seek to educate, enlighten, andempower <strong>the</strong> residents <strong>of</strong> <strong>the</strong> District <strong>of</strong> Columbia. Department performance expectations in FY 2012 are listedby functional division.The agency’s FY 2013 proposed budget is presented in <strong>the</strong> following tables:FY 2013 Proposed <strong>Budget</strong> and <strong>Financial</strong> Plan<strong>Office</strong> <strong>of</strong> Cable TelevisionB-163
FY 2013 Proposed Gross Funds Operating <strong>Budget</strong>, by Revenue TypeTable CT0-1 contains <strong>the</strong> proposed FY 2013 agency budget compared to <strong>the</strong> FY 2012 approved budget. It alsoprovides FY 2010 and FY 2011 actual expenditures.Table CT0-1(dollars in thousands)ChangeActual Actual Approved Proposed from PercentAppropriated Fund FY 2010 FY 2011 FY 2012 FY 2013 FY 2012 Change*General FundSpecial Purpose Revenue Funds 6,685 6,957 8,525 8,592 67 0.8Total for General Fund 6,685 6,957 8,525 8,592 67 0.8Intra-District FundsIntra-District Funds 12 19 0 0 0 N/ATotal for Intra-District Funds 12 19 0 0 0 N/AGross Funds 6,697 6,976 8,525 8,592 67 0.8*Percent change is based on whole dollars.Note: If applicable, for a breakdown <strong>of</strong> each Grant (Federal and Private), Special Purpose Revenue type and Intra-District agreement, pleaserefer to Schedule 80 <strong>Agency</strong> Summary by Revenue Source in <strong>the</strong> FY 2013 Operating Appendices located on <strong>the</strong> <strong>Office</strong> <strong>of</strong> <strong>the</strong> <strong>Chief</strong><strong>Financial</strong> <strong>Office</strong>r’s website.FY 2013 Proposed Full-Time Equivalents, by Revenue TypeTable CT0-2 contains <strong>the</strong> proposed FY 2013 FTE level compared to <strong>the</strong> FY 2012 approved FTE level by revenuetype. It also provides FY 2010 and FY 2011 actual data.Table CT0-2ChangeActual Actual Approved Proposed from PercentAppropriated Fund FY 2010 FY 2011 FY 2012 FY 2013 FY 2012 ChangeGeneral FundSpecial Purpose Revenue Funds 17.8 31.9 35.5 39.5 4.0 11.3Total for General Fund 17.8 31.9 35.5 39.5 4.0 11.3Total Proposed FTEs 17.8 31.9 35.5 39.5 4.0 11.3<strong>Office</strong> <strong>of</strong> Cable TelevisionB-164FY 2013 Proposed <strong>Budget</strong> and <strong>Financial</strong> Plan
FY 2013 Proposed Operating <strong>Budget</strong>, by Comptroller Source GroupTable CT0-3 contains <strong>the</strong> proposed FY 2013 budget at <strong>the</strong> Comptroller Source Group (object class) level comparedto <strong>the</strong> FY 2012 approved budget. It also provides FY 2010 and FY 2011 actual expenditures.Table CT0-3(dollars in thousands)ChangeActual Actual Approved Proposed from PercentComptroller Source Group FY 2010 FY 2011 FY 2012 FY 2013 FY 2012 Change*11 - Regular Pay - Continuing Full Time 2,058 2,143 2,336 2,610 273 11.712 - Regular Pay - O<strong>the</strong>r 342 207 301 277 -24 -8.013 - Additional Gross Pay 25 17 0 0 0 N/A14 - Fringe Benefits - Current Personnel 474 469 498 593 95 19.115 - Overtime Pay 25 39 50 60 10 20.0Subtotal Personal Services (PS) 2,924 2,876 3,186 3,540 355 11.120 - Supplies and Materials 7 16 25 35 10 40.030 - Energy, Comm. and Building Rentals 3 10 173 92 -81 -47.031 - Telephone, Telegraph, Telegram, Etc. 68 70 279 244 -35 -12.532 - Rentals - Land and Structures 1,379 1,448 0 0 0 N/A33 - Janitorial Services 0 0 44 0 -44 -100.034 - Security Services 0 0 0 50 50 N/A35 - Occupancy Fixed Costs 10 0 66 105 38 57.240 - O<strong>the</strong>r Services and Charges 1,200 1,593 2,786 2,583 -203 -7.341 - Contractual Services - O<strong>the</strong>r 352 100 200 253 52 26.250 - Subsidies and Transfers 735 800 800 850 50 6.270 - Equipment and Equipment Rental 19 63 966 841 -125 -13.0Subtotal Nonpersonal Services (NPS) 3,773 4,100 5,339 5,052 -288 -5.4Gross Funds 6,697 6,976 8,525 8,592 67 0.8*Percent change is based on whole dollars.FY 2013 Proposed <strong>Budget</strong> and <strong>Financial</strong> Plan<strong>Office</strong> <strong>of</strong> Cable TelevisionB-165
Division DescriptionThe <strong>Office</strong> <strong>of</strong> Cable Television operates through <strong>the</strong> following 3 divisions:Programming - provides 24-hour informative programming on TV-13, TV-16, and DKN. Programs includegavel-to-gavel coverage <strong>of</strong> Council hearings, Mayoral press conferences and meetings and activities <strong>of</strong> governmentagencies, and live and recorded coverage <strong>of</strong> <strong>the</strong> activities <strong>of</strong> <strong>the</strong> Mayor and District <strong>of</strong> Columbia Public Schools(DCPS). Programming also includes educational resources to support students, parents, teachers and communitymembers.This division contains <strong>the</strong> following 2 activities:■ Originated Programming - provides original television production and programming services for District cableviewers, enabling <strong>the</strong>m to have access to information about citywide events as well as gain information about<strong>the</strong> operation and management <strong>of</strong> <strong>the</strong> District; and■ Fee for Service Programming - provides contracted television production and programming services to Districtgovernment agencies by <strong>of</strong>fering pr<strong>of</strong>essionally produced programs at competitive prices.Regulatory - provides customer service and franchise oversight services for District cable subscribers and for <strong>the</strong>District government to ensure <strong>the</strong>y receive reliable services that comply with District and federal laws andregulations. This program performs <strong>the</strong> regulatory functions <strong>of</strong> <strong>the</strong> agency, which include enforcing (and, whenappropriate, proposing amendments to) <strong>the</strong> provisions <strong>of</strong> <strong>the</strong> District Cable Act; negotiating new cable televisionfranchise agreements; renewing cable franchise agreements with local cable providers; providing general legalcounsel to <strong>the</strong> agency; managing and resolving regulatory and o<strong>the</strong>r disputes between cable operators and <strong>the</strong>District government and/or its residents; and enforcing <strong>the</strong> provisions <strong>of</strong> District cable franchise agreements ando<strong>the</strong>r applicable laws.This division contains <strong>the</strong> following 2 activities:■ Franchise Regulation - provides cable company oversight services for District cable subscribers, allowing <strong>the</strong>mto receive cable television services that are in compliance with District and federal laws and regulations; and■ Customer Service - facilitates complaint resolution, installation, and repair services to District cable subscribersand District government agencies to ensure that <strong>the</strong>y receive reliable cable television service and problemresolutions in a timely manner.<strong>Agency</strong> Management - provides for administrative support and <strong>the</strong> required tools to achieve operational and programmaticresults. This division is standard for all agencies using performance-based budgeting.Division Structure ChangeThe <strong>Office</strong> <strong>of</strong> Cable Television has no division structure changes in <strong>the</strong> FY 2013 proposed budget.<strong>Office</strong> <strong>of</strong> Cable TelevisionB-166FY 2013 Proposed <strong>Budget</strong> and <strong>Financial</strong> Plan
FY 2013 Proposed Operating <strong>Budget</strong> and FTEs, by Division and ActivityTable CT0-4 contains <strong>the</strong> proposed FY 2013 budget by division and activity compared to <strong>the</strong> FY 2012 approvedbudget. It also provides <strong>the</strong> FY 2011 actual data.Table CT0-4(dollars in thousands)Dollars in ThousandsFull-Time EquivalentsChangeChangeActual Approved Proposed from Actual Approved Proposed fromDivision/Activity FY 2011 FY 2012 FY 2013 FY 2012 FY 2011 FY 2012 FY 2013 FY 2012(1000) <strong>Agency</strong> Management Program(1010) Personnel 0 24 0 -24 0.0 0.0 0.0 0.0(1015) Training and Employee Development 15 51 33 -18 0.0 0.0 0.0 0.0(1020) Contracting and Procurement 24 97 69 -28 0.0 1.0 1.0 0.0(1030) Property Management 2,174 2,099 1,783 -316 0.0 0.0 0.0 0.0(1040) Information Technology 31 43 118 76 0.0 0.0 1.0 1.0(1050) <strong>Financial</strong> Management 157 147 150 3 1.0 0.0 0.0 0.0(1070) Fleet Management 43 61 48 -13 0.0 0.0 0.0 0.0(1085) Customer Service 432 722 665 -57 4.4 6.5 6.0 -0.5(1090) Performance Management 244 252 257 5 2.0 2.0 2.0 0.0Subtotal (1000) <strong>Agency</strong> Management Program 3,119 3,496 3,123 -374 7.4 9.5 10.0 0.5(2000) Programming(2100) OCTT Originated Programming 2,653 3,258 3,537 279 15.2 16.5 19.5 3.0(2200) Fee for Service Programming 825 1,348 1,399 51 9.3 9.5 10.0 0.5Subtotal (2000) Programming 3,478 4,606 4,936 330 24.6 26.0 29.5 3.5(3000) Regulatory(3100) Franchise Regulation 0 240 355 115 0.0 0.0 0.0 0.0(3200) Customer Service 378 182 178 -5 0.0 0.0 0.0 0.0Subtotal (3000) Regulatory 378 422 533 111 0.0 0.0 0.0 0.0Total Proposed Operating <strong>Budget</strong> 6,976 8,525 8,592 67 31.9 35.5 39.5 4.0(Change is calculated by whole numbers and numbers may not add up due to rounding)Note: For more detailed information regarding <strong>the</strong> proposed funding for <strong>the</strong> activities within this agency’s divisions, please see Schedule 30-PBBProgram Summary by Activity in <strong>the</strong> FY 2013 Operating Appendices located on <strong>the</strong> <strong>Office</strong> <strong>of</strong> <strong>the</strong> <strong>Chief</strong> <strong>Financial</strong> <strong>Office</strong>r’s website.FY 2013 Proposed <strong>Budget</strong> and <strong>Financial</strong> Plan<strong>Office</strong> <strong>of</strong> Cable TelevisionB-167
FY 2013 Proposed <strong>Budget</strong> ChangesThe <strong>Office</strong> <strong>of</strong> Cable Television’s (OCT) proposed FY 2013 gross budget is $8,591,720, which represents a 0.8percent increase over its FY 2012 approved gross budget <strong>of</strong> $8,524,970. The budget is comprised entirely <strong>of</strong> SpecialPurpose Revenue funds.Initial Adjusted <strong>Budget</strong>Cost Increase: OCT has a Special Purpose Revenue (SPR) fund net increase <strong>of</strong> $344,299 in personal services. Thisreflects increases to salary, steps, and Fringe Benefits, as well as <strong>the</strong> addition <strong>of</strong> 4.0 new full-time equivalentpositions to monitor financial, procurement, and contractual issues, and to provide television production support.To support continuing administrative requirements, <strong>the</strong> agency increased its budget by $52,399 for ContractualServices for production-related contracts, $50,000 for Security Services at its new facility, $50,000 for Subsidies andTransfers, $38,058 for increased Occupancy costs, and $10,000 for Supplies.Cost Decrease: The agency’s SPR fund budget includes reductions <strong>of</strong> $202,791 in O<strong>the</strong>r Services and Charges,$125,496 in Equipment, $81,384 in Energy costs, $43,745 in Janitorial Services, and $34,796 in Telecomexpenses. These reductions in nonpersonal services are to <strong>of</strong>fset <strong>the</strong> 4.0 new full-time equivalent positions and <strong>the</strong>increase in costs associated with <strong>the</strong> renovation and relocation to a new production facility.Initial Adjusted <strong>Budget</strong>Technical Adjustments: Adjustment <strong>of</strong> fringe benefits to restore <strong>the</strong> District Government contribution foremployee health insurance from 72 percent, implemented in <strong>the</strong> FY 2011 budget, to 75 percent in FY 2013,resulting in an increase <strong>of</strong> $10,205 to OCT’s SPR funds.<strong>Office</strong> <strong>of</strong> Cable TelevisionB-168FY 2013 Proposed <strong>Budget</strong> and <strong>Financial</strong> Plan
FY 2012 Approved <strong>Budget</strong> to FY 2013 Proposed <strong>Budget</strong>, by Revenue TypeTable CT0-5 itemizes <strong>the</strong> changes by revenue type between <strong>the</strong> FY 2012 approved budget and <strong>the</strong> FY 2013 proposedbudget.Table CT0-5(dollars in thousands)PROGRAM BUDGET FTESPECIAL PURPOSE REVENUE FUNDS: FY 2012 Approved <strong>Budget</strong> and FTE 8,525 35.5Cost Increase: Additional positions to monitor financial <strong>Agency</strong> Management Program 344 4.0activities, procurement and contractual issues, and providetelevision production supportCost Increase: Production-related Contractual Services Programming 52 0.0Cost Increase: Adjustment for Security Services at <strong>Agency</strong> Management Program 50 0.0new facilityCost Increase: Adjustment to Subsidies and Transfers Programming 50 0.0Cost Increase: Adjustment to Occupancy Fixed Costs <strong>Agency</strong> Management Program 38 0.0Cost Increase: Adjustment to Supplies Multiple Programs 10 0.0Cost Decrease: Adjustment to O<strong>the</strong>r Services and Charges Multiple Programs -203 0.0Cost Decrease: Adjustment to Equipment Multiple Programs -125 0.0Cost Decrease: Adjustment to Energy costs <strong>Agency</strong> Management Program -81 0.0Cost Decrease: Adjustment to Janitorial Services <strong>Agency</strong> Management Program -44 0.0Cost Decrease: Adjustment to Telecom <strong>Agency</strong> Management Program -35 0.0FY 2013 Initial Adjusted <strong>Budget</strong> 8,582 39.5Technical Adjustment: Health Care Contribution Multiple Programs 10 0.0FY 2013 Initial Adjusted <strong>Budget</strong> 8,592 39.5SPECIAL PURPOSE REVENUE FUNDS: FY 2013 Proposed <strong>Budget</strong> and FTE 8,592 39.5Gross for CT0 - <strong>Office</strong> <strong>of</strong> Cable Television 8,592 39.5(Change is calculated by whole numbers and numbers may not add up due to rounding)FY 2013 Proposed <strong>Budget</strong> and <strong>Financial</strong> Plan<strong>Office</strong> <strong>of</strong> Cable TelevisionB-169
<strong>Agency</strong> Performance PlanThe agency’s performance plan has <strong>the</strong> following objectives for FY 2013:1. ProgrammingObjective 1: Enhance <strong>the</strong> public’s access to <strong>the</strong> government through <strong>the</strong> District’s municipal television channels.Objective 2: Expand <strong>the</strong> knowledge <strong>of</strong> District children by increasing <strong>the</strong> awareness <strong>of</strong> educational and social programsavailable in <strong>the</strong> District.ProgrammingFY 2010 FY 2011 FY 2011 FY 2012 FY 2013 FY 2014Measure Actual Target Actual Projection Projection ProjectionNumber <strong>of</strong> programs provided for <strong>the</strong> Mayor’s Not Not NotSocial Media Outlets Available Available Available 40 TBD TBDNumber <strong>of</strong> programs, PSAs, overview features, and Not Notinformational spots on TV-13 and TV-16 Available Available 594 500 TBD TBDNumber <strong>of</strong> programs, PSAs, School Sketches, and Not Notoverview features on DKN Available Available 191 160 TBD TBDNumber <strong>of</strong> District students trainedin television production 34 65 49 45 TBD TBD2. Operations DivisionObjective 1: Provide quality and efficient management and support services.OperationsFY 2010 FY 2011 FY 2011 FY 2012 FY 2013 FY 2014Measure Actual Target Actual Projection Projection ProjectionPercentage <strong>of</strong> customer complaints regarding cableproviders’ outside infrastructures responded to within48 hours 95% 90% 95% 90% TBD TBDNumber <strong>of</strong> hours employees trained in pr<strong>of</strong>essionaland personal development 703 600 802 700 TBD TBDNumber <strong>of</strong> annual visits to cable franchisees’customer service centers 8 6 6 6 TBD TBD<strong>Office</strong> <strong>of</strong> Cable TelevisionB-170FY 2013 Proposed <strong>Budget</strong> and <strong>Financial</strong> Plan
3. Regulatory DivisionObjective 1: Protect and advance <strong>the</strong> cable television-related interests <strong>of</strong> District residents.RegulatoryFY 2010 FY 2011 FY 2011 FY 2012 FY 2013 FY 2014Measure Actual Target Actual Projection Projection ProjectionPercentage <strong>of</strong> customer calls answered by Comcastwithin 30 seconds * 95% 90% 97% 90% TBD TBDPercentage <strong>of</strong> customer calls answered by RCNwithin 30 seconds * 92% 90% 95% 90% TBD TBDPercentage <strong>of</strong> customer calls answered by Verizon Not Not Notwithin 30 seconds * Available Available Available 90% TBD TBD* Each cable provider is required to answer 90% <strong>of</strong> customer calls within 30 seconds.FY 2013 Proposed <strong>Budget</strong> and <strong>Financial</strong> Plan<strong>Office</strong> <strong>of</strong> Cable TelevisionB-171
Housing Authority Subsidy(HY0)www.dchousing.orgTelephone: 202-535-1000% ChangeFY 2011 FY 2012 FY 2013 fromDescription Actual Approved Proposed FY 2012Operating <strong>Budget</strong> $22,822,884 $22,000,000 $34,182,324 55.4The mission <strong>of</strong> <strong>the</strong> Housing Authority Subsidy is to provide additionalfunding to <strong>the</strong> District <strong>of</strong> Columbia Housing Authority (DCHA) to subsidizeits operations and to fund ongoing rental assistance for low-incomehouseholds.Summary <strong>of</strong> ServicesThe Housing Authority Subsidy provides rental assistance support for District <strong>of</strong> Columbia households, supports<strong>the</strong> Local Rent Supplement program, and supports DCHA’s <strong>Office</strong> <strong>of</strong> Public Safety.The agency’s FY 2013 proposed budget is presented in <strong>the</strong> following tables:FY 2013 Proposed <strong>Budget</strong> and <strong>Financial</strong> PlanHousing Authority SubsidyB-173
FY 2013 Proposed Gross Funds Operating <strong>Budget</strong>, by Revenue TypeTable HY0-1 contains <strong>the</strong> proposed FY 2013 agency budget compared to <strong>the</strong> FY 2012 approved budget. It alsoprovides FY 2010 and FY 2011 actual expenditures.Table HY0-1(dollars in thousands)ChangeActual Actual Approved Proposed from PercentAppropriated Fund FY 2010 FY 2011 FY 2012 FY 2013 FY 2012 Change*General FundLocal Funds 25,103 22,823 4,000 14,213 10,213 255.3Total for General Fund 25,103 22,823 4,000 14,213 10,213 255.3Intra-District FundsIntra-District Funds 0 0 18,000 19,969 1,969 10.9Total for Intra-District Funds 0 0 18,000 19,969 1,969 10.9Gross Funds 25,103 22,823 22,000 34,182 12,182 55.4*Percent change is based on whole dollars.Note: If applicable, for a breakdown <strong>of</strong> each Grant (Federal and Private), Special Purpose Revenue type and Intra-District agreement,please refer to Schedule 80 <strong>Agency</strong> Summary by Revenue Source in <strong>the</strong> FY 2013 Operating Appendices located on <strong>the</strong> <strong>Office</strong> <strong>of</strong> <strong>the</strong><strong>Chief</strong> <strong>Financial</strong> <strong>Office</strong>r’s website.FY 2013 Proposed Operating <strong>Budget</strong>, by Comptroller Source GroupTable HY0-2 contains <strong>the</strong> proposed FY 2013 budget at <strong>the</strong> Comptroller Source Group (object class) level comparedto <strong>the</strong> FY 2012 approved budget. It also provides FY 2010 and FY 2011 actual expenditures.Table HY0-2(dollars in thousands)ChangeActual Actual Approved Proposed from PercentComptroller Source Group FY 2010 FY 2011 FY 2012 FY 2013 FY 2012 Change*50 - Subsidies and Transfers 25,103 22,823 22,000 34,182 12,182 55.4Subtotal Nonpersonal Services (NPS) 25,103 22,823 22,000 34,182 12,182 55.4Gross Funds 25,103 22,823 22,000 34,182 12,182 55.4*Percent change is based on whole dollars.Housing Authority SubsidyB-174FY 2013 Proposed <strong>Budget</strong> and <strong>Financial</strong> Plan
Program DescriptionThe Housing Authority Subsidy operates through <strong>the</strong> following program:Housing Authority Subsidy – provides rental assistance support for District <strong>of</strong> Columbia households, supports <strong>the</strong>Local Rent Supplement program, and supports DCHA’s Public Safety Program.This program appears as a single entity in <strong>the</strong> District’s financial system but contains <strong>the</strong> following 3 activities:■ Rental Assistance Support – provides continued rental assistance to low-income District <strong>of</strong> Columbia householdsthat are currently housed;■ Local Rent Supplement –- provides rental assistance for extremely low-income families and individuals through<strong>the</strong> Local Rent Supplement program (LRSP), which is a housing program similar to <strong>the</strong> Federal HousingChoice Voucher program. The housing subsidy is provided through tenant-based assistance, project-based assistance,and sponsor-based assistance. Funding under this program also allows DCHA to provide LRSP housingproviders with needed capital funds to bring LRSP units on-line; and■ Public Safety – provides funding that supports DCHA’s Public Safety force, which complements local lawenforcement efforts by focusing on crime prevention and criminal activities in and around DCHA’s publichousing communities.Program Structure ChangeThe Housing Authority Subsidy has no program structure changes in <strong>the</strong> FY 2013 proposed budget.FY 2013 Proposed Operating <strong>Budget</strong> and FTEs, by Program and ActivityTable HY0-3 contains <strong>the</strong> proposed FY 2013 budget by program and activity compared to <strong>the</strong> FY 2012 approvedbudget. It also provides <strong>the</strong> FY 2011 actual data.Table HY0-3(dollars in thousands)Dollars in ThousandsFull-Time EquivalentsChangeChangeActual Approved Proposed from Actual Approved Proposed fromProgram/Activity FY 2011 FY 2012 FY 2013 FY 2012 FY 2011 FY 2012 FY 2013 FY 2012(1000) Housing Authority Subsidy(1100) Housing Authority Subsidy 22,823 22,000 34,182 12,182 0.0 0.0 0.0 0.0Subtotal (1000) Housing Authority Subsidy 22,823 22,000 34,182 12,182 0.0 0.0 0.0 0.0Total Proposed Operating <strong>Budget</strong> 22,823 22,000 34,182 12,182 0.0 0.0 0.0 0.0(Change is calculated by whole numbers and numbers may not add up due to rounding)Note: For more detailed information regarding <strong>the</strong> proposed funding for <strong>the</strong> activities within this agency’s programs, please see Schedule 30-PBBProgram Summary by Activity in <strong>the</strong> FY 2013 Operating Appendices located on <strong>the</strong> <strong>Office</strong> <strong>of</strong> <strong>the</strong> <strong>Chief</strong> <strong>Financial</strong> <strong>Office</strong>r’s website.FY 2013 Proposed <strong>Budget</strong> and <strong>Financial</strong> PlanHousing Authority SubsidyB-175
FY 2013 Proposed <strong>Budget</strong> ChangesThe Housing Authority Subsidy’s proposed FY 2013 gross budget is $34,182,324, which represents a 55.4 increasefrom <strong>the</strong> FY 2012 approved budget <strong>of</strong> $22,000,000. The budget is comprised <strong>of</strong> $14,213,276 in Local funds and$19,969,048 in Intra-District funds.Current Services Funding LevelThe Current Services Funding Level (CSFL) is a Local funds ONLY representation <strong>of</strong> <strong>the</strong> true cost <strong>of</strong> operatingDistrict agencies, before consideration <strong>of</strong> policy decisions. The CSFL reflects changes from <strong>the</strong> FY 2012 approvedbudget across multiple programs, and it estimates how much it would cost an agency to continue its currentprograms and operations into <strong>the</strong> following fiscal year. The initial adjustments in <strong>the</strong> budget proposal representchanges that should be compared to <strong>the</strong> FY 2013 CSFL budget and not necessarily changes made to <strong>the</strong> FY 2012Local funds budget. The FY 2013 CSFL adjustments to <strong>the</strong> FY 2012 Local funds budget are described in table 4<strong>of</strong> this agency's budget chapter. Please see <strong>the</strong> CSFL Development section within Volume 1: Executive Summaryfor more information regarding <strong>the</strong> methodology used and components that comprise <strong>the</strong> CSFL.The Housing Authority Subsidy’s FY 2013 CSFL budget is $4,000,000, which represents no change from <strong>the</strong>FY 2012 approved Local funds budget <strong>of</strong> $4,000,000.Policy InitiativesCost Increase: The proposed budget includes increases <strong>of</strong> $10,213,276 in Local funds and $1,969,048 in Intra-District funds to support rental assistance and funding for homeless families to transition to LRSP per <strong>the</strong> Housingfor Homeless Families Act <strong>of</strong> 2012.Housing Authority SubsidyB-176FY 2013 Proposed <strong>Budget</strong> and <strong>Financial</strong> Plan
FY 2012 Approved <strong>Budget</strong> to FY 2013 Proposed <strong>Budget</strong>, by Revenue TypeTable HY0-4 itemizes <strong>the</strong> changes by revenue type between <strong>the</strong> FY 2012 approved budget and <strong>the</strong> FY 2013 proposedbudget.Table HY0-4(dollars in thousands)PROGRAM BUDGET FTELOCAL FUND: FY 2012 Approved <strong>Budget</strong> and FTE 4,000 0.0No Changes 0 0.0FY 2013 Current Services Funding Level <strong>Budget</strong> (CSFL) 4,000 0.0FY 2013 Policy InitiativesCost Increase: Additional Local funding for <strong>the</strong> Rent Supplement program Housing Authority Subsidy 10,213 0.0LOCAL FUND: FY 2013 Proposed <strong>Budget</strong> and FTE 14,213 0.0INTRADISTRICT FUNDS: FY 2012 Approved <strong>Budget</strong> and FTE 18,000 0.0FY 2013 Policy InitiativesCost Increase: To reflect additional funding for LRSP Housing Authority Subsidy 1,969 0.0INTRADISTRICT FUNDS: FY 2013 Proposed <strong>Budget</strong> and FTE 19,969 0.0Gross for HY0 - Housing Authority Subsidy 34,182 0.0(Change is calculated by whole numbers and numbers may not add up due to rounding)FY 2012 Proposed <strong>Budget</strong> and <strong>Financial</strong> PlanHousing Authority SubsidyB-177
(HP0)Housing Production Trust Fund Subsidywww.dhcd.dc.govTelephone: 202-442-7200% ChangeFY 2011 FY 2012 FY 2013 fromDescription Actual Approved Proposed FY 2012Operating <strong>Budget</strong> $34,018,225 $35,109,412 $15,000,000 -57.3The subsidy account previously reflected <strong>the</strong> total Dedicated Taxes(General Fund) transfer to <strong>the</strong> Housing Production Trust Fund(HPTF) to fulfill its operational obligations during a budgetary year.Beginning in FY 2013, this transfer is no longer budgeted in <strong>the</strong>General Fund, but Local funds are transferred to <strong>the</strong> HPTF in <strong>the</strong> FY2013 budget.The HPTF, which is administered by <strong>the</strong> District <strong>of</strong> Columbia’s Department <strong>of</strong> Housing and CommunityDevelopment (DHCD), is a legally separate entity for which <strong>the</strong> elected <strong>of</strong>ficials <strong>of</strong> <strong>the</strong> District <strong>of</strong> Columbia arefinancially accountable. Details <strong>of</strong> <strong>the</strong> HPTF’s operating budget are provided in <strong>the</strong> Enterprise and O<strong>the</strong>r Fundssection <strong>of</strong> <strong>the</strong> budget document.In FY 2007, a subsidy account for this entity was created to show <strong>the</strong> annual transfer <strong>of</strong> dedicated deed recordationand deed transfer taxes from <strong>the</strong> District’s General Fund to <strong>the</strong> HPTF. In total, 15 percent <strong>of</strong> <strong>the</strong>se tax revenuesare dedicated to <strong>the</strong> HPTF. This 15 percent share was budgeted in two agencies. First, <strong>the</strong> amount requiredfor debt service on borrowing for New Communities projects was budgeted in <strong>the</strong> Repayment <strong>of</strong> Revenue Bondsagency, in <strong>the</strong> Financing and O<strong>the</strong>r appropriation title. Second, <strong>the</strong> remaining amount <strong>of</strong> <strong>the</strong> 15 percent share wasbudgeted in <strong>the</strong> HPTF Subsidy agency, to be transferred to <strong>the</strong> HPTF. Starting in FY 2013, <strong>the</strong>se funds will bedeposited directly into <strong>the</strong> HPTF, thus <strong>the</strong>re is no transfer <strong>of</strong> Dedicated Taxes through <strong>the</strong> General Fund. However,in <strong>the</strong> FY 2013 budget, <strong>the</strong>re is a Local funds transfer to <strong>the</strong> HPTF.The agency’s FY 2013 proposed budget is presented in <strong>the</strong> following tables:FY 2013 Proposed <strong>Budget</strong> and <strong>Financial</strong> PlanHousing Production Trust Fund SubsidyB-179
FY 2013 Proposed Gross Funds Operating <strong>Budget</strong>, by Revenue TypeTable HP0-1 contains <strong>the</strong> proposed FY 2013 agency budget compared to <strong>the</strong> FY 2012 approved budget. It alsoprovides FY 2010 and FY 2011 actual expenditures.Table HP0-1(dollars in thousands)ChangeActual Actual Approved Proposed from PercentAppropriated Fund FY 2010 FY 2011 FY 2012 FY 2013 FY 2012 Change*General FundLocal Funds 0 0 0 15,000 15,000 N/ADedicated Taxes 13,039 34,018 35,109 0 -35,109 -100.0Total for General Fund 13,039 34,018 35,109 15,000 -20,109 -57.3Gross Funds 13,039 34,018 35,109 15,000 -20,109 -57.3*Percent change is based on whole dollars.Note: If applicable, for a breakdown <strong>of</strong> each Grant (Federal and Private), Special Purpose Revenue type and Intra-District agreement,please refer to Schedule 80 <strong>Agency</strong> Summary by Revenue Source in <strong>the</strong> FY 2013 Operating Appendices located on <strong>the</strong> <strong>Office</strong> <strong>of</strong> <strong>the</strong><strong>Chief</strong> <strong>Financial</strong> <strong>Office</strong>r’s website.FY 2013 Proposed Operating <strong>Budget</strong>, by Comptroller Source GroupTable HP0-2 contains <strong>the</strong> proposed FY 2013 budget at <strong>the</strong> Comptroller Source Group (object class) level comparedto <strong>the</strong> FY 2012 approved budget. It also provides FY 2010 and FY 2011 actual expenditures.Table HP0-2(dollars in thousands)ChangeActual Actual Approved Proposed from PercentComptroller Source Group FY 2010 FY 2011 FY 2012 FY 2013 FY 2012 Change*50 - Subsidies and Transfers 13,039 34,018 35,109 15,000 -20,109 -57.3Subtotal Nonpersonal Services (NPS) 13,039 34,018 35,109 15,000 -20,109 -57.3Gross Funds 13,039 34,018 35,109 15,000 -20,109 -57.3*Percent change is based on whole dollars.Housing Production Trust Fund SubsidyB-180FY 2013 Proposed <strong>Budget</strong> and <strong>Financial</strong> Plan
Program DescriptionThe Housing Production Trust Fund Subsidy operates through <strong>the</strong> following program:Housing Production Trust Fund (Subsidy) – provides funds to fulfill operational obligations for <strong>the</strong> HousingProduction Trust Fund.Program Structure ChangeThe Housing Production Trust Fund Subsidy has no program structure changes in <strong>the</strong> FY 2013 Proposed <strong>Budget</strong>.FY 2013 Proposed Operating <strong>Budget</strong> and FTEs, by Program and ActivityTable HP0-3 contains <strong>the</strong> proposed FY 2013 budget by program and activity compared to <strong>the</strong> FY 2012 approved budget.It also provides <strong>the</strong> FY 2011 actual data.Table HP0-3(dollars in thousands)Dollars in ThousandsChangeFull-Time EquivalentsChangeActual Approved Proposed from Actual Approved Proposed fromProgram/Activity FY 2011 FY 2012 FY 2013 FY 2012 FY 2011 FY 2012 FY 2013 FY 2012(1000) Housing Production Trust Fund (Subsidy)(1100) Housing Production Trust Fund (Subsidy) 34,018 35,109 15,000 -20,109 0.0 0.0 0.0 0.0Subtotal (1000) Housing Production Trust Fund (Subsidy) 34,018 35,109 15,000 -20,109 0.0 0.0 0.0 0.0Total Proposed Operating <strong>Budget</strong> 34,018 35,109 15,000 -20,109 0.0 0.0 0.0 0.0(Change is calculated by whole numbers and numbers may not add up due to rounding)Note: For more detailed information regarding <strong>the</strong> proposed funding for <strong>the</strong> activities within this agency’s programs, please see Schedule 30-PBBProgram Summary by Activity in <strong>the</strong> FY 2013 Operating Appendices located on <strong>the</strong> <strong>Office</strong> <strong>of</strong> <strong>the</strong> <strong>Chief</strong> <strong>Financial</strong> <strong>Office</strong>r’s website.FY 2013 Proposed <strong>Budget</strong> ChangesThe proposed FY 2013 gross budget for Housing Production Trust Fund Subsidy is $15,000,000, which represents a57.3 percent decrease from its FY 2012 approved gross budget <strong>of</strong> $35,109,412. The budget is comprised entirely <strong>of</strong> Localfunds.Initial Adjusted <strong>Budget</strong>Eliminate: In keeping with recent Government Accounting Standards Board (GASB) guidance regarding <strong>the</strong> treatment<strong>of</strong> certain types <strong>of</strong> transfers, <strong>the</strong> FY 2013 budget proposal <strong>of</strong> <strong>the</strong> District reflects appropriate changes in budgeting methodologyfor <strong>the</strong> Housing Production Trust Fund Subsidy. The taxes collected for <strong>the</strong> Housing Production Trust Fund (portions<strong>of</strong> <strong>the</strong> Deed Recordation and Deed Transfer Taxes) will no longer be budgeted in <strong>the</strong> General Fund. Those revenueswill be directly deposited into <strong>the</strong> Housing Production Trust Fund, within <strong>the</strong> Enterprise and O<strong>the</strong>r appropriation title.The portion allocated to Repayment <strong>of</strong> Revenue Bonds will still be budgeted in <strong>the</strong> General Fund. For <strong>the</strong>se reasons, <strong>the</strong>proposed budget reflects a reduction <strong>of</strong> $35,109,412 in Dedicated Taxes.FY 2013 Proposed <strong>Budget</strong> and <strong>Financial</strong> PlanHousing Production Trust Fund SubsidyB-181
Policy InitiativeCost Increase: The proposed budget includes a one-time increase <strong>of</strong> $15,000,000 in Local funds to reflect net proceedsfrom <strong>the</strong> sale <strong>of</strong> a building in <strong>the</strong> NoMa (North <strong>of</strong> Massachusetts Avenue) neighborhood within <strong>the</strong> District.FY 2012 Approved <strong>Budget</strong> to FY 2013 Proposed <strong>Budget</strong>, by Revenue TypeTable HP0-4 itemizes <strong>the</strong> changes by revenue type between <strong>the</strong> FY 2012 approved budget and <strong>the</strong> FY 2013 proposedbudget.Table HP0-4(dollars in thousands)PROGRAM BUDGET FTELOCAL FUNDS: FY 2012 Approved <strong>Budget</strong> and FTE 0 0.0FY 2013 Policy InitiativeCost Increase: To reflect net proceeds from <strong>the</strong> sale <strong>of</strong> a building in <strong>the</strong> Housing Production 15,000 0.0NoMa (North <strong>of</strong> Massachusetts Avenue) neighborhood (One-Time)Trust Fund (Subsidy)LOCAL FUND: FY 2013 Proposed <strong>Budget</strong> and FTE 15,000 0.0DEDICATED TAXES: FY 2012 Approved <strong>Budget</strong> and FTE 35,109 0.0Eliminate: Reduction to comply with GASB guidance Housing Production -35,109 0.0Trust Fund (Subsidy)FY 2013 Initial Adjusted <strong>Budget</strong> 0 0.0DEDICATED TAXES: FY 2013 Proposed <strong>Budget</strong> and FTE 0 0.0Gross for HP0 - Housing Production Trust Fund Subsidy 15,000 0.0(Change is calculated by whole numbers and numbers may not add up due to rounding)Housing Production Trust Fund SubsidyB-182FY 2013 Proposed <strong>Budget</strong> and <strong>Financial</strong> Plan
Business Improvement DistrictsTransfer(ID0)% ChangeFY 2011 FY 2012 FY 2013 fromDescription Actual Approved Proposed FY 2012Operating <strong>Budget</strong> $20,787,693 $23,000,000 $23,000,000 0.0The Business Improvement Districts Transfer agency records <strong>the</strong> transfer<strong>of</strong> revenues to Business Improvement Districts (BIDs).This agency was created in <strong>the</strong> FY 2010 budget. These transfers were previously budgeted in <strong>the</strong> <strong>Office</strong> <strong>of</strong> <strong>the</strong>Deputy Mayor for Planning and Economic Development. The <strong>Chief</strong> <strong>Financial</strong> <strong>Office</strong>r collects assessments frombusinesses in BID areas through property taxes and <strong>the</strong>n refunds <strong>the</strong> proceeds to each BID. Decisions on <strong>the</strong> assessmentrate, who is assessed, and how <strong>the</strong> proceeds are spent are made by <strong>the</strong> BID, not <strong>the</strong> District <strong>of</strong> Columbia.There are currently eight BIDs in <strong>the</strong> District:■ Adams Morgan Partnership BID;■ Capitol Hill BID;■ Capitol Riverfront BID;■ Downtown DC BID;■ Georgetown BID;■ Golden Triangle BID;■ Mount Vernon Triangle CommunityImprovement District; and■ NoMa BID.The agency’s FY 2013 proposed budget is presented in <strong>the</strong> following tables:FY 2013 Proposed <strong>Budget</strong> and <strong>Financial</strong> PlanBusiness Improvement Districts TransferB-183
FY 2013 Proposed Gross Funds Operating <strong>Budget</strong>, by Revenue TypeTable ID0-1 contains <strong>the</strong> proposed FY 2013 agency budget compared to <strong>the</strong> FY 2012 approved budget. It alsoprovides FY 2010 and FY 2011 actual expenditures.Table ID0-1(dollars in thousands)ChangeActual Actual Approved Proposed from PercentAppropriated Fund FY 2010 FY 2011 FY 2012 FY 2013 FY 2012 ChangeGeneral FundSpecial Purpose Revenue Funds 0 20,788 23,000 23,000 0 0.0Total for General Fund 0 20,788 23,000 23,000 0 0.0Gross Funds 0 20,788 23,000 23,000 0 0.0*Percent change is based on whole dollars.Note: If applicable, for a breakdown <strong>of</strong> each Grant (Federal and Private), Special Purpose Revenue type and Intra-District agreement,please refer to Schedule 80 <strong>Agency</strong> Summary by Revenue Source in <strong>the</strong> FY 2013 Operating Appendices located on <strong>the</strong> <strong>Office</strong> <strong>of</strong> <strong>the</strong><strong>Chief</strong> <strong>Financial</strong> <strong>Office</strong>r’s website.FY 2013 Proposed Operating <strong>Budget</strong>, by Comptroller Source GroupTable ID0-2 contains <strong>the</strong> proposed FY 2013 budget at <strong>the</strong> Comptroller Source Group (object class) level comparedto <strong>the</strong> FY 2012 approved budget. It also provides FY 2010 and FY 2011 actual expenditures.Table ID0-2(dollars in thousands)ChangeActual Actual Approved Proposed from PercentComptroller Source Group FY 2010 FY 2011 FY 2012 FY 2013 FY 2012 Change*50 - Subsidies and Transfers 0 20,788 23,000 23,000 0 0.0Subtotal Nonpersonal Services (NPS) 0 20,788 23,000 23,000 0 0.0Gross Funds 0 20,788 23,000 23,000 0 0.0*Percent change is based on whole dollars.Program DescriptionThe Business Improvement Districts Transfer agency operates through <strong>the</strong> following program:Business Improvement Districts Tax-Transfer – records <strong>the</strong> transfer <strong>of</strong> revenue to <strong>the</strong> various BusinessImprovement Districts.Program Structure ChangeThe Business Improvement Districts Transfer agency has no program structure changes in <strong>the</strong> FY 2013 proposedbudget.Business Improvement Districts TransferB-184FY 2013 Proposed <strong>Budget</strong> and <strong>Financial</strong> Plan
FY 2013 Proposed Operating <strong>Budget</strong> and FTEs, by Program and ActivityTable ID0-3 contains <strong>the</strong> proposed FY 2013 budget by program and activity compared to <strong>the</strong> FY 2012 approved budget.It also provides <strong>the</strong> FY 2011 actual data.Table ID0-3(dollars in thousands)Dollars in ThousandsFull-Time EquivalentsChangeChangeActual Approved Proposed from Actual Approved Proposed fromProgram/Activity FY 2011 FY 2012 FY 2013 FY 2012 FY 2011 FY 2012 FY 2013 FY 2012(1000) Business Improvement Districts Tax - Transfer(1000) Business Improvement Districts Tax - Transfer 20,788 23,000 23,000 0 0.0 0.0 0.0 0.0Subtotal (1000) Business Improvement Districts Tax - Transfer 20,788 23,000 23,000 0 0.0 0.0 0.0 0.0Total Proposed Operating <strong>Budget</strong> 20,788 23,000 23,000 0 0.0 0.0 0.0 0.0(Change is calculated by whole numbers and numbers may not add up due to rounding)Note: For more detailed information regarding <strong>the</strong> proposed funding for <strong>the</strong> activities within this agency’s programs, please see Schedule 30-PBBProgram Summary by Activity in <strong>the</strong> FY 2013 Operating Appendices located on <strong>the</strong> <strong>Office</strong> <strong>of</strong> <strong>the</strong> <strong>Chief</strong> <strong>Financial</strong> <strong>Office</strong>r’s website.FY 2013 Proposed <strong>Budget</strong> ChangesThe Business Improvement Districts Transfer agency has no changes from <strong>the</strong> FY 2012 approved budget to <strong>the</strong> FY2013 proposed budget.FY 2013 Proposed <strong>Budget</strong> and <strong>Financial</strong> PlanBusiness Improvement Districts TransferB-185
CPublic Safety and JusticeMetropolitan Police Department (FA).....................................................................C-1Fire and Emergency Medical Services Department (FB).....................................C-19Police <strong>Office</strong>rs’ and Fire Fighters’ Retirement System (FD) ................................C-35Department <strong>of</strong> Corrections (FL) ............................................................................C-39District <strong>of</strong> Columbia National Guard (FK)...........................................................C-49Homeland Security and Emergency Management <strong>Agency</strong> (BN) .......................C-57Commission on Judicial Disabilities and Tenure (DQ).........................................C-71Judicial Nomination Commission (DV) ................................................................C-77<strong>Office</strong> <strong>of</strong> Police Complaints (FH)...........................................................................C-83District <strong>of</strong> Columbia Sentencing and Criminal CodeRevision Commission (FZ).....................................................................................C-91<strong>Office</strong> <strong>of</strong> <strong>the</strong> <strong>Chief</strong> Medical Examiner (FX)..........................................................C-99<strong>Office</strong> <strong>of</strong> Administrative Hearings (FS)...............................................................C-109Criminal Justice Coordinating Council (FJ) ........................................................C-117Forensic Laboratory Technician Training Program (FV) ...................................C-127<strong>Office</strong> <strong>of</strong> Unified Communications (UC)............................................................C-131Homeland Security Grants (FT)..........................................................................C-141Deputy Mayor for Public Safety and Justice (FQ) ..............................................C-145Department <strong>of</strong> Forensics Sciences (FR) ...............................................................C-155Public Safety and Justice
Metropolitan Police Department(FA0)www.mpdc.dc.govTelephone: 202-727-4218Executive <strong>Office</strong> <strong>of</strong> <strong>the</strong> <strong>Chief</strong> <strong>of</strong> Police911 Calls for Police Service% ChangeFY 2011 FY 2012 FY 2013 fromDescription Actual Approved Proposed FY 2012Operating <strong>Budget</strong> $479,666,368 $478,536,548 $496,206,043 3.7FTEs 4,901.4 4,781.0 4,609.6 -3.6The mission <strong>of</strong> <strong>the</strong> Metropolitan Police Department (MPD) is to safeguard<strong>the</strong> District <strong>of</strong> Columbia and protect its residents and visitors byproviding <strong>the</strong> highest quality police service with integrity, compassion,and a commitment to innovation that integrates people, technology,and progressive business systems.Summary <strong>of</strong> ServicesMPD provides crime prevention and response services through patrols, investigations, and homeland security services.The Patrol Services and School Security division delivers community policing to <strong>the</strong> District’s neighborhoodsthrough 46 police service areas in seven police districts and oversees <strong>the</strong> provision <strong>of</strong> security services to <strong>the</strong> District<strong>of</strong> Columbia Public Schools. The Investigative Services division investigates violent, property, and narcotic crimesand provides forensic support for those cases. The Homeland Security division coordinates domestic security andintelligence operations as well as traffic safety and for special events. The Internal Affairs Bureau investigates use <strong>of</strong>force, potential equal employment opportunity violators, and o<strong>the</strong>r complaints against MPD <strong>of</strong>ficers and employees.The Strategic Services, Pr<strong>of</strong>essional Development and Corporate Support Bureaus support <strong>the</strong> work <strong>of</strong> <strong>the</strong>entire department through research, crime analysis, strategic direction, recruitment, hiring and training personnel,fleet management, procurement, and o<strong>the</strong>r administrative support services.The agency’s FY 2013 proposed budget is presented in <strong>the</strong> following tables:FY 2013 Proposed <strong>Budget</strong> and <strong>Financial</strong> PlanMetropolitan Police DepartmentC-1
FY 2013 Proposed Gross Funds Operating <strong>Budget</strong>, by Revenue TypeTable FA0-1 contains <strong>the</strong> proposed FY 2013 agency budget compared to <strong>the</strong> FY 2012 approved budget. It alsoprovides FY 2010 and FY 2011 actual expenditures.Table FA0-1(dollars in thousands)ChangeActual Actual Approved Proposed from PercentAppropriated Fund FY 2010 FY 2011 FY 2012 FY 2013 FY 2012 Change*General FundLocal Funds 437,494 415,020 442,071 462,390 20,319 4.6Special Purpose Revenue Funds 21,021 27,472 9,452 8,535 -917 -9.7Total for General Fund 458,516 442,492 451,523 470,926 19,402 4.3Federal ResourcesFederal Grant Funds 5,539 5,183 5,683 2,730 -2,953 -52.0Total for Federal Resources 5,539 5,183 5,683 2,730 -2,953 -52.0Private FundsPrivate Donations 124 138 0 0 0 N/ATotal for Private Funds 124 138 0 0 0 N/AIntra-District FundsIntra-District Funds 40,881 31,852 21,330 22,551 1,221 5.7Total for Intra-District Funds 40,881 31,852 21,330 22,551 1,221 5.7Gross Funds 505,059 479,666 478,537 496,206 17,669 3.7*Percent change is based on whole dollars.Note: If applicable, for a breakdown <strong>of</strong> each Grant (Federal and Private), Special Purpose Revenue type and Intra-District agreement,please refer to Schedule 80 <strong>Agency</strong> Summary by Revenue Source in <strong>the</strong> FY 2013 Operating Appendices located on <strong>the</strong> <strong>Office</strong> <strong>of</strong> <strong>the</strong><strong>Chief</strong> <strong>Financial</strong> <strong>Office</strong>r’s website.Metropolitan Police DepartmentC-2FY 2013 Proposed <strong>Budget</strong> and <strong>Financial</strong> Plan
FY 2013 Proposed Full-Time Equivalents, by Revenue TypeTable FA0-2 contains <strong>the</strong> proposed FY 2013 FTE level compared to <strong>the</strong> FY 2012 approved FTE level by revenuetype. It also provides FY 2010 and FY 2011 actual data.Table FA0-2ChangeActual Actual Approved Proposed from PercentAppropriated Fund FY 2010 FY 2011 FY 2012 FY 2013 FY 2012 ChangeGeneral FundLocal Funds 4,737.3 4,820.6 4,714.2 4,578.3 -135.9 -2.9Special Purpose Revenue Funds 5.7 21.6 3.0 1.8 -1.2 -39.0Total for General Fund 4,743.0 4,842.2 4,717.2 4,580.2 -137.1 -2.9Federal ResourcesFederal Grant Funds 55.0 57.8 59.5 17.4 -42.1 -70.8Total for Federal Resources 55.0 57.8 59.5 17.4 -42.1 -70.8Intra-District FundsIntra-District Funds 2.8 1.5 4.2 12.0 7.8 182.4Total for Intra-District Funds 2.8 1.5 4.2 12.0 7.8 182.4Total Proposed FTEs 4,800.7 4,901.4 4,781.0 4,609.6 -171.4 -3.6FY 2013 Proposed <strong>Budget</strong> and <strong>Financial</strong> PlanMetropolitan Police DepartmentC-3
FY 2013 Proposed Operating <strong>Budget</strong>, by Comptroller Source GroupTable FA0-3 contains <strong>the</strong> proposed FY 2013 budget at <strong>the</strong> Comptroller Source Group (object class) level comparedto <strong>the</strong> FY 2012 approved budget. It also provides FY 2010 and FY 2011 actual expenditures.Table FA0-3(dollars in thousands)ChangeActual Actual Approved Proposed from PercentComptroller Source Group FY 2010 FY 2011 FY 2012 FY 2013 FY 2012 Change*11 - Regular Pay - Continuing Full Time 318,210 311,286 304,335 310,140 5,805 1.912 - Regular Pay - O<strong>the</strong>r 3,403 3,878 4,255 4,013 -243 -5.713 - Additional Gross Pay 22,115 23,148 22,797 24,411 1,614 7.114 - Fringe Benefits - Current Personnel 45,376 46,309 49,022 53,863 4,841 9.915 - Overtime Pay 31,586 35,144 29,798 29,697 -101 -0.399 - Unknown Payroll Postings 208 26 0 0 0 N/ASubtotal Personal Services (PS) 420,898 419,792 410,208 422,124 11,916 2.920 - Supplies and Materials 1,754 2,747 4,977 5,074 97 1.930 - Energy, Comm. and Building Rentals 7,781 464 376 260 -117 -31.031 - Telephone, Telegraph, Telegram, Etc. 4,547 154 135 135 0 0.032 - Rentals - Land and Structures 3,704 750 750 750 0 0.033 - Janitorial Services 1,440 73 75 0 -75 -100.034 - Security Services 1,385 0 0 0 0 N/A35 - Occupancy Fixed Costs 2,530 100 100 100 0 0.040 - O<strong>the</strong>r Services and Charges 20,566 12,382 13,389 12,731 -659 -4.941 - Contractual Services - O<strong>the</strong>r 37,814 41,530 45,884 52,440 6,556 14.350 - Subsidies and Transfers -235 0 0 0 0 N/A70 - Equipment and Equipment Rental 2,880 1,676 2,642 2,593 -49 -1.891 - Expense Not <strong>Budget</strong>ed O<strong>the</strong>rs -5 0 0 0 0 N/ASubtotal Nonpersonal Services (NPS) 84,161 59,875 68,329 74,082 5,753 8.4Gross Funds 505,059 479,666 478,537 496,206 17,669 3.7*Percent change is based on whole dollars.Metropolitan Police DepartmentC-4FY 2013 Proposed <strong>Budget</strong> and <strong>Financial</strong> Plan
Division DescriptionThe Metropolitan Police Department operates through <strong>the</strong> following 9 divisions:Patrol Services and School Security Bureau – coordinates crime prevention and reduction efforts in <strong>the</strong> sevenpolice districts. In addition to providing pr<strong>of</strong>essional and effective patrol services throughout <strong>the</strong> District, this divisionresponds to all calls for police service. The division also manages security in all District <strong>of</strong> Columbia PublicSchools and works to reduce juvenile victimization and delinquent behavior through a variety <strong>of</strong> programs.This division contains <strong>the</strong> following 4 activities:■ Patrol Services – provides focused law enforcement, responds to calls for service, and provides crime preventionservices to residents, visitors, and commuters;■ Community Services and Youth Outreach – coordinates proactive outreach to community members andyouth, directs <strong>the</strong> School Resource <strong>Office</strong>r program, and manages <strong>the</strong> security contract for D.C. Public Schools;■ Special Liaison Unit (Patrol Support) – provides targeted outreach and specialized response to historicallyunderserved communities; and■ Central Cell Block – processes and supervises persons arrested in <strong>the</strong> District.Investigative Services Bureau – works with <strong>the</strong> community to solve crimes, helps bring <strong>of</strong>fenders to justice, supports<strong>the</strong> recovery <strong>of</strong> victims, and protects witnesses. As part <strong>of</strong> this responsibility, this division, in conjunction with<strong>the</strong> Department <strong>of</strong> General Services, is working to design, build, and operate <strong>the</strong> District’s Consolidated ForensicLaboratory to enhance <strong>the</strong> District’s capabilities for crime scene investigations and evidence analysis.This division contains <strong>the</strong> following 5 activities:■ Criminal Investigations Division – investigates and solves crimes so that <strong>of</strong>fenders are brought to justice, andprovides assistance to victims;■ Narcotics and Special Investigations – provides proactive criminal enforcement services so that citizens can livein neighborhoods free from drug dealing, drug-related crime, and prostitution;■ Forensics Science – processes crime scenes and coordinates evidence analysis;■ Youth Investigations Division – investigates abuse <strong>of</strong> minors, sexual abuse, internet-related crimes againstminors, and human trafficking; and processes all juvenile arrestees; and■ Firearms and Tool Mark Examination – conducts ballistics and unique mark identification analysis on criminalfirearms evidence.Strategic Services Bureau – integrates research, program and policy development, and strategic analysis and planningto support MPD and <strong>the</strong> District by identifying and implementing innovative policing and business practices.This division contains <strong>the</strong> following 3 activities:■ Strategic Change – coordinates strategic planning, government relations, legislative affairs, and performancemanagement;■ Research and Analytical Services – performs crime analysis and research; and■ Policy and Standards – develops policies and procedures for <strong>the</strong> department.Corporate Support Bureau – oversees <strong>the</strong> major administrative, technical, and business functions <strong>of</strong> <strong>the</strong> departmentthat are critical to keeping <strong>the</strong> complex and large agency running effectively and efficiently, including fleetmanagement, equipment and supply, and evidence and property control.This division contains <strong>the</strong> following 2 activities:FY 2013 Proposed <strong>Budget</strong> and <strong>Financial</strong> PlanMetropolitan Police DepartmentC-5
■■General Support Services – provides support for equipment and supply, evidence and property control, reproduction,and fleet services; andPolice Business Services – provides services to <strong>the</strong> public and <strong>the</strong> criminal justice community by maintainingpolice records, licensing security <strong>of</strong>ficers, and registering firearms.Pr<strong>of</strong>essional Development Bureau – helps <strong>the</strong> department strategically manage its human capital through recruiting,hiring, training, and personnel services, and provides medical support for <strong>the</strong> agency’s sworn members.This division contains <strong>the</strong> following 2 activities:■ <strong>Office</strong> <strong>of</strong> Human Resource Management – hires, retains, and make appropriate duty status determinations forsworn personnel; and■ Police Academy – provides training to MPD recruits and MPD sworn personnel to create a capable, knowledgeable,and pr<strong>of</strong>essional staff.Assistant <strong>Chief</strong> for Internal Affairs Bureau – acts as <strong>the</strong> guardian <strong>of</strong> MPD’s reputation, and ensures MPD’saccountability through comprehensive investigations <strong>of</strong> alleged misconduct and uses <strong>of</strong> force.This division contains <strong>the</strong> following 5 activities:■ Internal Affairs – conducts general investigations into allegations <strong>of</strong> police misconduct and serves as <strong>the</strong> liaisonto <strong>the</strong> <strong>Office</strong> <strong>of</strong> Police Complaints;■ Force Investigations – conducts investigations into <strong>the</strong> use <strong>of</strong> force by MPD-sworn personnel and administers<strong>the</strong> Use <strong>of</strong> Force Review Board;■ Equal Employment Opportunity Commission (EEOC) – ensures compliance with equal employment opportunitylaws and regulations;■ Memorandum <strong>of</strong> Agreement (MOA) Compliance Monitoring – ensures that MPD complies with an MOAestablished with <strong>the</strong> Department <strong>of</strong> Justice; and■ Court Liaison – coordinates <strong>of</strong>ficer appearances related to criminal and traffic cases.Homeland Security Bureau – integrates intelligence and operational functions to ensure that <strong>the</strong> District is wellprotected and that <strong>the</strong> government prevents and is prepared to respond to threats and critical incidents. The divisionalso works directly to support patrol operations to reduce crime and fear <strong>of</strong> crime with specialized patrol andtactical resources, and works constantly to improve information-sharing, process relevant information, and provideactionable intelligence to relevant personnel.This division contains <strong>the</strong> following 2 activities:■ Special Operations – provides specialized patrol, tactical, rescue, and security services to <strong>the</strong> public, businesses,and government in <strong>the</strong> District; and■ Intelligence Fusion – seeks to improve information-sharing, process information, and provide actionable intelligenceto relevant personnel; and coordinates gang-related and intelligence operations.<strong>Agency</strong> Management – provides for administrative support and <strong>the</strong> required tools to achieve operational and programmaticresults. This division is standard for all agencies using performance-based budgeting.Metropolitan Police DepartmentC-6FY 2013 Proposed <strong>Budget</strong> and <strong>Financial</strong> Plan
<strong>Agency</strong> <strong>Financial</strong> Operations – provides comprehensive and efficient financial management services to, and on <strong>the</strong>behalf <strong>of</strong>, District agencies so that <strong>the</strong> financial integrity <strong>of</strong> <strong>the</strong> District <strong>of</strong> Columbia is maintained. This division isstandard for all agencies using performance-based budgeting.Division Structure ChangeThe Metropolitan Police Department has no division structure changes in <strong>the</strong> FY 2013 proposed budget.FY 2013 Proposed Operating <strong>Budget</strong> and FTEs, by Division and ActivityTable FA0-4 contains <strong>the</strong> proposed FY 2013 budget by division and activity compared to <strong>the</strong> FY 2012 approved budget.It also provides <strong>the</strong> FY 2011 actual data.Table FA0-4(dollars in thousands)Dollars in ThousandsFull-Time EquivalentsChangeChangeActual Approved Proposed from Actual Approved Proposed fromDivision/Activity FY 2011 FY 2012 FY 2013 FY 2012 FY 2011 FY 2012 FY 2013 FY 2012(1001) Patrol Services and School Security Bureau(1500) Patrol Districts 239,399 232,294 242,878 10,583 2,922.6 2,818.0 2,790.0 -28.0(1600) Patrol Support Division 6,598 6,459 6,442 -18 0.0 66.0 60.0 -6.0(1700) Community Services and Youth Outreach 13,853 15,156 15,474 317 7.1 13.0 7.0 -6.0(1900) Central Cell Block 3,086 2,992 2,783 -209 40.3 33.0 31.0 -2.0Subtotal (1001) Patrol Services and School Security Bureau 262,935 256,902 267,576 10,674 2,969.9 2,930.0 2,888.0 -42.0(100F) <strong>Agency</strong> <strong>Financial</strong> Operations(110F) <strong>Budget</strong> Operations 1,009 1,424 1,421 -3 13.1 13.0 13.0 0.0(120F) Accounting Operations 1,758 1,730 1,790 60 21.2 20.0 21.0 1.0(130F) ACFO 126 119 124 4 0.9 1.0 1.0 0.0Subtotal (100F) <strong>Agency</strong> <strong>Financial</strong> Operations 2,893 3,273 3,334 61 35.2 34.0 35.0 1.0(2001) Investigative Services Bureau(2301) Firearms and Tool Mark Examination Division 1,180 1,155 493 -662 9.1 12.0 3.0 -9.0(2600) <strong>Office</strong> <strong>of</strong> <strong>the</strong> Superintendent Detectives 42,626 41,011 38,088 -2,923 290.1 369.0 347.0 -22.0(2700) Narcotics and Special Investigations Branch 8,857 9,034 9,000 -35 73.6 79.0 74.0 -5.0(2800) Forensic Science Division 14,720 14,491 12,352 -2,139 160.3 143.0 121.0 -22.0(2900) Youth Investigative Services Division 6,682 6,353 6,155 -198 68.4 68.0 62.0 -6.0Subtotal (2001) Investigative Services Bureau 74,065 72,044 66,088 -5,956 601.5 671.0 607.0 -64.0(Continued on next page)FY 2013 Proposed <strong>Budget</strong> and <strong>Financial</strong> PlanMetropolitan Police DepartmentC-7
Table FA0-4 (Continued)(dollars in thousands)Dollars in ThousandsFull-Time EquivalentsChangeChangeActual Approved Proposed from Actual Approved Proposed fromDivision/Activity FY 2011 FY 2012 FY 2013 FY 2012 FY 2011 FY 2012 FY 2013 FY 2012(3000) Special Field Operations(3565) HS/Enhancing Curr HS Sec Capabilites 243 0 0 0 0.0 0.0 0.0 0.0Subtotal (3000) Special Field Operations 243 0 0 0 0.0 0.0 0.0 0.0(4001) Strategic Services Bureau(4300) Strategic Change Division 1,175 1,198 1,087 -111 10.1 12.0 10.0 -2.0(4400) Research and Analytical Services Division 2,141 2,150 3,096 946 30.2 28.0 40.0 12.0(4500) Policy and Standards Division 1,053 1,180 1,148 -32 16.1 11.0 10.0 -1.0Subtotal (4001) Strategic Services Bureau 4,369 4,528 5,331 802 56.4 51.0 60.0 9.0(5001) Corporate Support Bureau(5100) General Support Services Division 7,634 9,151 9,411 261 64.3 54.0 61.0 7.0(5400) Police Business Services Division 4,378 4,536 4,637 101 63.4 53.0 55.6 2.6Subtotal (5001) Corporate Support Bureau 12,012 13,686 14,048 362 127.7 107.0 116.6 9.6(6001) Pr<strong>of</strong>essional Development Bureau(6300) <strong>Office</strong> <strong>of</strong> Human Resource Management 15,319 15,610 16,815 1,205 178.1 60.0 52.0 -8.0(6500) <strong>Office</strong> <strong>of</strong> Pr<strong>of</strong>essional Development 0 29 0 -29 0.0 0.0 0.0 0.0(6600) Police Academy 8,798 25,032 25,199 167 322.6 425.0 365.0 -60.0Subtotal (6001) Pr<strong>of</strong>essional Development Bureau 24,117 40,671 42,014 1,343 500.7 485.0 417.0 -68.0(7001) Assistant <strong>Chief</strong> Internal Affairs Bureau(7300) Internal Affairs Branch 5,730 5,476 5,459 -17 44.4 51.0 48.0 -3.0(7400) Force Investigations Branch 74 172 210 38 0.0 0.0 1.0 1.0(7500) EEOC Branch 547 651 545 -106 7.1 7.0 6.0 -1.0(7600) Compliance Monitoring Team 2,242 2,337 1,522 -814 33.3 24.0 15.0 -9.0(7700) Court Liaison Division 1,235 1,070 1,009 -61 16.1 15.0 13.0 -2.0Subtotal (7001) Assistant <strong>Chief</strong> Internal Affairs Bureau 9,828 9,707 8,746 -961 100.8 97.0 83.0 -14.0(9000) Homeland Security And Counter-Terrorism(9100) Homeland Security and Counter-Terrorism 77 0 0 0 0.0 0.0 0.0 0.0Subtotal (9000) Homeland Security and Counter-Terrorism 77 0 0 0 0.0 0.0 0.0 0.0(9001) Homeland Security Bureau(9200) Special Operations Division 56,737 46,511 56,759 10,248 270.1 247.0 241.0 -6.0(9300) Intelligence Fusion Division 7,328 6,958 6,920 -38 43.4 63.0 67.0 4.0Subtotal (9001) Homeland Security Bureau 64,065 53,469 63,680 10,210 313.5 310.0 308.0 -2.0(Continued on next page)Metropolitan Police DepartmentC-8FY 2013 Proposed <strong>Budget</strong> and <strong>Financial</strong> Plan
Table FA0-4 (Continued)(dollars in thousands)Dollars in ThousandsFull-Time EquivalentsChangeChangeActual Approved Proposed from Actual Approved Proposed fromDivision/Activity FY 2011 FY 2012 FY 2013 FY 2012 FY 2011 FY 2012 FY 2013 FY 2012(AMP1) <strong>Agency</strong> Management Program(1010) Personnel 257 250 392 142 4.0 2.0 3.0 1.0(1015) Training and Employee Development 107 220 222 2 0.0 0.0 0.0 0.0(1017) Labor Management (L-M) Partnership 431 432 451 19 2.0 4.0 4.0 0.0(1020) Contracting and Procurement 341 341 333 -8 0.0 0.0 0.0 0.0(1030) Property Management 1,529 696 568 -128 7.1 3.0 2.0 -1.0(1040) Information Technology 9,325 8,178 7,750 -428 38.5 41.0 34.0 -7.0(1055) Risk Management 132 142 1,852 1,710 2.0 1.0 12.0 11.0(1060) Legal Services 328 158 172 15 4.0 2.0 2.0 0.0(1070) Fleet Management 7,679 8,515 9,154 638 17.1 6.0 7.0 1.0(1080) Communications 838 1,048 1,036 -12 17.1 9.0 10.0 1.0(1085) Customer Service 3,632 3,720 3,005 -715 101.7 26.0 20.0 -6.0(1087) Language Access 187 234 125 -109 1.0 1.0 0.0 -1.0(1090) Performance Management 274 320 327 7 1.0 1.0 1.0 0.0Subtotal (AMP1) <strong>Agency</strong> Management Program 25,061 24,255 25,389 1,134 195.7 96.0 95.0 -1.0Total Proposed Operating <strong>Budget</strong> 479,666 478,537 496,206 17,669 4,901.4 4,781.0 4,609.6 -171.4(Change is calculated by whole numbers and numbers may not add up due to rounding)Note: For more detailed information regarding <strong>the</strong> proposed funding for <strong>the</strong> activities within this agency’s divisions, please see Schedule 30-PBBProgram Summary by Activity in <strong>the</strong> FY 2013 Operating Appendices located on <strong>the</strong> <strong>Office</strong> <strong>of</strong> <strong>the</strong> <strong>Chief</strong> <strong>Financial</strong> <strong>Office</strong>r’s website.FY 2013 Proposed <strong>Budget</strong> ChangesThe Metropolitan Police Department’s (MPD) proposed FY 2013 gross budget is $496,206,043, which representsa 3.7 percent increase over its FY 2012 approved gross budget <strong>of</strong> $478,536,548. The budget is comprised <strong>of</strong>$462,390,328 in Local funds, $2,729,967 in Federal Grants funds, $8,535,175 in Special Purpose Revenue funds,and $22,550,573 in Intra-District funds.Current Services Funding LevelThe Current Services Funding Level (CSFL) is a Local funds ONLY representation <strong>of</strong> <strong>the</strong> true cost <strong>of</strong> operatingDistrict agencies, before consideration <strong>of</strong> policy decisions. The CSFL reflects changes from <strong>the</strong> FY2012 approved budget across multiple programs, and it estimates how much it would cost an agency tocontinue its current programs and operations into <strong>the</strong> following fiscal year. The initial adjustments in <strong>the</strong>budget proposal represent changes that should be compared to <strong>the</strong> FY 2013 CSFL budget and not necessarilychanges made to <strong>the</strong> FY 2012 Local funds budget. The FY 2013 CSFL adjustments to <strong>the</strong> FY 2012Local funds budget are described in table 5 <strong>of</strong> this agency's budget chapter. Please see <strong>the</strong> CSFLDevelopment section within Volume 1: Executive Summary for more information regarding <strong>the</strong> methodologyused and components that comprise <strong>the</strong> CSFL.MPD’s FY 2013 CSFL budget is $459,912,458 which represents a $17,841,090, or 4.0, percent increase over<strong>the</strong> FY 2012 approved Local funds budget <strong>of</strong> $442,071,368.FY 2013 Proposed <strong>Budget</strong> and <strong>Financial</strong> PlanMetropolitan Police DepartmentC-9
Major CSFL Cost DriversThe FY 2013 CSFL calculated for MPD included ano<strong>the</strong>r adjustment entry that is not described in detailon table 5. This adjustment was made for a total increase <strong>of</strong> <strong>of</strong> $12,039,404 to right-size baseline localfunding for MPD's operational needs. The agency's plan in FY 2013 for allocation <strong>of</strong> <strong>the</strong> additional fundingprovides $7,827,263 for MPD's 5.0 percent Base Retention Differential pay, $3,363,000 to support50 <strong>of</strong>ficers currently funded by <strong>the</strong> COPS More federal grant in FY 2012, and $849,141 for Tech Pay andHazardous Pay.Initial Adjusted <strong>Budget</strong>Eliminate: MPD’s budget proposal for Special Purpose Revenue funds includes a reduction <strong>of</strong> $135,000due to <strong>the</strong> elimination <strong>of</strong> <strong>the</strong> revenue account for <strong>the</strong> Gang Task Force.Reduce: The proposed budget for Federal Grant funds includes several adjustments that align <strong>the</strong> budgetwith programmatic needs. These adjustments include net reductions <strong>of</strong> $34,754 for reallocation <strong>of</strong> fundingfrom Contractual Services to O<strong>the</strong>r Services and Charges, $71,000 to align <strong>the</strong> budget for overtimewith projected costs for Motor Carrier and Boating Safety, $80,000 due to reallocation <strong>of</strong> funding fromfuel to maintenance, $123,300 due to reallocation <strong>of</strong> funding from Equipment and Equipment Rental toO<strong>the</strong>r Services and Charges, and $178,111 to reflect adjustment <strong>of</strong> <strong>the</strong> budget for <strong>the</strong> uncertainty <strong>of</strong> <strong>the</strong>Body Armor grant award.Cost Increase: MPD’s budget proposal for Local funds includes increases <strong>of</strong> $403,859 to cover cost projectionsfor Contractual Services and $196,450 for Supplies and Materials. Adjustment in Federal Grantfunds include increases <strong>of</strong> $658,000 and 6.0 FTEs to align <strong>the</strong> budget with projected grant awards from<strong>the</strong> COPS More grant, $156,000 to reflect reallocation <strong>of</strong> funds from nonpersonal services to personal servicesto cover an additional 1.9 FTEs , and $142,865 to cover maintenance contracts.In Special Purpose Revenue funds, MPD proposes an increase <strong>of</strong> $373,000 and 6.8 FTEs in <strong>the</strong><strong>Agency</strong> Management Program. This adjustment is based on revenue projections for <strong>the</strong> United States<strong>Office</strong> <strong>of</strong> Personnel Management (OPM) and o<strong>the</strong>r fingerprinting projects. The budget proposal forIntra-District funds includes an increase <strong>of</strong> $816,000 and 7.8 FTEs for personal services costs includingsalary steps and projected Fringe Benefits costs. The additional positions support <strong>the</strong> fingerprinting andhighway safety projects. MPD also proposes an increase <strong>of</strong> $495,000 to provide additional funding for <strong>the</strong>Police and Fire Clinic and costs related to School Security.Cost Decrease: MPD proposes adjustments in Local funds for decreases <strong>of</strong> $75,000 to align <strong>the</strong> budgetwith fixed costs estimates for janitorial services from <strong>the</strong> Department <strong>of</strong> General Services (DGS), $200,162to <strong>of</strong>fset <strong>the</strong> Fixed Cost transfer to Department <strong>of</strong> General Services, and $325,147 to align <strong>the</strong> budget withcost projections for O<strong>the</strong>r Services and Charges.In Special Purpose Revenue funds, <strong>the</strong> budget proposal includes decreases <strong>of</strong> $5,000 to align <strong>the</strong> budgetwith revenue projections for federal reimbursement for vehicle leases, $28,800 to reflect <strong>the</strong> shift <strong>of</strong>fuel reimbursements to maintenance contracts, $274,691 to reflect a reduction in funds related to assetsforfeiture and federally reimbursable tasks, and $362,293 to reflect <strong>the</strong> shift <strong>of</strong> OPM records check topersonal services.Transfer Out: MPD’s budget proposal in Local funds reflects a reduction <strong>of</strong> $1,435,500 due to transfer <strong>of</strong>fixed costs related items to DGS in FY 2013. These fixed costs items were budgeted in Special PurposeRevenue funds in <strong>the</strong> prior year that are not available in FY 2013.Shift: MPD anticipates that federal funding through <strong>the</strong> COPS More grant will not be available in FY2013. Therefore, funding in <strong>the</strong> amount <strong>of</strong> $3,363,000 in Federal Grants that supported <strong>the</strong> 50 FTEs inMetropolitan Police DepartmentC-10FY 2013 Proposed <strong>Budget</strong> and <strong>Financial</strong> Plan
FY 2012 are now being shifted to Local funds in FY 2013. In Local funds, <strong>the</strong> dollar effect <strong>of</strong> this shiftwas part <strong>of</strong> <strong>the</strong> $12,039,404 adjustment to <strong>the</strong> CSFL.Correct: Remove 167 unfunded FTEs in Local funds.Additionally Adjusted <strong>Budget</strong>Technical Adjustment: Adjustment <strong>of</strong> fringe benefits to restore <strong>the</strong> District Government contribution for employeehealth insurance from 72 percent implemented in <strong>the</strong> FY 2011 budget, to 75 percent in FY 2013. These adjustmentsresulted in an increase <strong>of</strong> $1,160,013 in Local funds, $3,296 in Federal Grant funds, $1,541 in SpecialPurpose Revenue funds, and $1,740 in Intra-District funds.Additional Adjustments: Federal Grants were adjusted by $3,296 in vacancy savings to <strong>of</strong>fset health insurancecontribution.Policy InitiativesCost Increase: In Local funds, equipment costs associated with new automated traffic enforcement initiatives(one-time) result in an increase in funding for <strong>the</strong> Homeland Security Bureau <strong>of</strong> $4,224,000, andrecurring operating costs associated with <strong>the</strong> new automated traffic enforcement initiatives fur<strong>the</strong>r increase<strong>the</strong> Homeland Security Bureau budget by $1,587,000.Cost Decrease: Local funds were reduced by $485,302 in Contractual Services, $171,368 in nonpersonalservices, and $90,000 in <strong>the</strong> Corporate Support Bureau to publish notices in <strong>the</strong> newspapers to onlinepublishing. Federal Grants funds were reduced in Contractual Services by $60,000. Intra-District fundswere reduced by $70,000 in Contractual Services, $19,000 in Equipment and Equipment Rental, and$3,200 in O<strong>the</strong>r Services and Charges.Shift: $485,302 and 8.0 FTEs were shifted from Special Purpose Revenue funds to Local funds due to<strong>the</strong> discontinuation <strong>of</strong> <strong>the</strong> U.S. <strong>Office</strong> <strong>of</strong> Personnel Management Memorandum <strong>of</strong> Agreement for recordscheck services.Transfer Out: MPD transferred $2,576,000 and 25.0 FTEs, which represents <strong>the</strong> cost <strong>of</strong> Firearms,Fingerprinting and Trace Evidence activities, to <strong>the</strong> new Department <strong>of</strong> Forensic Sciences. An additional$220,600 and 2.0 FTEs were transferred from <strong>the</strong> Regional Field Operations program to <strong>the</strong> Department<strong>of</strong> Forensic Sciences.FY 2013 Proposed <strong>Budget</strong> and <strong>Financial</strong> PlanMetropolitan Police DepartmentC-11
FY 2012 Approved <strong>Budget</strong> to FY 2013 Proposed <strong>Budget</strong>, by Revenue TypeTable FA0-5 itemizes <strong>the</strong> changes by revenue type between <strong>the</strong> FY 2012 approved budget and <strong>the</strong> FY 2013 proposedbudget.Table FA0-5(dollars in thousands)DIVISION BUDGET FTELOCAL FUNDS: FY 2012 Approved <strong>Budget</strong> and FTE 442,071 4,714.2Recurring <strong>Budget</strong> Items Multiple Programs 12,039 0.0Fringe Benefit Rate Adjustment Multiple Programs 3,388 0.0Consumer Price Index Multiple Programs 890 0.0Personal Services Growth Factor Multiple Programs 1,524 0.0FY 2013 Current Services Funding Level <strong>Budget</strong> (CSFL) 459,912 4,714.2Cost Increase: Additional funding to cover Contractual Services Multiple Programs 404 0.0Cost Increase: Additional funding to cover Supplies and Materials Multiple Programs 196 0.0Cost Decrease: Align <strong>the</strong> personal services budget to Multiple Programs 0 -167.0programmatic needs and eliminate unfunded positionsCost Decrease: Align <strong>the</strong> budget with fixed costs estimates Multiple Programs -75 0.0for janitorial services from <strong>the</strong> DGSCost Decrease: To <strong>of</strong>fset Fixed Cost transfer to DGS Multiple Programs -200 0.0Cost Decrease: Align <strong>the</strong> budget with cost projections Multiple Programs -325 0.0for O<strong>the</strong>r Services and ChargesTransfer Out: Transfer fixed costs previously supported <strong>Agency</strong> Management Program -1,436 0.0by Special Purpose Revenue funds to DGSCorrect: 50 positions moved to Local funds due to Multiple Programs 0 50.0expiration <strong>of</strong> <strong>the</strong> COPS More Grant awardFY 2013 Initial Adjusted <strong>Budget</strong> 458,477 4,597.2Technical Adjustment: Health insurance contribution Multiple Programs 1,160 0.0FY 2013 Additionally Adjusted <strong>Budget</strong> 459,637 4,597.2FY 2013 Policy InitiativesCost Increase: Equipment costs associated with new Homeland Security Bureau 4,224 0.0automated traffic enforcement initiatives (One-Time)Cost Increase: Recurring operating costs associated Homeland Security Bureau 1,587 0.0with new automated traffic enforcementCost Decrease: From Contractual Services and O<strong>the</strong>r Multiple Programs -485 0.0Cost Decrease: Hold MPD's nonpersonal services budget to inflation Multiple Programs -171 0.0Cost Decrease: Reduce cost by modernizing requirements Corporate Support Bureau -90 0.0to publish notices in newspapers to online publishingTransfer Out: Firearms, Fingerprinting and Trace Evidence Investigative Services Bureau -2,576 -25.0activities to <strong>the</strong> Department <strong>of</strong> Forensic SciencesTransfer Out: To <strong>the</strong> Department <strong>of</strong> Forensic Science Regional Field Operations -221 -2.0Shift: From Special Purpose Revenue funds to Local funds Multiple Programs 485 8.0LOCAL FUNDS: FY 2013 Proposed <strong>Budget</strong> and FTE 462,390 4,578.3FEDERAL GRANT FUNDS: FY 2012 Approved <strong>Budget</strong> and FTE 5,683 59.5Reduce: Reallocate funding from Contractual Services Multiple Programs -35 0.0to O<strong>the</strong>r Services and ChargesReduce: Align <strong>the</strong> budget for overtime with projected Multiple Programs -71 0.0costs for Motor Carrier and Boating SafetyReduce: Reallocate funding from fuel to maintenance Multiple Programs -80 0.0Reduce: Reallocate funding from Equipment and Equipment Multiple Programs -123 0.0Rental to O<strong>the</strong>r Services and ChargesReduce: Adjust <strong>the</strong> budget for <strong>the</strong> uncertainty <strong>of</strong> <strong>the</strong> Multiple Programs -178 0.0Body Armor grant award(Continued on next page)Metropolitan Police DepartmentC-12FY 2013 Proposed <strong>Budget</strong> and <strong>Financial</strong> Plan
Table FA0-5 (Continued)(dollars in thousands)DIVISION BUDGET FTEFEDERAL GRANT FUNDS (cont.)Cost Increase: New <strong>Office</strong>r positions <strong>Agency</strong> Management Program 658 6.0Cost Increase: Funds shifted from nonpersonal services Multiple Programs 156 1.9to personal servicesCost Increase: Reallocation <strong>of</strong> funding from equipment Multiple Programs 143 0.0to maintenance contractsShift: 50 positions to Local funds and reduced Federal <strong>Agency</strong> Management Program -3,363 -50.0grant due to expiration <strong>of</strong> <strong>the</strong> COPS More grant awardFY 2013 Initial Adjusted <strong>Budget</strong> 2,790 17.4Additional Adjustments: Adjusted vacancy savings to Multiple Programs -3 0.0<strong>of</strong>fset <strong>the</strong> health contribution adjustmentTechnical Adjustment: Health insurance contribution Multiple Programs 3 0.0FY 2013 Additionally Adjusted <strong>Budget</strong> 2,790 17.4FY 2013 Policy InitiativesCost Decrease: In Contractual Services Multiple Programs -60 0.0FEDERAL GRANT FUNDS: FY 2013 Proposed <strong>Budget</strong> and FTE 2,730 17.4SPECIAL PURPOSE REVENUE FUNDS: FY 2012 Approved <strong>Budget</strong> and FTE 9,452 3.0Eliminate: Adjust <strong>the</strong> budget to reflect <strong>the</strong> elimination Multiple Programs -135 0.0<strong>of</strong> revenue account for <strong>the</strong> Gang Task ForceCost Increase: Support additional FTEs for <strong>the</strong> OPM <strong>Agency</strong> Management Program 373 6.8fingerprinting projectsCost Decrease: Align <strong>the</strong> budget with revenue projections Multiple Programs -5 0.0for federal reimbursement for vehicle leasesCost Decrease: Adjust <strong>the</strong> budget to reflect <strong>the</strong> shift Multiple Programs -29 0.0<strong>of</strong> fuel reimbursements to maintenance contractsCost Decrease: Adjust <strong>the</strong> budget to reflect <strong>the</strong> decrease Multiple Programs -275 0.0in funds related to assets forfeiture and federally reimbursable tasksCost Decrease: Adjust <strong>the</strong> budget to reflect <strong>the</strong> shift <strong>of</strong> <strong>the</strong> Multiple Programs -362 0.0OPM records check to personal servicesFY 2013 Initial Adjusted <strong>Budget</strong> 9,019 9.8Technical Adjustment: Health insurance contribution Multiple Programs 2 0.0FY 2013 Additionally Adjusted <strong>Budget</strong> 9,020 9.8FY 2013 Policy InitiativesShift: In Contractual Services and O<strong>the</strong>r to Local funds Multiple Programs -485 -8.0SPECIAL PURPOSE REVENUE FUNDS: FY 2013 Proposed <strong>Budget</strong> and FTE 8,535 1.8INTRA-DISTRICT FUNDS: FY 2012 Approved <strong>Budget</strong> and FTE 21,330 4.2Cost Increase: Additional positions and overtime Multiple Programs 816 7.8Cost Increase: Inflationary increase for Police and Fire Clinic Multiple Programs 495 0.0FY 2013 Initial Adjusted <strong>Budget</strong> 22,641 12.0Technical Adjustment: Health insurance contribution Multiple Programs 2 0.0FY 2013 Additionally Adjusted <strong>Budget</strong>: 22,643 12.0FY 2013 Policy InitiativesCost Decrease: In Contractual Services Regional Field -70 0.0Cost Decrease: In Equipment and Equipment Rental Services Multiple Programs -19 0.0Cost Decrease: In O<strong>the</strong>r Services and Charges Regional Field -3 0.0INTRA-DISTRICT FUNDS: FY 2013 Proposed <strong>Budget</strong> and FTE 22,551 12.0Gross for FA0 - Metropolitan Police Department 496,206 4,609.6Change is calculated by whole numbers and numbers may not add up due to rounding)FY 2013 Proposed <strong>Budget</strong> and <strong>Financial</strong> PlanMetropolitan Police DepartmentC-13
<strong>Agency</strong> Performance PlanThe agency’s performance plan has <strong>the</strong> following objectives for FY 2013:1. Patrol Services and School Security BureauObjective 1: Safeguard <strong>the</strong> District <strong>of</strong> Columbia and protect its residents and visitors.Objective 2: Provide <strong>the</strong> highest quality police service with integrity, compassion, and a commitment to innovation.Patrol Services and School Security BureauFY 2010 FY 2011 FY 2011 FY 2012 FY 2013 FY 2014Measure Actual Target Actual Projection Projection ProjectionPercentage change in D.C. Code Index violent crime -7.3% -5% -4.9% -5% -5% -5%Percentage change in D.C. Code Index property crime -14.7% -5% 5.3% -5% -5% -5%2% reduction 2% reduction 2% reductionRate <strong>of</strong> sustained citizen allegations <strong>of</strong> policemisconduct per 1,000 sworn members 10.8from previousyear 12.2 11.9from previousyearfrom previousyearPercentage increase in <strong>the</strong> number <strong>of</strong> email accounts10% increaseover previous10% increaseover previous10% increaseover previous10% increaseover previouson Police District LISTSERVS 14.1% year 14.6% year year yearAverage response time (in minutes) to Priority 1 % reduction 5% reduction 5% reduction 5% reductioncalls from time <strong>of</strong> dispatch to <strong>the</strong> arrival <strong>of</strong> <strong>the</strong> from previous from previous from previous from previousfirst <strong>of</strong>ficer on <strong>the</strong> scene (per district) 5.8 year TBD year year yearMetropolitan Police DepartmentC-14FY 2013 Proposed <strong>Budget</strong> and <strong>Financial</strong> Plan
2. Investigative Services BureauObjective 1: Safeguard <strong>the</strong> District <strong>of</strong> Columbia and protect its residents and visitors.Investigative Services BureauFY 2010 FY 2011 FY 2011 FY 2012 FY 2013 FY 2014Measure Actual Target Actual Projection Projection ProjectionPercentage change in D.C. Code Index violent crime -7.3%% -5% -4.9% -5% -5% -5%Percentage change in D.C. Code Index property crime -14.7% -5% 5.3% -5% -5% -5%Rate <strong>of</strong> sustained citizen allegations <strong>of</strong> police 2% 2% reduction from 2% reduction frommisconduct per 1,000 sworn members 10.8 reduction 12.2 12.2 previous year previous yearfromyearClearance rate for homicides * 79.4% 75.0% 95.4% 75.0% 75.0% 75.0%Clearance rate for forcible rape * 59.8% 62.8% NotAvailable *** *** ***Clearance rate for robbery * 20.0% 23.6% NotAvailable *** *** ***Clearance rate for aggravated assault * 57.6% 60.5% NotAvailable *** *** ***Clearance rate for burglary * 9.4% 9.9% NotAvailable *** *** ***Clearance rate for larceny-<strong>the</strong>ft * 8.5% 17.0% NotAvailable *** *** ***Clearance rate for motor vehicle <strong>the</strong>ft * 3.2% 9.1% NotAvailable *** *** ***5% increase 5% increase 5% increaseover <strong>the</strong> previous over <strong>the</strong> previous over <strong>the</strong> previousPercentage <strong>of</strong> motor vehicle <strong>the</strong>fts resolved * 15.3% 16.1% Not year year yearAvailable* All clearance rates are reported on a calendar year basis consistent with national FBI reporting. Except for <strong>the</strong> homicide clearance rate, most clearancerates are finalized in March 2012, as aligned with reporting to <strong>the</strong> FBI.***Exceed by 5 percent <strong>the</strong> benchmark average clearance rate or previous year’s actual, whichever is higher.FY 2013 Proposed <strong>Budget</strong> and <strong>Financial</strong> PlanMetropolitan Police DepartmentC-15
3. Homeland Security BureauObjective 1: Safeguard <strong>the</strong> District <strong>of</strong> Columbia and protect its residents and visitors.Objective 2: Improve police service to <strong>the</strong> public through <strong>the</strong> integration <strong>of</strong> <strong>the</strong> department’s people, technologyand business systems.Homeland Security BureauFY 2010 FY 2011 FY 2011 FY 2012 FY 2013 FY 2014Measure Actual Target Actual Projection Projection ProjectionPercentage change in D.C. Code Index violent crime -7.3% -5% -4.9% -5% -5% -5%Percentage change in D.C. Code Index property crime -14.7% -5% 5.3% -5% -5% -5%Rate <strong>of</strong> sustained citizen allegations <strong>of</strong> police2% reductionfrom previous2% reductionfrom previous2% reductionfrom previousmisconduct per 1,000 sworn members 10.8 year 12.2 11.9 year year4. Pr<strong>of</strong>essional Development and Internal Affairs BureausObjective 1: Safeguard <strong>the</strong> District <strong>of</strong> Columbia and protect its residents and visitors.Objective 2: Provide <strong>the</strong> highest quality police service with integrity, compassion, and a commitment to innovation.Objective 3: Improve police service to <strong>the</strong> public through <strong>the</strong> integration <strong>of</strong> <strong>the</strong> department’s people, technologyand business systems.Pr<strong>of</strong>essional Development and Internal Affairs BureausFY 2010 FY 2011 FY 2011 FY 2012 FY 2013 FY 2014Measure Actual Target Actual Projection Projection ProjectionPercentage change in D.C. Code Index violent crime -7.3% -5% -4.9% -5% -5% -5%Percentage change in D.C. Code Index property crime -14.7% -5% 5.3% -5% -5% -5%2% reduction 2% reduction 2% reductionRate <strong>of</strong> sustained citizen allegations <strong>of</strong> police from previous from previous from previousmisconduct per 1,000 sworn members 10.8 year 12.2 11.9 year yearAverage court overtime hours per arrest 2% reduction 2% reductionfrom previous from previous3.22 3.16 2.97 2.91 year yearMetropolitan Police DepartmentC-16FY 2013 Proposed <strong>Budget</strong> and <strong>Financial</strong> Plan
5. Strategic and Corporate Support Services BureausObjective 1: Safeguard <strong>the</strong> District <strong>of</strong> Columbia and protect its residents and visitors.Objective 2: Provide <strong>the</strong> highest quality police service with integrity, compassion, and a commitment to innovation.Objective 3: Improve police service to <strong>the</strong> public through <strong>the</strong> integration <strong>of</strong> <strong>the</strong> department’s people, technologyand business systems.Strategic and Corporate Support Services BureausFY 2010 FY 2011 FY 2011 FY 2012 FY 2013 FY 2014Measure Actual Target Actual Projection Projection ProjectionPercentage change in D.C. Code Index violent crime -7.3% -5% -4.9% -5% -5% -5%Percentage change in D.C. Code Index property crime -14.7% -5% 5.3% -5% -5% -5%Rate <strong>of</strong> sustained citizen allegations <strong>of</strong> 2% reduction 2% reduction 2% reductionpolice misconduct per 1,000 sworn from previous from previous from previousmembers 10.8 year 12.2 11.9 year yearAverage daily fleet availability 96.3% 95% 96.4% 95% 95% 95%FY 2013 Proposed <strong>Budget</strong> and <strong>Financial</strong> PlanMetropolitan Police DepartmentC-17
6. Operations and <strong>Agency</strong> Management DivisionObjective 1: Safeguard <strong>the</strong> District <strong>of</strong> Columbia and protect its residents and visitors.Objective 2: Provide <strong>the</strong> highest quality police service with integrity, compassion, and a commitment to innovation.Objective 3: Improve police service to <strong>the</strong> public through <strong>the</strong> integration <strong>of</strong> <strong>the</strong> Department’s people, technologyand business systems.Operations and <strong>Agency</strong> Management DivisionFY 2010 FY 2011 FY 2011 FY 2012 FY 2013 FY 2014Measure Actual Target Actual Projection Projection ProjectionPercentage change in D.C. Code Index violent crime -7.3% -5% -4.9% -5% -5% -5%Percentage change in D.C. Code Index property crime -14.7% -5% 5.3% -5% -5% -5%2% reduction 2% reduction 2% reductionRate <strong>of</strong> sustained citizen allegations <strong>of</strong> police from previous from previous from previousmisconduct per 1,000 sworn members 10.8 year 12.2 11.9 year yearPercentage increase in <strong>the</strong> number <strong>of</strong> email 10% increase 10% increase 10% increase 10% increaseemail accounts on Police District 14.1% over previous 14.6% over previous over previous over previousLISTSERVS year year year yearMetropolitan Police DepartmentC-18FY 2013 Proposed <strong>Budget</strong> and <strong>Financial</strong> Plan
Fire and Emergency Medical ServicesDepartmentwww.fems.dc.govTelephone: 202-673-3320(FB0)% ChangeFY 2011 FY 2012 FY 2013 fromDescription Actual Approved Proposed FY 2012Operating <strong>Budget</strong> $194,507,068 $195,422,438 $199,373,728 2.0FTEs 2,168.9 2,128.0 2,130.0 0.1The mission <strong>of</strong> <strong>the</strong> District <strong>of</strong> Columbia Fire and Emergency MedicalServices Department (DCFEMS) is to promote safety and healththrough excellent pre-hospital medical care, fire suppression, hazardousmaterials response, technical rescue, homeland security preparedness,and fire prevention and education in <strong>the</strong> District <strong>of</strong>Columbia.Summary <strong>of</strong> ServicesDCFEMS provides fire suppression, emergency medical services (EMS), homeland security and special operationsresponse – collectively known as all-hazards protection – for residents and visitors to <strong>the</strong> District <strong>of</strong> Columbia from 33neighborhood fire stations that deploy 39 EMS transport units (ambulances), 33 engine companies, 16 ladder trucks,3 heavy-rescue squads, 1 hazardous materials unit and 1 fire boat company. Fourteen <strong>of</strong> <strong>the</strong>se transport units and 20<strong>of</strong> <strong>the</strong>se engine companies are staffed by paramedics providing advanced life support (ALS) care. The departmentresponds to more than 150,000 911 calls each year and transports more than 90,000 patients to local hospitals.DCFEMS also provides services for special events unique to <strong>the</strong> nation’s capital, such as demonstrations, publicga<strong>the</strong>rings, and presidential inaugurations. Additionally, <strong>the</strong> department provides fire suppression and emergency medicalprotection for presidential motorcades and helicopter landings.Supporting all-hazards District-wide protection is a business model emphasizing timely, resourceful, efficient andeffective combinations <strong>of</strong> programs, people, equipment, and mobile technology delivered at an individual, neighborhood,and community level. DCFEMS is responsible for <strong>the</strong> internal training and development, along with humanresources administration, for more than 2,000 employees. Fire and life safety inspection, education, and interventionprograms touch more than 10,000 District residents each year through community presentations, smoke alarminstallations, health status/disease prevention screenings, car seat installations, and CPR instruction. The department’scost recovery programs for ambulance transport, along with fire prevention fees and permits, create $23 million inannual revenue.The agency’s FY 2013 proposed budget is presented in <strong>the</strong> following tables:FY 2013 Proposed <strong>Budget</strong> and <strong>Financial</strong> PlanFire and Emergency Medical Services DepartmentC-19
FY 2013 Proposed Gross Funds Operating <strong>Budget</strong>, by Revenue TypeTable FB0-1 contains <strong>the</strong> proposed FY 2013 agency budget compared to <strong>the</strong> FY 2012 approved budget. It alsoprovides FY 2010 and FY 2011 actual expenditures.Table FB0-1(dollars in thousands)ChangeActual Actual Approved Proposed from PercentAppropriated Fund FY 2010 FY 2011 FY 2012 FY 2013 FY 2012 Change*General FundLocal Funds 193,326 191,932 193,902 197,854 3,951 2.0Special Purpose Revenue Funds 1,504 1,506 1,520 1,520 0 0.0Total for General Fund 194,830 193,438 195,422 199,374 3,951 2.0Federal ResourcesFederal Grant Funds 1,982 0 0 0 0 N/ATotal for Federal Resources 1,982 0 0 0 0 N/AIntra-District FundsIntra-District Funds 2,721 1,069 0 0 0 N/ATotal for Intra-District Funds 2,721 1,069 0 0 0 N/AGross Funds 199,533 194,507 195,422 199,374 3,951 2.0*Percent change is based on whole dollars.Note: If applicable, for a breakdown <strong>of</strong> each Grant (Federal and Private), Special Purpose Revenue type and Intra-District agreement, pleaserefer to Schedule 80 <strong>Agency</strong> Summary by Revenue Source in <strong>the</strong> FY 2013 Operating Appendices located on <strong>the</strong> <strong>Office</strong> <strong>of</strong> <strong>the</strong> <strong>Chief</strong><strong>Financial</strong> <strong>Office</strong>r’s website.FY 2013 Proposed Full-Time Equivalents, by Revenue TypeTable FB0-2 contains <strong>the</strong> proposed FY 2013 FTE level compared to <strong>the</strong> FY 2012 approved FTE level by revenuetype. It also provides FY 2010 and FY 2011 actual data.Table FB0-2ChangeActual Actual Approved Proposed from PercentAppropriated Fund FY 2010 FY 2011 FY 2012 FY 2013 FY 2012 ChangeGeneral FundLocal Funds 2,201.5 2,168.9 2,128.0 2,130.0 2.0 0.1Total for General Fund 2,201.5 2,168.9 2,128.0 2,130.0 2.0 0.1Total Proposed FTEs 2,201.5 2,168.9 2,128.0 2,130.0 2.0 0.1Fire and Emergency Medical Services DepartmentC-20FY 2013 Proposed <strong>Budget</strong> and <strong>Financial</strong> Plan
FY 2013 Proposed Operating <strong>Budget</strong>, by Comptroller Source GroupTable FB0-3 contains <strong>the</strong> proposed FY 2013 budget at <strong>the</strong> Comptroller Source Group (object class) level comparedto <strong>the</strong> FY 2012 approved budget. It also provides FY 2010 and FY 2011 actual expenditures.Table FB0-3(dollars in thousands)ChangeActual Actual Approved Proposed from PercentComptroller Source Group FY 2010 FY 2011 FY 2012 FY 2013 FY 2012 Change*11 - Regular Pay - Continuing Full Time 137,529 140,515 145,378 144,443 -935 -0.612 - Regular Pay - O<strong>the</strong>r 165 100 308 288 -20 -6.513 - Additional Gross Pay 6,357 7,280 5,612 7,604 1,992 35.514 - Fringe Benefits - Current Personnel 20,039 21,284 22,189 24,239 2,050 9.215 - Overtime Pay 11,892 4,498 2,825 3,325 500 17.799 - Unknown Payroll Postings 31 13 0 0 0 N/ASubtotal Personal Services (PS) 176,014 173,690 176,313 179,899 3,586 2.020 - Supplies and Materials 5,420 4,358 4,377 4,458 81 1.830 - Energy, Comm. and Building Rentals 3,969 91 0 0 0 N/A31 - Telephone, Telegraph, Telegram, Etc. 1,039 56 0 0 0 N/A32 - Rentals - Land and Structures 256 0 0 0 0 N/A33 - Janitorial Services 901 -24 0 0 0 N/A34 - Security Services 16 0 0 0 0 N/A35 - Occupancy Fixed Costs 842 5 0 0 0 N/A40 - O<strong>the</strong>r Services and Charges 3,563 4,122 2,673 2,847 175 6.541 - Contractual Services - O<strong>the</strong>r 4,870 4,794 4,584 4,676 92 2.050 - Subsidies and Transfers 0 6,318 6,318 6,318 0 0.070 - Equipment and Equipment Rental 2,644 1,098 1,159 1,177 18 1.6Subtotal Nonpersonal Services (NPS) 23,519 20,817 19,110 19,474 365 1.9Gross Funds 199,533 194,507 195,422 199,374 3,951 2.0*Percent change is based on whole dollars.FY 2013 Proposed <strong>Budget</strong> and <strong>Financial</strong> PlanFire and Emergency Medical Services DepartmentC-21
Program DescriptionThe District <strong>of</strong> Columbia Fire and Emergency Medical Services Department operates through <strong>the</strong> following 8programs:Field Operations – provides emergency medical service, fire suppression, rescue, and special operations services tocitizens, visitors, and employees in order to minimize loss <strong>of</strong> life and property.This program contains <strong>the</strong> following 4 activities:■ Fire Rescue Operations – provides fire suppression, fire rescue, property salvage and overhaul, and vehicleaccident rescue and extrication;■ Special Operations – provides specialized rescue, evacuation, and pre-emergency planning services for those indanger during hazardous material incidents, Metro and rail emergencies, mass casualty incidents, andtechnical rescue incidents;■ Emergency Medical Services Operations – provides emergency medical services including pre-hospitalbasic/advanced life support care, emergency transport services, and public service assistance on non-emergencyincidents; and■ Homeland Security – provides pre-emergency planning services for those in danger during possible terroristincidents, including those involving weapons <strong>of</strong> mass destruction, and for response to natural disasters so that<strong>the</strong> District residents and visitors can be safely protected, rescued, and treated.Fire Prevention and Education – provides investigation, public safety outreach, and inspection services to residents,property owners, and businesses so that <strong>the</strong>y can have <strong>the</strong> information needed to prevent emergency incidents.This program contains <strong>the</strong> following 4 activities:■ Inspections – executes facility inspections, building plan approvals, code enforcement, fire code advice,information, and referral services to residents, business owners and developers, and event planners in order tomaintain required inspection coverage, ensure code compliance, and reduce occurrence <strong>of</strong> fires;■ Investigations – provides investigation and intervention services to property owners, occupants, and o<strong>the</strong>r victimsin order to determine <strong>the</strong> origin and causes <strong>of</strong> fires that occur in <strong>the</strong> District <strong>of</strong> Columbia; performs public outreachand education efforts to prevent reoccurrence; and supports monetary recovery <strong>of</strong> property losses. Thisactivity also supports <strong>the</strong> investigation <strong>of</strong> all fires determined to be caused by arson and facilitates <strong>the</strong> arrest <strong>of</strong> thoseresponsible for <strong>the</strong> cause <strong>of</strong> those fires;■ Public Outreach – makes fire-safety and health education and information available to residents, propertyowners, and businesses so that <strong>the</strong>y can prevent fire and emergency medical incidents; and■ Technical Inspections – performs facility inspections, building plan approvals, code enforcement, fire code advice,and information and referral services to residents, business owners, developers, and event planners in order tomaintain required inspection coverage, ensure code compliance, and reduce fires. These include mandatory inspectionsthat require a higher degree <strong>of</strong> knowledge by <strong>the</strong> inspector, and may require <strong>the</strong> inspector to obtainadditional certifications.Employee Preparedness – provides employee wellness and specialized training services to employees so that <strong>the</strong>ycan meet prescribed standards and are prepared to safely perform <strong>the</strong> mission <strong>of</strong> <strong>the</strong> agency.This program contains <strong>the</strong> following 2 activities:■ Employee Wellness – extends health and counseling services to DCFEMS employees so that <strong>the</strong>y can beprepared to safely perform <strong>the</strong> mission <strong>of</strong> <strong>the</strong> agency; and■ Specialized Training – facilitates driver training, EMS certification, field operations training, recruit training,and o<strong>the</strong>r training services to DCFEMS employees so that <strong>the</strong>y can meet prescribed standards.Fire and Emergency Medical Services DepartmentC-22FY 2013 Proposed <strong>Budget</strong> and <strong>Financial</strong> Plan
Operations Support – provides emergency vehicle and facility maintenance and specialized network managementservices to employees so that <strong>the</strong>y can perform <strong>the</strong>ir assigned duties in a safe, effective, and efficient manner.This program contains <strong>the</strong> following 2 activities:■ Field Infrastructure – provides maintenance, repair, replacement <strong>of</strong> firehouses, and major capital improvementsto firehouses and o<strong>the</strong>r facilities to keep <strong>the</strong>m in operational condition and to provide emergency serviceproviders with a functional base so that <strong>the</strong>y can perform <strong>the</strong>ir assigned duties in an environment that is safe,code-compliant, and within accepted standards; and■ Inventory Management – maintains adequate levels <strong>of</strong> equipment and supply resources to employees so that<strong>the</strong>y can perform <strong>the</strong>ir assigned duties in a safe, cost-effective, and efficient manner.Policy and Planning – establishes strategic directions and coordinates District-consequential management for incidents.This program also identifies and addresses problems by developing initiatives to reduce mortality rates,property loss, and hazardous conditions. This program develops and implements regulations governing publicsafety, inter-agency response, inter-governmental coordination, and mitigation efforts. This program is alsoresponsible for compliance with policy and Equal-Employment Opportunity (EEO) regulations.This program contains <strong>the</strong> following 4 activities:■ <strong>Office</strong> <strong>of</strong> Standards – maintains <strong>the</strong> department’s policies and procedures, as well as <strong>the</strong> national standards foroperational staff;■ <strong>Office</strong> <strong>of</strong> Compliance – enforces <strong>the</strong> policies and procedures, as well as <strong>the</strong> national standards for operationalstaff;■ <strong>Office</strong> <strong>of</strong> Equity and Diversity – <strong>of</strong>fers a mechanism for staff to insure that <strong>the</strong>y are treated fairly withoutprejudice; and■ Emergency Communications – provides technological support so that communication is seamless andemergency dispatch is efficient.State Safety Oversight – provides program standards and supporting procedures for <strong>the</strong> State Oversight andSecurity <strong>Agency</strong>, and reviews and approves all rail transit agency System Safety Plans.Administrative Support (<strong>Agency</strong> Management) – provides for administrative support and <strong>the</strong> required tools toachieve operational and programmatic results. This program is standard for all agencies using performance-basedbudgeting.<strong>Agency</strong> <strong>Financial</strong> Operations – provides comprehensive and efficient financial management services to, and onbehalf <strong>of</strong>, District agencies so that <strong>the</strong> financial integrity <strong>of</strong> <strong>the</strong> District <strong>of</strong> Columbia is maintained. This programis standard for all agencies using performance-based budgeting.Program Structure ChangeThe District <strong>of</strong> Columbia Fire and Emergency Medical Services Department adds <strong>the</strong> State Safety Oversightprogram in <strong>the</strong> FY 2013 proposed budget.Protected Programs: In FY 2012, DCFEMS re-launched <strong>the</strong> Fire Cadet Program. The program targets recent highschool graduates who reside in <strong>the</strong> District with an interest in pursuing a career at <strong>the</strong> DCFEMS. This is animportant mechanism for creating jobs for <strong>the</strong> District youth.FY 2013 Proposed <strong>Budget</strong> and <strong>Financial</strong> PlanFire and Emergency Medical Services DepartmentC-23
FY 2013 Proposed Operating <strong>Budget</strong> and FTEs, by Program and ActivityTable FB0-4 contains <strong>the</strong> proposed FY 2013 budget by program and activity compared to <strong>the</strong> FY 2012 approved budget.It also provides <strong>the</strong> FY 2011 actual data.Table FB0-4(dollars in thousands)Dollars in ThousandsFull-Time EquivalentsChangeChangeActual Approved Proposed from Actual Approved Proposed fromProgram/Activity FY 2011 FY 2012 FY 2013 FY 2012 FY 2011 FY 2012 FY 2013 FY 2012(1000) Administrative Support(1010) Personnel 965 903 814 -90 5.9 6.0 5.0 -1.0(1015) Training and Employee Development 1,905 202 206 4 0.0 0.0 0.0 0.0(1030) Property Management 6,797 6,318 6,318 0 0.0 0.0 0.0 0.0(1040) Information Technology 1,514 1,136 1,261 125 6.9 6.0 7.0 1.0(1055) Risk Management 965 1,795 2,021 226 3.0 3.0 6.0 3.0(1060) Legal Services 234 250 255 5 0.0 0.0 0.0 0.0(1080) Communications 436 436 671 236 4.9 4.0 6.0 2.0(1090) Performance Management 1,661 1,595 4,102 2,507 13.8 11.0 30.0 19.0No Activity Assigned 70 0 0 0 0.0 0.0 0.0 0.0Subtotal (1000) Administrative Support 14,546 12,635 15,648 3,013 34.4 30.0 54.0 24.0(100F) <strong>Agency</strong> <strong>Financial</strong> Operations(110F) <strong>Agency</strong> Fiscal <strong>Office</strong>r Operations 372 359 371 12 3.9 4.0 4.0 0.0(120F) Accounting Operations 169 200 192 -8 3.0 3.0 3.0 0.0(130F) <strong>Agency</strong> <strong>Financial</strong> Operations 611 644 659 16 4.9 5.0 5.0 0.0Subtotal (100F) <strong>Agency</strong> <strong>Financial</strong> Operations 1,152 1,203 1,222 19 11.8 12.0 12.0 0.0(2000) Fire Prevention and Education(2100) Inspections 2,809 3,156 3,129 -27 34.4 34.0 34.0 0.0(2200) Investigations 2,131 2,046 2,058 13 28.5 23.0 23.0 0.0(2300) Public Outreach 262 265 598 333 3.0 3.0 3.0 0.0(2400) Technical Inspections 782 934 848 -86 9.8 9.0 9.0 0.0Subtotal (2000) Fire Prevention and Education 5,985 6,401 6,633 232 75.7 69.0 69.0 0.0(3000) Field Operations(3200) Fire/Rescue Operations 139,413 139,730 143,305 3,574 1,728.6 1,695.0 1,734.0 39.0(3300) Special Operations 12,825 12,607 12,836 229 125.8 125.0 126.0 1.0(3400) Emergency Medical Services Operations 1,835 1,727 1,799 72 0.0 0.0 0.0 0.0(3500) Homeland Security 119 1 1 0 1.0 0.0 0.0 0.0No Activity Assigned 5 0 0 0 0.0 0.0 0.0 0.0Subtotal (3000) Field Operations 154,197 154,066 157,941 3,875 1,855.4 1,820.0 1,860.0 40.0(4000) Employee Preparedness(4100) Employee Wellness 4,078 3,993 3,922 -71 2.0 2.0 1.0 -1.0(4200) Specialized Training 5,732 8,474 4,584 -3,890 119.9 127.0 58.0 -69.0Subtotal (4000) Employee Preparedness 9,810 12,467 8,506 -3,962 121.9 129.0 59.0 -70.0(Continued on next page)Fire and Emergency Medical Services DepartmentC-24FY 2013 Proposed <strong>Budget</strong> and <strong>Financial</strong> Plan
Table FB0-4 (continued)(dollars in thousands)Dollars in ThousandsFull-Time EquivalentsChangeChangeActual Approved Proposed from Actual Approved Proposed fromProgram/Activity FY 2011 FY 2012 FY 2013 FY 2012 FY 2011 FY 2012 FY 2013 FY 2012(5000) Operations Support(5100) Field Infrastructure 4,519 4,284 4,363 78 40.3 40.0 40.0 0.0(5200) Inventory Management 2,498 2,529 2,335 -194 10.8 11.0 9.0 -2.0Subtotal (5000) Operations Support 7,017 6,813 6,697 -116 51.1 51.0 49.0 -2.0(6000) Policy and Planning(6010) <strong>Office</strong> <strong>of</strong> Standards 764 761 503 -257 5.9 6.0 5.0 -1.0(6020) <strong>Office</strong> <strong>of</strong> Compliance 163 240 236 -4 3.0 3.0 3.0 0.0(6030) <strong>Office</strong> <strong>of</strong> Equity and Diversity 126 131 124 -7 1.0 1.0 1.0 0.0(6040) Emergency Communications 747 706 1,665 959 8.8 7.0 16.0 9.0Subtotal (6000) Policy and Planning 1,800 1,837 2,529 692 18.7 17.0 25.0 8.0(7000) State Safety Oversight(7010) Rail Safety 0 0 197 197 0.0 0.0 2.0 2.0Subtotal (7000) State Safety Oversight 0 0 197 197 0.0 0.0 2.0 2.0Total Proposed Operating <strong>Budget</strong> 194,507 195,422 199,374 3,951 2,168.9 2,128.0 2,130.0 2.0(Change is calculated by whole numbers and numbers may not add up due to rounding)Note: For more detailed information regarding <strong>the</strong> proposed funding for <strong>the</strong> activities within this agency’s programs, please see Schedule 30-PBBProgram Summary by Activity in <strong>the</strong> FY 2013 Operating Appendices located on <strong>the</strong> <strong>Office</strong> <strong>of</strong> <strong>the</strong> <strong>Chief</strong> <strong>Financial</strong> <strong>Office</strong>r’s website.FY 2013 Proposed <strong>Budget</strong> and <strong>Financial</strong> PlanFire and Emergency Medical Services DepartmentC-25
FY 2013 Proposed <strong>Budget</strong> ChangesThe District <strong>of</strong> Columbia Fire and Emergency Medical Services Department’s (DCFEMS) proposed FY 2013gross budget is $199,373,728, which represents a 2.0 percent increase over <strong>the</strong> FY 2012 approved gross budget <strong>of</strong>$195,422,438. The budget is comprised <strong>of</strong> $197,853,728 in Local funds and $1,520,000 in Special PurposeRevenue funds.Current Services Funding LevelThe Current Services Funding Level (CSFL) is a Local funds ONLY representation <strong>of</strong> <strong>the</strong> true cost <strong>of</strong> operatingDistrict agencies, before consideration <strong>of</strong> policy decisions. The CSFL reflects changes from <strong>the</strong> FY 2012 approvedbudget across multiple programs, and it estimates how much it would cost an agency to continue its currentprograms and operations into <strong>the</strong> following fiscal year. The initial adjustments in <strong>the</strong> budget proposal representchanges that should be compared to <strong>the</strong> FY 2013 CSFL budget and not necessarily changes made over <strong>the</strong> FY 2012Local funds budget. The FY 2013 CSFL adjustments to <strong>the</strong> FY 2012 Local funds budget are described in table 5<strong>of</strong> this agency's budget chapter. Please see <strong>the</strong> CSFL Development section within Volume 1: Executive Summaryfor more information regarding <strong>the</strong> methodology used and components that comprise <strong>the</strong> CSFL.FEMS’s FY 2013 CSFL budget is $198,091,998 which represents a $4,189,561, or 2.2 percent, increase over<strong>the</strong> FY 2012 approved Local funds budget <strong>of</strong> $193,902,437.Initial Adjusted <strong>Budget</strong>Cost Increase: $87,123 <strong>of</strong> Local funds in O<strong>the</strong>r Services and Charges to support <strong>the</strong> Auto MaintenanceAgreement.Cost Decrease: $87,123 <strong>of</strong> Local funds from personal services to <strong>of</strong>fset <strong>the</strong> increase to O<strong>the</strong>r Services and Charges.Additionally Adjusted <strong>Budget</strong>Technical Adjustments: Adjustment <strong>of</strong> Fringe Benefits to restore <strong>the</strong> District Government contribution foremployee health insurance from 72 percent, implemented in <strong>the</strong> FY 2011 budget, to 75 percent in FY 2013,resulting in an increase <strong>of</strong> $521,941 in Local funds.Policy InitiativesCost Increase: In Local funds, <strong>the</strong> budget was increased by $500,000 for Overtime. In addition, $131,064 isprovided to fund one Battalion <strong>Chief</strong> position and one Captain position, $26,725 for associated Fringe Benefits,and $37,750 for nonpersonal services to fund Travel and Training for <strong>the</strong> Rail Safety Activity.Cost Decrease: There is a reduction <strong>of</strong> $1,455,000 in Local funds personal services due to vacancy savings.Fire and Emergency Medical Services DepartmentC-26FY 2013 Proposed <strong>Budget</strong> and <strong>Financial</strong> Plan
FY 2012 Approved <strong>Budget</strong> to FY 2013 Proposed <strong>Budget</strong>, by Revenue TypeTable FB0-5 itemizes <strong>the</strong> changes by revenue type between <strong>the</strong> FY 2012 approved budget and <strong>the</strong> FY 2013 proposedbudget.Table FB0-5(dollars in thousands)PROGRAM BUDGET FTELOCAL FUNDS: FY 2012 Approved <strong>Budget</strong> and FTE 193,902 2,128.0Fringe Benefit Rate Adjustment Multiple Programs 1,553 0.0Recurring <strong>Budget</strong> Items Multiple Programs 1,667 0.0Consumer Price Index Multiple Programs 240 0.0Personal Services Growth Factor Multiple Programs 728 0.0FY 2013 Current Services Funding Level <strong>Budget</strong> (CSFL) 198,092 2,128.0Cost Increase: Auto Maintenance Agreement Multiple Programs 87 0.0Cost Decrease: Personal services to <strong>of</strong>fset increase Multiple Programs -87 0.0in O<strong>the</strong>r Services and ChargesFY 2013 Initial Adjusted <strong>Budget</strong> 198,092 2,128.0Technical Adjustment: Health insurance contribution Multiple Programs 522 0.0FY 2013 Additionally Adjusted <strong>Budget</strong> 198,614 2,128.0FY 2013 Policy InitiativesCost Increase: In Overtime budget Administrative Support 500 0.0Cost Increase: Additional positions for <strong>the</strong> Rail Safety Activity State Safety Oversight Program 131 2.0Cost Increase: Funding for Travel and Training for <strong>the</strong> Rail Safety Activity State Safety Oversight Program 38 0.0Cost Increase: For Fringe Benefits State Safety Oversight Program 27 0.0Cost Decrease: Vacancy savings Administrative Support -1,455 0.0LOCAL FUNDS: FY 2013 Proposed <strong>Budget</strong> and FTE 197,854 2,130.0SPECIAL PURPOSE REVENUE FUNDS: FY 2012 Approved <strong>Budget</strong> and FTE 1,520 0.0No Changes 0 0.0FY 2013 Initial Adjusted <strong>Budget</strong> 1,520 0.0SPECIAL PURPOSE REVENUE FUNDS: FY 2013 Proposed <strong>Budget</strong> and FTE 1,520 0.0Gross for FB0 - Fire and Emergency Medical Services Department 199,374 2,130.0(Change is calculated by whole numbers and numbers may not add up due to rounding)FY 2013 Proposed <strong>Budget</strong> and <strong>Financial</strong> PlanFire and Emergency Medical Services DepartmentC-27
<strong>Agency</strong> Performance PlanThe agency’s performance plan has <strong>the</strong> following objectives for FY 2013:1. Operations BureauObjective 1: Help sick and injured patients by providing pre-hospital emergency medical care andambulance transport.Objective 2: Safeguard lives and property by controlling and extinguishing fires.Objective 3: Safeguard lives and property by preparing for and managing natural disasters or o<strong>the</strong>r catastrophicevents.Operations BureauFY 2010 FY 2011 FY 2011 FY 2012 FY 2013 FY 2014Measure Actual Target Actual Projection Projection ProjectionPercentage <strong>of</strong> structure fire calls with first fire truckarriving within 6 minutes, 30 seconds dispatch to scene. 1 98.9% 90% 99.7% 90% 90% 90%Average response time <strong>of</strong> first arriving fire truck tostructure fire calls. 1m 55s < 4m 1m 52s < 4m < 4m < 4mPercentage <strong>of</strong> critical medical calls with first EMTarriving within 6 minutes 30 seconds dispatch to scene. 86.4% 90% 85.1% 90% 90% 90%Average response time <strong>of</strong> first arriving EMT to criticalmedical calls. 4m 33s < 5m 4m 42s < 5m < 5m < 5mPercentage <strong>of</strong> critical medical calls with first paramedicarriving within 8 minutes, dispatch to scene. 85.6% 90% 82.1% 90% 90% 90%Average response time <strong>of</strong> first arriving paramedic tocritical medical calls. 5m 35s < 6m 5m 53s < 6m < 6m < 6mPercentage <strong>of</strong> critical medical calls with first transportunit arriving within 12 minutes, dispatch to scene. 2 90.0% 90% 90.3% 90% 90% 90%Average response time <strong>of</strong> first arriving ambulance tocritical medical calls. 7m 5s < 9m 7m 9s < 9m < 9m < 9mPercentage <strong>of</strong> hospital drop times <strong>of</strong> 30 minutes or less. 35.8% 50% 34.5% 50% 50% 50%Average hospital drop time. 37m 13s < 30m 36m 59s < 30m < 30m < 30mEMT: Emergency Medical TechnicianFire and Emergency Medical Services DepartmentC-28FY 2013 Proposed <strong>Budget</strong> and <strong>Financial</strong> Plan
2. Emergency Medical Sercives BureauObjective 1: Help sick and injured patients by providing pre-hospital and out-<strong>of</strong>-hospital healthcare services.Objective 2: Continuously improve <strong>the</strong> quality <strong>of</strong> out-<strong>of</strong>-hospital medical care provided by department personnel.Emergency Medical Services (EMS) BureauFY 2010 FY 2011 FY 2011 FY 2012 FY 2013 FY 2014Measure Actual Target Actual Projection Projection ProjectionPercentage <strong>of</strong> patients in full cardiac arrest who havespecified rhythms upon delivery to a medical facility. 2,3 21.5% 25% 22.6% 25% 25% 25%Percentage decrease in 911 usage by Street Calls patientsin a cohort. 4 72.6% 50% 66% 50% 50% 50%Percentage <strong>of</strong> patients surveyed indicating <strong>the</strong>y were“satisfied” or “very satisfied” with Fire and EMS servicesduring an EMS call. 2 96.2% 90% 97.3% 90% 90% 90%EMT-P: Emergency Medical Technician- ParamedicEMS: Emergency Medical ServicesFY 2013 Proposed <strong>Budget</strong> and <strong>Financial</strong> PlanFire and Emergency Medical Services DepartmentC-29
3. Services BureauObjective 1: Train and develop <strong>the</strong> department’s workforce.Objective 2: Administer human resources for <strong>the</strong> department’s workforce.Objective 3: Monitor and improve employee safety and wellness.Objective 4: Manage buildings and o<strong>the</strong>r properties owned by <strong>the</strong> department.Objective 5: Manage emergency apparatus and o<strong>the</strong>r vehicles owned by <strong>the</strong> department.Objective 6: Support decision making, communication and resource management by using information technology.Services BureauFY 2010 FY 2011 FY 2011 FY 2012 FY 2013 FY 2014Measure Actual Target Actual Projection Projection ProjectionNumber <strong>of</strong> fire stations completing planned majorrepairs or complete renovation. 1 1 1 1 2 2Percentage <strong>of</strong> heavy duty emergency vehicle fleet(fire trucks and o<strong>the</strong>r vehicles) available fordaily operation. 87.6% 85% 70.8% 85% 85% 85%Percentage <strong>of</strong> medium duty emergency vehicle fleet(ambulances and o<strong>the</strong>r vehicles) available fordaily operation. 85.3% 85% 51.8% 85% 85% 85%Percentage <strong>of</strong> light duty emergency vehicle fleet(command and support vehicles) available fordaily operation. 94.1% 85% 84.5% 90% 90% 90%Number <strong>of</strong> department vehicles involved in accidentsduring emergency responses. 93 < 100 66 < 100 < 100 < 100Number <strong>of</strong> department personnel injured duringemergency operations. 227 < 175 275 < 175 < 175 < 175Fire and Emergency Medical Services DepartmentC-30FY 2013 Proposed <strong>Budget</strong> and <strong>Financial</strong> Plan
4. Fire Prevention and Investigations DivisionObjective 1: Reduce threats to lives and property by preventing fires before <strong>the</strong>y happen.Objective 2: Investigate to determine <strong>the</strong> cause and origin <strong>of</strong> fires.Fire Prevention and Investigations DivisionFY 2010 FY 2011 FY 2011 FY 2012 FY 2013 FY 2014Measure Actual Target Actual Projection Projection ProjectionNumber <strong>of</strong> residential structure fires per 1,000residential structures. 2 New New 2.37 < 4 < 4 < 4Number <strong>of</strong> residential structure fires per 1,000population. 2 New New .63 < 1 < 1 < 1Percentage <strong>of</strong> residential structure fires contained to <strong>the</strong>object or room <strong>of</strong> origin. 2 New New 85.5% > 80% > 80% > 80%Percentage <strong>of</strong> residential structure fires contained to <strong>the</strong>floor or structure <strong>of</strong> origin. 2 New New 6.7% < 10% < 10% < 10%Total combined commercial and industrial structure fireincidents per 1,000 commercial and industrial structures. 2 New New 8.1 < 15 < 15 < 15Total arson fires per 10,000 population. 2 New New .38 < 2 < 2 < 2End-<strong>of</strong>-fiscal year percent arson cases closed by arrest. 2 38.1% 25% 52.2% > 25% > 25% > 25%End-<strong>of</strong>-fiscal year percent change in number <strong>of</strong>structural fires. -9% -5% 5% -5% -5% -5%End-<strong>of</strong>-fiscal year number <strong>of</strong> civilian fire fatalities. 5 6 ≤ 5 10 ≤ 5 ≤ 5 ≤ 5End-<strong>of</strong>-fiscal year number <strong>of</strong> civilian fire injuries. 50 ≤ 50 81 ≤ 50 ≤ 50 ≤ 50FY 2013 Proposed <strong>Budget</strong> and <strong>Financial</strong> PlanFire and Emergency Medical Services DepartmentC-31
5. <strong>Office</strong> <strong>of</strong> CommunicationsObjective 1: Communicate information to <strong>the</strong> public and media.Objective 2: Reduce threats to lives and property through public education programs.Objective 3: Reduce threats to lives and properties through public intervention programs.<strong>Office</strong> <strong>of</strong> CommunicationsFY 2010 FY 2011 FY 2011 FY 2012 FY 2013 FY 2014Measure Actual Target Actual Projection Projection ProjectionNumber <strong>of</strong> neighborhood level fire safety presentationscompleted. 743 500 627 500 500 500Number <strong>of</strong> at school fire safety presentations completed. 60 48 57 50 50 50Number <strong>of</strong> neighborhood level health screeningscompleted. 12 12 100 > 50 > 50 > 50Number <strong>of</strong> smoke alarm installations. 1,250 > 500 1,319 > 1,000 > 1,000 > 1,000Number <strong>of</strong> car seat installations. 2,353 > 1,500 1,500 1,500 1,500 1,500Number <strong>of</strong> CPR program participants. 2,188 > 2,000 1,606 > 2,000 > 2,000 > 2,000Number <strong>of</strong> District-wide AED registrations. 815 > 1,000 1,361 > 1,300 > 1,600 > 1,9006. <strong>Office</strong> <strong>of</strong> <strong>the</strong> Fire and Emergency Medical Services <strong>Chief</strong>Objective 1: Work closely with <strong>the</strong> Executive <strong>Office</strong> <strong>of</strong> <strong>the</strong> Mayor, Deputy Mayor <strong>of</strong> Public Safety, and CityAdministrator to meet <strong>the</strong> needs <strong>of</strong> District residents while efficiently administrating Department services.Objective 2: Continue to improve labor/management partnerships.Objective 3: Use strategic level planning tools to improve services and better prepare for <strong>the</strong> future.<strong>Office</strong> <strong>of</strong> <strong>the</strong> Fire and Emergency Services <strong>Chief</strong>FY 2010 FY 2011 FY 2011 FY 2012 FY 2013 FY 2014Measure Actual Target Actual Projection Projection ProjectionAverage time in days to close Mayoral customerservice work flows. 8 7 4 7 7 7Number <strong>of</strong> community group meetings scheduled andattended by executive managers. 16 12 240 > 100 > 100 > 100Number <strong>of</strong> labor/management planning activitymeetings scheduled and attended by executive managers. 12 12 24 12 12 12Fire and Emergency Medical Services DepartmentC-32FY 2013 Proposed <strong>Budget</strong> and <strong>Financial</strong> Plan
Performance Plan Endnotes:1 National Fire Protection Association (NFPA) measure.2 International City/County Management Association (ICMA) comparative measure (October, 2008) for municipalities withpopulations <strong>of</strong> 100,000 or more.3 “Specified rhythms” means patients with cardiac etiologies who have return <strong>of</strong> spontaneous circulation (ROSC, i.e., a pulse) inout-<strong>of</strong> hospital settings and maintain heartbeat until transferred to hospital care (Utstein template measure). FY 2010 data is notvalidated by <strong>the</strong> template measure and still requires review.4 A “cohort” is a sample group <strong>of</strong> patients tracked over <strong>the</strong> period <strong>of</strong> one year by <strong>the</strong> Street Calls Program.5 United States Fire Administration (USFA) measure.FY 2013 Proposed <strong>Budget</strong> and <strong>Financial</strong> PlanFire and Emergency Medical Services DepartmentC-33
Police <strong>Office</strong>rs’ andFire Fighters’ Retirement System(FD0)www.dcrb.dc.govTelephone: 202-343-3200% ChangeFY 2011 FY 2012 FY 2013 fromDescription Actual Approved Proposed FY 2012Operating <strong>Budget</strong> $127,200,000 $116,700,000 $96,314,000 -17.5The mission <strong>of</strong> <strong>the</strong> Police <strong>Office</strong>rs’ and Fire Fighters’ RetirementSystem is to provide <strong>the</strong> District’s required contribution as <strong>the</strong> employerto <strong>the</strong>se two pension funds, which are administered by <strong>the</strong> District<strong>of</strong> Columbia Retirement Board (DCRB).Under provisions <strong>of</strong> <strong>the</strong> Police <strong>Office</strong>rs, Fire Fighters, and Teachers Retirement Benefit Replacement Plan Act <strong>of</strong>1998 (“<strong>the</strong> Act”), <strong>the</strong> federal government assumed <strong>the</strong> District’s unfunded pension liability for <strong>the</strong> retirement plansfor teachers, police <strong>of</strong>ficers, fire fighters and judges. Pursuant to <strong>the</strong> Act, <strong>the</strong> federal government will pay <strong>the</strong> retirementand death benefits, and a defined share <strong>of</strong> disability benefits, for employees for service accrued prior to July1, 1997. The costs for benefits earned after June 30, 1997 are <strong>the</strong> responsibility <strong>of</strong> <strong>the</strong> Government <strong>of</strong> <strong>the</strong> District<strong>of</strong> Columbia. This budget reflects <strong>the</strong> required annual District contribution to fund <strong>the</strong>se earned benefits. Pursuantto District Code section 1-907.02(a) (2006 Repl.), <strong>the</strong> District is required to budget <strong>the</strong> pension contribution atan amount equal to, or greater than, <strong>the</strong> amount certified by <strong>the</strong> DCRB on <strong>the</strong> basis <strong>of</strong> a prescribed actuarial studyand formula calculation that is set forth in section 1-907.03. On December 29, 2011, DCRB transmitted <strong>the</strong> certifiedcontribution for inclusion in <strong>the</strong> District’s FY 2013 proposed budget, as reflected in this chapter.The agency’s FY 2013 proposed budget is presented in <strong>the</strong> following tables:FY 2013 Proposed <strong>Budget</strong> and <strong>Financial</strong> PlanPolice <strong>Office</strong>rs’ and Fire Fighters’ Retirement SystemC-35
FY 2013 Proposed Gross Funds Operating <strong>Budget</strong>, by Revenue TypeTable FD0-1 contains <strong>the</strong> proposed FY 2013 agency budget compared to <strong>the</strong> FY 2012 approved budget. It alsoprovides FY 2010 and FY 2011 actual expenditures.Table FD0-1(dollars in thousands)ChangeActual Actual Approved Proposed from PercentAppropriated Fund FY 2010 FY 2011 FY 2012 FY 2013 FY 2012 Change*General FundLocal Funds 132,300 127,200 116,700 96,314 -20,386 -17.5Total for General Fund 132,300 127,200 116,700 96,314 -20,386 -17.5Gross Funds 132,300 127,200 116,700 96,314 -20,386 -17.5*Percent change is based on whole dollars.Note: If applicable, for a breakdown <strong>of</strong> each Grant (Federal and Private), Special Purpose Revenue type and Intra-District agreement, pleaserefer to Schedule 80 <strong>Agency</strong> Summary by Revenue Source in <strong>the</strong> FY 2013 Operating Appendices located on <strong>the</strong> <strong>Office</strong> <strong>of</strong> <strong>the</strong> <strong>Chief</strong><strong>Financial</strong> <strong>Office</strong>r’s website.FY 2013 Proposed Operating <strong>Budget</strong>, by Comptroller Source GroupTable FD0-2 contains <strong>the</strong> proposed FY 2013 budget at <strong>the</strong> Comptroller Source Group (object class) level comparedto <strong>the</strong> FY 2012 approved budget. It also provides FY 2010 and FY 2011 actual expenditures.Table FD0-2(dollars in thousands)ChangeActual Actual Approved Proposed from PercentComptroller Source Group FY 2010 FY 2011 FY 2012 FY 2013 FY 2012 Change*50 - Subsidies and Transfers 132,300 127,200 116,700 96,314 -20,386 -17.5Subtotal Nonpersonal Services (NPS) 132,300 127,200 116,700 96,314 -20,386 -17.5Gross Funds 132,300 127,200 116,700 96,314 -20,386 -17.5*Percent change is based on whole dollars.Program DescriptionThe Police <strong>Office</strong>rs’ and Fire fighters’ Retirement System operates through <strong>the</strong> following program:Police/Fire Fighters’ Retirement System - D.C. Code section 1-907.02(a) requires <strong>the</strong> District to appropriate fundsthat are equal to, or greater than, <strong>the</strong> actuarially determined amount certified by <strong>the</strong> DCRB on <strong>the</strong> basis <strong>of</strong> a prescribedactuarial study and formula calculation that is set forth in section 1-907.03.Program Structure ChangeThe Police <strong>Office</strong>rs’ and Fire Fighters’ Retirement System has no program structure changes in <strong>the</strong> FY 2013proposed budget.Police <strong>Office</strong>rs’ and Fire Fighters’ Retirement SystemC-36FY 2013 Proposed <strong>Budget</strong> and <strong>Financial</strong> Plan
FY 2013 Proposed Operating <strong>Budget</strong> and FTEs, by Program and ActivityTable FD0-3 contains <strong>the</strong> proposed FY 2013 budget by program and activity compared to <strong>the</strong> FY 2012 approved budget.It also provides FY 2011 actual data.Table FD0-3(dollars in thousands)Dollars in ThousandsFull-Time EquivalentsChangeChangeActual Approved Proposed from Actual Approved Proposed fromProgram/Activity FY 2011 FY 2012 FY 2013 FY 2012 FY 2011 FY 2012 FY 2013 FY 2012(1000) Police / Fire Fighters' Retirement System(1100) Police / Fire Fighters' Retirement System 127,200 116,700 96,314 -20,386 0.0 0.0 0.0 0.0Subtotal (1000) Police / Fire Fighters' Retirement System 127,200 116,700 96,314 -20,386 0.0 0.0 0.0 0.0Total Proposed Operating <strong>Budget</strong> 127,200 116,700 96,314 -20,386 0.0 0.0 0.0 0.0(Change is calculated by whole numbers and numbers may not add up due to rounding)Note: For more detailed information regarding <strong>the</strong> proposed funding for <strong>the</strong> activities within this agency’s programs, please see Schedule 30-PBBProgram Summary by Activity in <strong>the</strong> FY 2013 Operating Appendices located on <strong>the</strong> <strong>Office</strong> <strong>of</strong> <strong>the</strong> <strong>Chief</strong> <strong>Financial</strong> <strong>Office</strong>r’s website.FY 2013 Proposed <strong>Budget</strong> ChangesThe Police <strong>Office</strong>rs’ and Fire Fighters’ Retirement System’s proposed FY 2013 gross budget is $96,314,000, whichrepresents a 17.5 percent decrease from its FY 2012 approved gross budget <strong>of</strong> $116,700,000. The budget is comprisedentirely <strong>of</strong> Local funds.Current Services Funding LevelThe Current Services Funding Level (CSFL) is a Local funds ONLY representation <strong>of</strong> <strong>the</strong> true cost <strong>of</strong> operatingDistrict agencies, before consideration <strong>of</strong> policy decisions. The CSFL reflects changes from <strong>the</strong> FY 2012 approvedbudget across multiple programs, and it estimates how much it would cost an agency to continue its current programsand operations into <strong>the</strong> following fiscal year. The initial adjustments on <strong>the</strong> budget proposal representchanges that should be compared to <strong>the</strong> FY 2013 CSFL budget and not necessarily changes made to <strong>the</strong> FY 2012Local funds budget. The FY 2013 CSFL adjustments to <strong>the</strong> FY 2012 Local funds budget are described in table 4<strong>of</strong> this agency's budget chapter. Please see <strong>the</strong> CSFL Development section within Volume 1: Executive Summaryfor more information regarding <strong>the</strong> methodology used and components that comprise <strong>the</strong> CSFL.The Police <strong>Office</strong>rs’ and Fire Fighters’ Retirement System’s FY 2013 CSFL budget is $116,700,000, which representsno change from its FY 2012 approved gross budget <strong>of</strong> $116,700,000.Initial Adjusted <strong>Budget</strong>Cost Decrease: The pension contribution decreased by $20,386,000, or 17.5 percent, from <strong>the</strong> FY 2012 approvedbudget <strong>of</strong> $116,700,000 in Local funds. The reduction is made on <strong>the</strong> basis <strong>of</strong> <strong>the</strong> actuarial report certified by <strong>the</strong>District <strong>of</strong> Columbia Retirement Board and transmitted to <strong>the</strong> Mayor in a letter dated December 29, 2011.FY 2013 Proposed <strong>Budget</strong> and <strong>Financial</strong> PlanPolice <strong>Office</strong>rs’ and Fire Fighters’ Retirement SystemC-37
FY 2012 Approved <strong>Budget</strong> to FY 2013 Proposed <strong>Budget</strong>, by Revenue TypeTable FD0-4 itemizes <strong>the</strong> changes by revenue type between <strong>the</strong> FY 2012 approved budget and <strong>the</strong> FY 2013 proposedbudget.Table FD0-4(dollars in thousands)PROGRAM BUDGET FTELOCAL FUNDS: FY 2012 Approved <strong>Budget</strong> and FTE 116,700 0.0No Changes 0 0.0FY 2013 Current Services Funding Level <strong>Budget</strong> (CSFL): 116,700 0.0Cost Decrease: D.C. Retirement Board Actuarial Valuation Police / Firefighters' -20,386 0.0Retirement SystemFY 2013 Initial Adjusted <strong>Budget</strong> 96,314 0.0LOCAL FUNDS: FY 2013 Proposed <strong>Budget</strong> and FTE 96,314 0.0Gross for FD0 - Police <strong>Office</strong>rs' and Fire Fighters' Retirement System 96,314 0.0(Change is calculated by whole numbers and numbers may not add up due to rounding)Police <strong>Office</strong>rs’ and Fire Fighters’ Retirement SystemC-38FY 2013 Proposed <strong>Budget</strong> and <strong>Financial</strong> Plan
Department <strong>of</strong> Corrections(FL0)www.doc.dc.govTelephone: 202-673-7316% ChangeFY 2011 FY 2012 FY 2013 fromDescription Actual Approved Proposed FY 2012Operating <strong>Budget</strong> $142,973,992 $136,287,501 $139,604,240 2.4FTEs 879.5 894.0 894.0 0.0The mission <strong>of</strong> <strong>the</strong> Department <strong>of</strong> Corrections (DOC) is to providea safe, secure, orderly, and humane environment for <strong>the</strong> confinement<strong>of</strong> pretrial detainees and sentenced inmates, while affording those incustody meaningful rehabilitative opportunities that will assist <strong>the</strong>m toconstructively re-integrate into <strong>the</strong> community.Summary <strong>of</strong> ServicesThe DOC operates <strong>the</strong> Central Detention Facility (CDF) and houses inmates in <strong>the</strong> Correctional TreatmentFacility (CTF) through a contract with <strong>the</strong> Corrections Corporation <strong>of</strong> America; both facilities are accredited by<strong>the</strong> American Correctional Association (ACA). The department has contracts with four private and independentlyoperated halfway houses: Efforts for Ex-Convicts; Extended House, Inc.; Fairview; and Hope Village; <strong>the</strong>se are<strong>of</strong>ten used as alternatives to incarceration. Like o<strong>the</strong>r municipal jails, 75 to 85 percent <strong>of</strong> inmates in DOC’s custodyhave one or more outstanding legal matters that require detention, and median lengths <strong>of</strong> stay for releasedinmates are 31 days or less. Ninety percent <strong>of</strong> DOC’s inmates are male. DOC also houses female inmates and asmall number <strong>of</strong> juveniles charged as adults at <strong>the</strong> CTF. Each facility <strong>of</strong>fers inmates a number <strong>of</strong> programs and servicesthat support successful community re-entry. These include:■ Residential Substance Abuse Treatment (RSAT);■ Re-entry preparation (Re-Entry);■ Institutional Work Details and Community Work Squads; and■ Special education (through <strong>the</strong> District <strong>of</strong> Columbia Public Schools (DCPS)), adult education, and GEDpreparation provided by DOC.ACA and National Commission on Correctional Health Care (NCCHC) accredited comprehensive healthand mental health services are provided through Unity Health Care (contractual) and <strong>the</strong> Department <strong>of</strong> MentalHealth. In addition, facilities provide inmate personal adjustment and support services, such as food services, laundry,visitation, law library, and an inmate grievance process. DOC facilities operate 24 hours a day, 365 days a year.The agency’s FY 2013 proposed budget is presented in <strong>the</strong> following tables:FY 2013 Proposed <strong>Budget</strong> and <strong>Financial</strong> PlanDepartment <strong>of</strong> CorrectionsC-39
FY 2013 Proposed Gross Funds Operating <strong>Budget</strong>, by Revenue TypeTable FL0-1 contains <strong>the</strong> proposed FY 2013 agency budget compared to <strong>the</strong> FY 2012 approved budget. It alsoprovides FY 2010 and FY 2011 actual expenditures.Table FL0-1(dollars in thousands)ChangeActual Actual Approved Proposed from PercentAppropriated Fund FY 2010 FY 2011 FY 2012 FY 2013 FY 2012 Change*General FundLocal Funds 124,778 117,369 115,294 117,148 1,854 1.6Special Purpose Revenue Funds 25,801 24,953 20,297 22,141 1,844 9.1Total for General Fund 150,579 142,323 135,591 139,289 3,698 2.7Federal ResourcesFederal Grant Funds 187 412 359 0 -359 -100.0Total for Federal Resources 187 412 359 0 -359 -100.0Intra-District FundsIntra-District Funds 1,008 239 337 315 -22 -6.5Total for Intra-District Funds 1,008 239 337 315 -22 -6.5Gross Funds 151,775 142,974 136,288 139,604 3,317 2.4*Percent change is based on whole dollars.Note: If applicable, for a breakdown <strong>of</strong> each Grant (Federal and Private), Special Purpose Revenue type and Intra-District agreement,please refer to Schedule 80 <strong>Agency</strong> Summary by Revenue Source in <strong>the</strong> FY 2013 Operating Appendices located on <strong>the</strong> <strong>Office</strong> <strong>of</strong> <strong>the</strong><strong>Chief</strong> <strong>Financial</strong> <strong>Office</strong>r’s website.FY 2013 Proposed Full-Time Equivalents, by Revenue TypeTable FL0-2 contains <strong>the</strong> proposed FY 2013 FTE level compared to <strong>the</strong> FY 2012 approved FTE level by revenuetype. It also provides FY 2010 and FY 2011 actual data.Table FL0-2ChangeActual Actual Approved Proposed from PercentAppropriated Fund FY 2010 FY 2011 FY 2012 FY 2013 FY 2012 ChangeGeneral FundLocal Funds 851.2 861.6 867.6 872.8 5.2 0.6Special Purpose Revenue Funds -13.9 12.0 20.0 20.0 0.0 0.0Total for General Fund 837.4 873.6 887.6 892.8 5.2 0.6Federal ResourcesFederal Grant Funds 0.0 4.3 5.0 0.0 -5.0 -100.0Total for Federal Resources 0.0 4.3 5.0 0.0 -5.0 -100.0Intra-District FundsIntra-District Funds 0.0 1.7 1.4 1.2 -0.2 -11.1Total for Intra-District Funds 0.0 1.7 1.4 1.2 -0.2 -11.1Total Proposed FTEs 837.4 879.5 894.0 894.0 0.0 0.0Department <strong>of</strong> CorrectionsC-40FY 2013 Proposed <strong>Budget</strong> and <strong>Financial</strong> Plan
FY 2013 Proposed Operating <strong>Budget</strong>, by Comptroller Source GroupTable FL0-3 contains <strong>the</strong> proposed FY 2013 budget at <strong>the</strong> Comptroller Source Group (object class) level comparedto <strong>the</strong> FY 2012 approved budget. It also provides FY 2010 and FY 2011 actual expenditures.Table FL0-3(dollars in thousands)ChangeActual Actual Approved Proposed from PercentComptroller Source Group FY 2010 FY 2011 FY 2012 FY 2013 FY 2012 Change*11 - Regular Pay - Continuing Full Time 39,552 42,464 41,305 47,905 6,600 16.012 - Regular Pay - O<strong>the</strong>r 7,090 6,822 7,950 1,506 -6,444 -81.113 - Additional Gross Pay 4,294 4,212 3,719 4,000 281 7.514 - Fringe Benefits - Current Personnel 11,463 11,934 13,496 15,163 1,667 12.415 - Overtime Pay 3,817 2,937 2,500 2,500 0 0.099 - Unknown Payroll Postings 66 0 0 0 0 N/ASubtotal Personal Services (PS) 66,282 68,369 68,970 71,073 2,103 3.020 - Supplies and Materials 2,485 5,405 6,506 7,250 744 11.430 - Energy, Comm. and Building Rentals 1,533 0 0 0 0 N/A31 - Telephone, Telegraph, Telegram, Etc. 303 0 0 0 0 N/A32 - Rentals - Land and Structures 2,770 2,770 2,904 2,926 22 0.833 - Janitorial Services 10 0 0 0 0 N/A34 - Security Services 10 0 0 0 0 N/A35 - Occupancy Fixed Costs 215 -12 0 0 0 N/A40 - O<strong>the</strong>r Services and Charges 2,180 1,527 2,717 3,571 854 31.441 - Contractual Services - O<strong>the</strong>r 65,005 55,864 54,589 53,434 -1,156 -2.150 - Subsidies and Transfers 77 20 39 0 -39 -100.070 - Equipment and Equipment Rental 257 436 562 1,350 787 139.991 - Expense Not <strong>Budget</strong>ed O<strong>the</strong>rs 10,648 8,596 0 0 0 N/ASubtotal Nonpersonal Services (NPS) 85,492 74,605 67,318 68,531 1,213 1.8Gross Funds 151,775 142,974 136,288 139,604 3,317 2.4*Percent change is based on whole dollars.FY 2013 Proposed <strong>Budget</strong> and <strong>Financial</strong> PlanDepartment <strong>of</strong> CorrectionsC-41
Division DescriptionThe Department <strong>of</strong> Corrections operates through <strong>the</strong> following 5 divisions:Inmate Services – provides <strong>the</strong> services necessary to ensure humane, hygienic, and constitutionally mandated care<strong>of</strong> inmates.This division contains <strong>the</strong> following 3 activities:■ Inmate Personal Services – provides for inmates’ personal needs and ensures that each service is provided in atimely, accurate, and economical manner;■ Inmate Adjustment and Development Support – provides inmates with opportunities for personal developmentand facilitates adjustment to institutional custody; and■ Inmate Health Services – provides constitutionally mandated levels <strong>of</strong> health care to inmates in DOC custody.Inmate Custody – detains pretrial defendants and sentenced misdemeanants safely, securely, and in accordancewith constitutional requirements.This division contains <strong>the</strong> following 3 activities:■ Internal Security and Control Services – provides effective management <strong>of</strong> <strong>the</strong> inmate population and ensuresa safe and secure DOC-administered institutional environment;■ External Security and Control Services – provides contractual housing and transportation <strong>of</strong> inmates in a safe,secure, and cost-effective manner; and supports timely apprehension <strong>of</strong> violators; and■ Community Corrections – facilitates community support and involvement for sentenced misdemeanants andpretrial inmates awaiting adjudication <strong>of</strong> charges.Institutional Support Services – provides direct support to <strong>the</strong> Inmate Custody and Inmate Services programs byproviding life-safety, environmental and facility support services and documentation on each inmate’s security riskand legal status.This division contains <strong>the</strong> following 2 activities:■ Inmate Status Documentation – provides direct support to <strong>the</strong> Inmate Custody and Inmate Services programsby providing life-safety, environmental and facility support services and documentation on each inmate’s securityrisk and legal status; and■ Facility Services – ensures that DOC facilities are kept in good, operable condition and that <strong>the</strong>y meet buildingand life-safety codes. This activity also includes capital planning and construction management services.<strong>Agency</strong> Management – provides for administrative support and <strong>the</strong> required tools to achieve operational and programmaticresults. This division is standard for all agencies using performance-based budgeting.<strong>Agency</strong> <strong>Financial</strong> Operations – provides comprehensive and efficient financial management services to, and onbehalf <strong>of</strong>, District agencies so that <strong>the</strong> financial integrity <strong>of</strong> <strong>the</strong> District <strong>of</strong> Columbia is maintained. This division isstandard for all agencies using performance-based budgeting.Division Structure ChangeThe Department <strong>of</strong> Corrections has no division structure changes in <strong>the</strong> FY 2013 proposed budget.Department <strong>of</strong> CorrectionsC-42FY 2013 Proposed <strong>Budget</strong> and <strong>Financial</strong> Plan
FY 2013 Proposed Operating <strong>Budget</strong> and FTEs, by Division and ActivityTable FL0-4 contains <strong>the</strong> proposed FY 2013 budget by division and activity compared to <strong>the</strong> FY 2012 approved budget.It also provides <strong>the</strong> FY 2011 actual data.Table FL0-4(dollars in thousands)Dollars in ThousandsFull-Time EquivalentsChangeChangeActual Approved Proposed from Actual Approved Proposed fromDivision/Activity FY 2011 FY 2012 FY 2013 FY 2012 FY 2011 FY 2012 FY 2013 FY 2012(100F) <strong>Agency</strong> <strong>Financial</strong> Operations(110F) <strong>Budget</strong> Operations 239 265 273 8 2.0 2.0 2.0 0.0(120F) Accounting Operations 463 461 472 11 6.0 6.0 6.0 0.0(130F) ACFO 166 186 190 4 1.0 1.0 1.0 0.0Subtotal (100F) <strong>Agency</strong> <strong>Financial</strong> Operations 868 913 935 22 8.9 9.0 9.0 0.0(1100) <strong>Agency</strong> Management Programs(1110) Executive Direction and Support 2,026 2,687 2,827 140 25.8 24.0 22.0 -2.0(1120) Human Resources Management 1,938 2,100 2,036 -63 17.8 18.0 16.0 -2.0(1130) Management Control 1,444 1,190 1,361 171 11.9 11.0 13.0 2.0(1140) Information Technology 2,091 2,918 3,012 94 13.9 12.0 12.0 0.0(1150) <strong>Agency</strong> Operations Support 2,387 2,378 2,394 15 8.9 11.0 9.0 -2.0Subtotal (1100) <strong>Agency</strong> Management Programs 9,887 11,273 11,630 356 78.3 76.0 72.0 -4.0(22IS) Inmate Services(2440) Inmate Personnel Services 910 0 0 0 0.0 0.0 0.0 0.0Subtotal (22IS) Inmate Services 910 0 0 0 0.0 0.0 0.0 0.0(2500) Inmate Services(2510) Inmate Personal Services 8,139 7,833 7,743 -89 24.8 25.0 25.0 0.0(2520) Inmate Adjustment/Developmental Support 2,073 2,329 2,779 450 24.8 25.0 29.0 4.0(2530) Inmate Health Services 39,985 33,603 33,160 -443 55.5 57.0 51.0 -6.0Subtotal (2500) Inmate Services 50,197 43,764 43,682 -83 105.0 107.0 105.0 -2.0(3600) Inmate Custody(3610) Internal Security and Control Services 41,889 41,062 44,147 3,085 542.8 550.0 547.0 -3.0(3620) External Security and Control Services 27,583 25,801 24,834 -967 24.6 31.0 37.0 6.0(3630) Community Corrections 3,264 3,542 3,277 -264 6.9 6.0 3.0 -3.0Subtotal (3600) Inmate Custody 72,737 70,404 72,258 1,854 574.3 587.0 587.0 0.0(4800) Institutional Support Services(4810) Inmate Status Documentation 5,556 6,186 6,142 -44 80.3 81.0 82.0 1.0(4820) Facility Services 2,820 3,747 4,958 1,211 32.7 34.0 39.0 5.0Subtotal (4800) Institutional Support Services 8,376 9,933 11,100 1,167 113.0 115.0 121.0 6.0Total Proposed Operating <strong>Budget</strong> 142,974 136,288 139,604 3,317 879.5 894.0 894.0 0.0(Change is calculated by whole numbers and numbers may not add up due to rounding)Note: For more detailed information regarding <strong>the</strong> proposed funding for <strong>the</strong> activities within this agency’s divisions, please see Schedule 30-PBBProgram Summary by Activity in <strong>the</strong> FY 2013 Operating Appendices located on <strong>the</strong> <strong>Office</strong> <strong>of</strong> <strong>the</strong> <strong>Chief</strong> <strong>Financial</strong> <strong>Office</strong>r’s website.FY 2013 Proposed <strong>Budget</strong> and <strong>Financial</strong> PlanDepartment <strong>of</strong> CorrectionsC-43
FY 2013 Proposed <strong>Budget</strong> ChangesThe Department <strong>of</strong> Corrections’ (DOC) proposed FY 2013 gross budget is $139,604,240, which represents a 2.4percent increase over <strong>the</strong> FY 2012 approved budget <strong>of</strong> $136,287,501. The budget is comprised <strong>of</strong> $117,148,138<strong>of</strong> Local funds, $22,140,851 <strong>of</strong> Special Purpose Revenue funds, and $315,251 <strong>of</strong> Intra-District funds.Current Services Funding LevelThe Current Services Funding Level (CSFL) is a Local funds ONLY representation <strong>of</strong> <strong>the</strong> true cost <strong>of</strong> operatingDistrict agencies, before consideration <strong>of</strong> policy decisions. The CSFL reflects changes from <strong>the</strong> FY 2012 approvedbudget across multiple programs, and it estimates how much it would cost an agency to continue its current programsand operations into <strong>the</strong> following fiscal year. The initial adjustments in <strong>the</strong> budget proposal representchanges that should be compared to <strong>the</strong> FY 2013 CSFL budget and not necessarily changes made to <strong>the</strong> FY 2012Local funds budget. The FY 2013 CSFL adjustments to <strong>the</strong> FY 2012 Local funds budget are described in table 5<strong>of</strong> this agency's budget chapter. Please see <strong>the</strong> CSFL Development section within Volume 1: Executive Summaryfor more information regarding <strong>the</strong> methodology used and components that comprise <strong>the</strong> CSFL.DOC’s FY 2013 CSFL budget is $117,727,032, which represents a $2,432,801, or 2.1 percent, increase over<strong>the</strong> FY 2012 approved Local funds budget <strong>of</strong> $115,294,231.Initial Adjusted <strong>Budget</strong>Eliminate: Due to <strong>the</strong> District’s recent Immigration legislation, <strong>the</strong> jail is no longer allowed to document immigrationstatus <strong>of</strong> inmates; <strong>the</strong>refore, DOC will not receive any direct federal grant funding in FY 2013 because <strong>of</strong><strong>the</strong> elimination <strong>of</strong> <strong>the</strong> State Criminal Alien Assistance Program grant, which is based on <strong>the</strong> number <strong>of</strong> inmatedaysthat <strong>the</strong> agency houses illegal immigrants. This change results in a decrease <strong>of</strong> $359,218 and 5.0 FTEs.Cost Increase: In order to meet <strong>the</strong> obligations <strong>of</strong> <strong>the</strong> department, several areas <strong>of</strong> <strong>the</strong> Local funds budget wereincreased. The Equipment budget was increased by $537,076 primarily for <strong>the</strong> purchase <strong>of</strong> maintenanceequipment, computers that will replace outdated computers; and s<strong>of</strong>tware updates to <strong>the</strong> JACCS, <strong>the</strong> prisonerinformation system, and Lotus Notes. The Local personal services budget was increased by $310,638 and 5.2 FTEsfor Fringe Benefits. The Supplies budget for clothing, toiletries, bedding, and sanitation supplies was increased by$154,706, and Rent was increased by $22,461 to cover <strong>the</strong> Corrections Corporation <strong>of</strong> America (CCA) lease agreement.The Special Purpose Revenue funds budget for Contractual Services was increased by $1,228,831 due to ahigher revenue projection from <strong>the</strong> U.S. Marshals Fund, which requires less <strong>of</strong> <strong>the</strong> contract to fund. In accordancewith <strong>the</strong> Special Purpose Revenue funds projections and prior year expenditures for <strong>the</strong> commissary fund, <strong>the</strong>budget was increased by $480,000. O<strong>the</strong>r Services and Charges increased by $155,000 in <strong>the</strong> Inmate WelfareFund, which will be used to fund additional programs for <strong>the</strong> general benefit <strong>of</strong> inmates, and $24,379 was addedto support step increases and higher fringe benefits costs.Cost Decrease: Due to a reduction in <strong>the</strong> non-billable population at <strong>the</strong> CTF, $760,553 <strong>of</strong> <strong>the</strong> housing cost wasshifted from Local funds to Special Purpose Revenue Funds. Additionally, <strong>the</strong> budget was reduced by $264,270due to expected reductions in usage in postage, printing, s<strong>of</strong>tware licensing, and books at <strong>the</strong> library as <strong>the</strong> informationis now accessed online. Due to a lower Special Purpose Revenue projection for <strong>the</strong> inmate services program,<strong>the</strong> budget was decreased by $50,000. The Intra-District budget was also decreased by $22,261 and 0.2 FTEbecause <strong>of</strong> <strong>the</strong> decrease in funding available from <strong>the</strong> Residential Substance Abuse Treatment grant, which is managedby <strong>the</strong> <strong>Office</strong> <strong>of</strong> Justice Grant Administration.Additionally Adjusted <strong>Budget</strong>Technical Adjustment: Adjustment <strong>of</strong> Fringe Benefits to restore <strong>the</strong> District Government contribution for employeehealth insurance from 72 percent, implemented in <strong>the</strong> FY 2011 budget, to 75 percent in FY 2013, resulting inincreases <strong>of</strong> $317,000 in Local funds, $6,000 in Special Purpose Revenue funds, and $251 in Intra-District funds.Department <strong>of</strong> CorrectionsC-44FY 2013 Proposed <strong>Budget</strong> and <strong>Financial</strong> Plan
Policy InitiativeCost Increase: The agency included additional $900,000 in Local funds to purchase Equipment for <strong>the</strong> InmateProcessing center, $300,000 to cover <strong>the</strong> cost <strong>of</strong> retrospective career ladder promotions, and $10,000 to cover <strong>the</strong>cost <strong>of</strong> <strong>the</strong> evaluation <strong>of</strong> <strong>the</strong> Juvenile program (One-Time).Cost Decrease: Local funds include <strong>the</strong> decreases <strong>of</strong> $1,411,661 for <strong>the</strong> housing contract at <strong>the</strong> CorrectionsTreatment Facility and $694,339 to adjust <strong>the</strong> food contract, both due to a decline <strong>of</strong> <strong>the</strong> inmate population.FY 2012 Approved <strong>Budget</strong> to FY 2013 Proposed <strong>Budget</strong>, by Revenue TypeTable FL0-5 itemizes <strong>the</strong> changes by revenue type between <strong>the</strong> FY 2012 approved budget and <strong>the</strong> FY 2013 proposedbudget.Table FL0-5(dollars in thousands)DIVISION BUDGET FTELOCAL FUNDS: FY 2012 Approved <strong>Budget</strong> and FTE 115,294 867.6Fringe Benefit Rate Adjustment Multiple Programs 916 0.0Recurring <strong>Budget</strong> Items Multiple Programs 372 0.0Consumer Price Index Multiple Programs 906 0.0Personal Services Growth Factor Multiple Programs 239 0.0FY 2013 Current Services Funding Level <strong>Budget</strong> (CSFL) 117,727 867.6Cost Increase: Nonpersonal services costs for jail Multiple Programs 537 0.0maintenance, computer equipment, and s<strong>of</strong>twareCost Increase: Align budget and FTE with personal Multiple Programs 311 5.2service adjustmentCost Increase: Inmate supplies for clothing, toiletries, Multiple Programs 155 0.0bedding, and sanitation supplies for <strong>the</strong> CentralDetention FacilityCost Increase: Correctional Treatment Facility lease payment Multiple Programs 22 0.0Cost Decrease: Funding for CTF Housing Multiple Programs -761 0.0shifted to Special Purpose Revenue FundsCost Decrease: Postage, printing, and s<strong>of</strong>tware licensing fees Multiple Programs -264 0.0FY 2013 Initial Adjusted <strong>Budget</strong> 117,727 872.8Technical Adjustment: Health insurance contribution Multiple Programs 317 0.0FY 2013 Additionally Adjusted <strong>Budget</strong> 118,044 872.8FY 2013 Policy InitiativesCost Increase: One-Time costs to purchase Equipment Inmate Custody 900 0.0for <strong>the</strong> Imate Processing centerCost Increase: Retrospective funding adjustment to Inmate Custody 300 0.0cover <strong>the</strong> cost <strong>of</strong> career ladder promotionsCost Increase: Additional funding to cover <strong>the</strong> cost Inmate Services 10 0.0<strong>of</strong> <strong>the</strong> evaluation <strong>of</strong> <strong>the</strong> Juvenile program (One-Time)Cost Decrease: To adjust <strong>the</strong> cost <strong>of</strong> <strong>the</strong> housing contract Inmate Custody -1,412 0.0at <strong>the</strong> Correction Treatment Facility due to population declineCost Decrease: To adjust <strong>the</strong> cost <strong>of</strong> <strong>the</strong> agency's Inmate Custody -694 0.0food contract due to a decline <strong>of</strong> <strong>the</strong> inmate populationLOCAL FUNDS: FY 2013 Proposed <strong>Budget</strong> and FTE 117,148 872.8(Continued on <strong>the</strong> next page)FY 2013 Proposed <strong>Budget</strong> and <strong>Financial</strong> PlanDepartment <strong>of</strong> CorrectionsC-45
Table FL0-5 (Continued)(dollars in thousands)DIVISION BUDGET FTEFEDERAL GRANT FUNDS: FY 2012 Approved <strong>Budget</strong> and FTE 359 5.0Eliminate: Loss <strong>of</strong> grant for <strong>the</strong> State Criminal Alien Multiple Programs -359 -5.0Assistance ProgramFY 2013 Initial Adjusted <strong>Budget</strong> 0 0.0FEDERAL GRANT FUNDS: FY 2013 Proposed <strong>Budget</strong> and FTE 0 0.0SPECIAL PURPOSE REVENUE FUNDS: FY 2012 Approved <strong>Budget</strong> and FTE 20,297 20.0Cost Increase: Contractual Services budget for inmate housing Inmate Services Programs 1,229 0.0Cost Increase: Adjust Special Purpose Revenue Funds budget Inmate Services Programs 480 0.0to accurately reflect revenue projections for <strong>the</strong> Commissary FundCost Increase: Align budget with projected revenue Inmate Services Programs 155 0.0for <strong>the</strong> Inmate Welfare FundCost Increase: Personal services budget for salary, Multiple Programs 24 0.0step, and Fringe Benefits increasesCost Decrease: Adjust budget to align with revenue projections Inmate Services Programs -50 0.0FY 2013 Initial Adjusted <strong>Budget</strong> 22,135 20.0Technical Adjustment: Health insurance contribution Multiple Programs 6 0.0FY 2013 Additionally Adjusted <strong>Budget</strong> 22,141 20.0SPECIAL PURPOSE REVENUE FUNDS: FY 2013 Proposed <strong>Budget</strong> and FTE 22,141 20.0INTRA-DISTRICT FUNDS: FY 2012 Approved <strong>Budget</strong> and FTE 337 1.4Cost Decrease: Reduction in Intra-District arrangement Multiple Programs -22 -0.2for <strong>the</strong> Residential Substance Abuse Treatmentgrant from <strong>Office</strong> <strong>of</strong> Justice Grant AdministrationFY 2013 Initial Adjusted <strong>Budget</strong> 315 1.2Technical Adjustment: Health insurance contribution (less than $500) Multiple Programs 0 0.0FY 2013 Additionally Adjusted <strong>Budget</strong> 315 1.2INTRA-DISTRICT FUNDS: FY 2013 Proposed <strong>Budget</strong> and FTE 315 1.2Gross for FL0 - Department <strong>of</strong> Corrections 139,604 894.0(Change is calculated by whole numbers and numbers may not add up due to rounding)Department <strong>of</strong> CorrectionsC-46FY 2013 Proposed <strong>Budget</strong> and <strong>Financial</strong> Plan
<strong>Agency</strong> Performance PlanThe agency’s performance plan has <strong>the</strong> following objectives for FY 2013:1. <strong>Agency</strong> Management ServicesObjective 1: Improve economy, efficiency and effectiveness <strong>of</strong> agency operations.Objective 2: Upgrade workforce.<strong>Agency</strong> Management ServicesFY 2010 FY 2011 FY 2011 FY 2012 FY 2013 FY 2014Measure Actual Target Actual Projection Projection ProjectionFederal Revenue Reimbursement Rate(dollars reimbursed divided by dollars billed) 99.18% 95% 80.62% 95% 95% 95%Priority 1 Maintenance and Repair Completion Rate(Percentage <strong>of</strong> priority 1 maintenance and repairrequests completed within 8 hours) 74.86% 85% 82.14% 80% 80% 80%2. Inmate CustodyObjective 1: Foster an environment that promotes safety for inmates, staff, visitors and <strong>the</strong> community-at-large.Objective 2: Provide timely and accurate inmate documents and risk assessments.Inmate CustodyFY 2010 FY 2011 FY 2011 FY 2012 FY 2013 FY 2014Measure Actual Target Actual Projection Projection ProjectionInmate on inmate assault rate (assaults per 10,000inmate-days) 2.39 2.4 0.71 1.0 0.8 0.6Inmate on staff assault rate (assaults per 10,000inmate-days) 2.30 2. 3 1.05 1.0 1.0 1.0Percent <strong>of</strong> disciplinary reports adjudicated ascharged 0.00% 75% 97.21% 90% 93% 95%Percent <strong>of</strong> Inmate on staff assaults resulting inpapered charges 0.00% 5% 3.35% 5% 5% 5%Percent <strong>of</strong> contraband seizures resulting in paperedcharges 0.00% 25% 31.59% 30% 33% 40%Delayed Release Rate 0.50% 0.50% 0.38% 0.35% 0.35% 0.35%Erroneous Release Rate 0.02% 0.04% 0.10% 0.08% 0.06% 0.05%FY 2013 Proposed <strong>Budget</strong> and <strong>Financial</strong> PlanDepartment <strong>of</strong> CorrectionsC-47
3. Inmate ServicesObjective 1: Improve inmate education and job skill levels and facilitate successful community re-integration.Objective 2: Maintain/improve inmate physical and mental health.Objective 3: Improve daily living conditions.Inmate ServicesFY 2010 FY 2011 FY 2011 FY 2012 FY 2013 FY 2014Measure Actual Target Actual Projection Projection ProjectionInmates served by re-entry program 0.00 500 471 1,000 1,200 1,400Inmates served by educational programs orreceiving educational counseling services 0.00 500 3,621 2,000 2,250 2,500Percentage <strong>of</strong> inmates released to community withrequired medications 96.58% 95% 98.71% 95% 95% 95%Inmate pharmaceuticals expenditure variance 25% 15% 170.04% 15% 15% 15%Inmates served by substance abuse treatmentprogram 0.00 340 360 400 400 400Number <strong>of</strong> unresolved inmate grievancesoutstanding more than 30 days 214 5 0.00 5 5 5Inmates served by video-visitation program 0.00% 5% 90.47% 85% 87% 90%Department <strong>of</strong> CorrectionsC-48FY 2013 Proposed <strong>Budget</strong> and <strong>Financial</strong> Plan
District <strong>of</strong> Columbia National Guardhttp://dcng.ngb.army.milTelephone: 202-685-9978(FK0)% ChangeFY 2011 FY 2012 FY 2013 fromDescription Actual Approved Proposed FY 2012Operating <strong>Budget</strong> $5,008,408 $6,639,444 $8,815,317 32.8FTEs 66.8 68.2 112.0 64.1Joint Force Headquarters - District <strong>of</strong> Columbia (JFHQ-DC) maintainsand provides trained and ready D.C. National Guard (DCNG)units, personnel, and equipment to achieve <strong>the</strong> federal war-fightingmission, to support <strong>the</strong> District <strong>of</strong> Columbia Emergency ResponsePlan, and to add value to <strong>the</strong> community through local programs.JFHQ-DC facilitates <strong>the</strong> integration <strong>of</strong> federal and state activities toprovide expertise and situational awareness to <strong>the</strong> District <strong>of</strong>Columbia and <strong>the</strong> Department <strong>of</strong> Defense.Summary <strong>of</strong> ServicesFederal Mission: Support <strong>the</strong> readiness <strong>of</strong> DC National Guard (DCNG) units to perform federally assigned missions,both at home and abroad. District <strong>of</strong> Columbia personnel provides direct support to key functional areasincluding operations, training, and readiness, to ensure DCNG units can defend <strong>the</strong> nation and <strong>the</strong> capital. DistrictMission: Emergency Preparedness/Emergency Response: Prepare for and respond to requests for National Guardsupport from <strong>the</strong> Mayor, and lead federal agencies within <strong>the</strong> National Capital Region and Joint ForceHeadquarters - National Capital Region (JFHQ - NCR). Community Mission: Maximize <strong>the</strong> use <strong>of</strong> availableDepartment <strong>of</strong> Defense family and youth programs to support <strong>the</strong> citizens <strong>of</strong> <strong>the</strong> District <strong>of</strong> Columbia.The agency’s FY 2013 proposed budget is presented in <strong>the</strong> following tables:FY 2013 Proposed <strong>Budget</strong> and <strong>Financial</strong> PlanDistrict <strong>of</strong> Columbia National GuardC-49
FY 2013 Proposed Gross Funds Operating <strong>Budget</strong>, by Revenue TypeTable FK0-1 contains <strong>the</strong> proposed FY 2013 agency budget compared to <strong>the</strong> FY 2012 approved budget. It alsoprovides <strong>the</strong> FY 2010 and FY 2011 actual expenditures.Table FK0-1(dollars in thousands)ChangeActual Actual Approved Proposed from PercentAppropriated Fund FY 2010 FY 2011 FY 2012 FY 2013 FY 2012 Change*General FundLocal Funds 3,317 2,204 2,270 2,796 526 23.2Total for General Fund 3,317 2,204 2,270 2,796 526 23.2Federal ResourcesFederal Payments 254 463 375 500 125 33.3Federal Grant Funds 2,363 2,341 3,994 5,519 1,525 38.2Total for Federal Resources 2,617 2,804 4,369 6,019 1,650 37.8Gross Funds 5,935 5,008 6,639 8,815 2,176 32.8*Percent change is based on whole dollars.Note: If applicable, for a breakdown <strong>of</strong> each Grant (Federal and Private), Special Purpose Revenue type and Intra-District agreement,please refer to Schedule 80 <strong>Agency</strong> Summary by Revenue Source in <strong>the</strong> FY 2013 Operating Appendices located on <strong>the</strong> <strong>Office</strong> <strong>of</strong> <strong>the</strong><strong>Chief</strong> <strong>Financial</strong> <strong>Office</strong>r’s website.FY 2013 Proposed Full-Time Equivalents, by Revenue TypeTable FK0-2 contains <strong>the</strong> proposed FY 2013 FTE level compared to <strong>the</strong> FY 2012 approved FTE level by revenuetype. It also provides FY 2010 and FY 2011 actual data.Table FK0-2ChangeActual Actual Approved Proposed from PercentAppropriated Fund FY 2010 FY 2011 FY 2012 FY 2013 FY 2012 ChangeGeneral FundLocal Funds 24.4 27.6 27.5 37.8 10.2 37.3Total for General Fund 24.4 27.6 27.5 37.8 10.2 37.3Federal ResourcesFederal Grant Funds 40.7 39.2 40.8 74.2 33.5 82.2Total for Federal Resources 40.7 39.2 40.8 74.2 33.5 82.2Total Proposed FTEs 65.1 66.8 68.2 112.0 43.8 64.1District <strong>of</strong> Columbia National GuardC-50FY 2013 Proposed <strong>Budget</strong> and <strong>Financial</strong> Plan
FY 2013 Proposed Operating <strong>Budget</strong>, by Comptroller Source GroupTable FK0-3 contains <strong>the</strong> proposed FY 2013 budget at <strong>the</strong> Comptroller Source Group (object class) level comparedto <strong>the</strong> FY 2012 approved budget. It also provides FY 2010 and FY 2011 actual expenditures.Table FK0-3(dollars in thousands)ChangeActual Actual Approved Proposed from PercentComptroller Source Group FY 2010 FY 2011 FY 2012 FY 2013 FY 2012 Change*11 - Regular Pay - Continuing Full Time 2,483 2,462 2,991 4,748 1,757 58.712 - Regular Pay - O<strong>the</strong>r 150 366 666 493 -173 -26.013 - Additional Gross Pay 64 68 109 69 -40 -36.514 - Fringe Benefits - Current Personnel 509 536 833 1,334 501 60.115 - Overtime Pay 16 13 5 17 12 242.0Subtotal Personal Services (PS) 3,223 3,446 4,604 6,661 2,057 44.720 - Supplies and Materials 31 7 41 44 3 7.430 - Energy, Comm. and Building Rentals 859 372 372 372 0 0.031 - Telephone, Telegraph, Telegram, Etc. 3 0 12 12 0 0.033 - Janitorial Services 465 0 0 0 0 N/A35 - Occupancy Fixed Costs 151 -9 0 0 0 N/A40 - O<strong>the</strong>r Services and Charges 36 36 119 111 -8 -6.841 - Contractual Services - O<strong>the</strong>r 197 0 0 0 0 N/A50 - Subsidies and Transfers 970 1,156 1,474 1,575 101 6.970 - Equipment and Equipment Rental 0 0 17 40 23 132.6Subtotal Nonpersonal Services (NPS) 2,712 1,562 2,035 2,154 119 5.8Gross Funds 5,935 5,008 6,639 8,815 2,176 32.8*Percent change is based on whole dollars.FY 2013 Proposed <strong>Budget</strong> and <strong>Financial</strong> PlanDistrict <strong>of</strong> Columbia National GuardC-51
Program DescriptionThe District <strong>of</strong> Columbia National Guard operates through <strong>the</strong> following 3 programs:Joint Force Headquarters, D.C. – maintains trained and equipped forces in a state <strong>of</strong> readiness, prepared torespond to Presidential orders to support Federal and District government agencies. DCNG also provides continuousassistance to District public safety agencies. Non-deployable personnel are required to maintain continuity <strong>of</strong>operations under Title 49, Military, <strong>of</strong> <strong>the</strong> D.C. Official Code.This program contains <strong>the</strong> following 10 activities:■ Command Element – provides leadership and direction to agency command staff in all matters pertaining tomilitary support, training, Joint Air, and Joint Counter Drug Operations;■ State Judge Advocate General – provides legal advice, review, and support to <strong>the</strong> agency military command;■ US Property and Fiscal <strong>Office</strong> – provides comprehensive and efficient financial management services, includingcontract administration, appropriate federal billings, and <strong>the</strong> transfer <strong>of</strong> Federal funds;■ Army Aviation Support Facility – supports military aviation unit within <strong>the</strong> command;■ J1 Personnel/Human Resource <strong>Office</strong> – is <strong>the</strong> military personnel branch <strong>of</strong> <strong>the</strong> agency;■ Human Resource <strong>Office</strong> – supports <strong>the</strong> agency’s human resource functions;■ Department <strong>of</strong> Engineering – provides agency facilities planning, maintenance, and repair services;■ 113th - operates <strong>the</strong> military air wing <strong>of</strong> <strong>the</strong> D.C. National Guard, which provides continuous and immediateairborne response in defense <strong>of</strong> <strong>the</strong> National Capital Regional;■ J3/Operations – is <strong>the</strong> planning, operations, and training branch, which ensures that troops are combat ready;and■ J6/IT – maintains secure technologies to produce and communicate information within and between <strong>the</strong> variousmilitary command elements.Youth Programs – sponsors a variety <strong>of</strong> programs for youth including <strong>the</strong> National Guard Youth ChalleNGe programand a Youth Leaders Camp.This program contains <strong>the</strong> following 2 activities:■ ChalleNGe – is a voluntary community-based program that leads, trains, and mentors at-risk youth; and■ Youth Leaders’ Camp – is a free, annual 14-day residential camp that provides youth an opportunity to learnand implement principles <strong>of</strong> leadership, citizenship, and sportsmanship.<strong>Agency</strong> Management – provides administrative support and <strong>the</strong> required tools to achieve operational and programmaticresults. This program is standard for all performance-based budgeting agencies.Program Structure ChangeThe District <strong>of</strong> Columbia National Guard has no program structure changes in <strong>the</strong> FY 2013 proposed budget.Protected Programs: The District remains committed to maintaining DCNG’s ChalleNGe program that beganoperation in 2007. The program helps at risk youths to receive <strong>the</strong>ir GED and acquire life skills that will assist <strong>the</strong>mthrough life. DCNG is also able to <strong>of</strong>fer tuition assistance.District <strong>of</strong> Columbia National GuardC-52FY 2013 Proposed <strong>Budget</strong> and <strong>Financial</strong> Plan
FY 2013 Proposed Operating <strong>Budget</strong> and FTEs, by Program and ActivityTable FK0-4 contains <strong>the</strong> proposed FY 2013 budget by program and activity compared to <strong>the</strong> FY 2012 approved budget.It also provides <strong>the</strong> FY 2011 actual data.Table FK0-4(dollars in thousands)Dollars in ThousandsFull-Time EquivalentsChangeChangeActual Approved Proposed from Actual Approved Proposed fromProgram/Activity FY 2011 FY 2012 FY 2013 FY 2012 FY 2011 FY 2012 FY 2013 FY 2012(1000) <strong>Agency</strong> Management(1010) Administrative Service 163 245 317 72 3.0 3.0 3.0 0.0(1020) Contracting and Procurement 415 189 223 34 2.0 2.0 2.0 0.0(1030) Property Management 47 0 0 0 0.0 0.0 0.0 0.0(1050) <strong>Financial</strong> Services 62 68 71 3 1.0 1.0 1.0 0.0(110F) <strong>Agency</strong> <strong>Financial</strong> Operations 97 94 144 50 1.0 1.0 1.0 0.0Subtotal (1000) <strong>Agency</strong> Management 784 596 755 159 7.0 7.0 7.0 0.0(3000) Community Support(3010) Youth Services 23 0 0 0 0.0 0.0 0.0 0.0Subtotal (3000) Community Support 23 0 0 0 0.0 0.0 0.0 0.0(4000) Youth Programs(4010) Challenge 1,258 1,775 3,439 1,664 6.0 6.0 49.0 43.0(4030) Youth Leaders Camp 66 70 71 2 1.0 1.0 1.0 0.0Subtotal (4000) Youth Programs 1,324 1,845 3,511 1,666 7.0 7.0 50.0 43.0(6000) Joint Force Headquarters, D.C.(6010) Command Element 313 112 62 -50 3.0 2.0 1.0 -1.0(6011) State Judge Advocate General 55 84 79 -5 1.0 1.0 1.0 0.0(6012) US Property and Fiscal <strong>Office</strong> 149 227 292 65 3.0 4.0 5.0 1.0(6020) AASF 116 116 62 -54 2.0 2.0 1.0 -1.0(6030) J1 Personnel 134 269 570 300 2.0 2.0 2.0 0.0(6040) Human Resource <strong>Office</strong> 88 99 54 -44 1.0 2.0 1.0 -1.0(6060) Department <strong>of</strong> Engineering 1,634 2,686 2,821 135 32.7 33.0 36.0 3.0(6070) 113th 33 55 55 0 1.0 1.0 1.0 0.0(6080) J3/Operations 151 163 181 18 2.0 2.0 2.0 0.0(6090) J6/IT 202 387 372 -15 5.0 5.2 5.0 -0.2Subtotal (6000) Joint Force Headquarters, D.C. 2,877 4,198 4,549 351 52.8 54.2 55.0 0.8Total Proposed Operating <strong>Budget</strong> 5,008 6,639 8,815 2,176 66.8 68.2 112.0 43.8(Change is calculated by whole numbers and numbers may not add up due to rounding)Note: For more detailed information regarding <strong>the</strong> proposed funding for <strong>the</strong> activities within this agency’s programs, please see Schedule 30-PBBProgram Summary by Activity in <strong>the</strong> FY 2013 Operating Appendices located on <strong>the</strong> <strong>Office</strong> <strong>of</strong> <strong>the</strong> <strong>Chief</strong> <strong>Financial</strong> <strong>Office</strong>r’s website.FY 2013 Proposed <strong>Budget</strong> and <strong>Financial</strong> PlanDistrict <strong>of</strong> Columbia National GuardC-53
FY 2013 Proposed <strong>Budget</strong> ChangesThe District <strong>of</strong> Columbia National Guard’s (DCNG) proposed FY 2013 gross budget is $8,815,317, which representsa 32.8 percent increase over its FY 2012 approved gross budget <strong>of</strong> $6,639,444. The budget is comprised <strong>of</strong>$2,796,346 in Local funds, $500,000 in Federal Payments, and $5,518,971 in Federal Grants.Current Services Funding LevelThe Current Services Funding Level (CSFL) is a Local funds ONLY representation <strong>of</strong> <strong>the</strong> true cost <strong>of</strong> operatingDistrict agencies, before consideration <strong>of</strong> policy decisions. The CSFL reflects changes from <strong>the</strong> FY 2012 approvedbudget across multiple programs, and it estimates how much it would cost an agency to continue its current programsand operations into <strong>the</strong> following fiscal year. The initial adjustments in <strong>the</strong> budget proposal representchanges that should be compared to <strong>the</strong> FY 2013 CSFL budget and not necessarily changes made to <strong>the</strong> FY 2012Local funds budget. The FY 2013 CSFL adjustments to <strong>the</strong> FY 2012 Local funds budget are described in table 5<strong>of</strong> this agency's budget chapter. Please see <strong>the</strong> CSFL Development section within Volume 1: Executive Summaryfor more information regarding <strong>the</strong> methodology used and components that comprise <strong>the</strong> CSFL.DCNG’s FY 2013 CSFL budget is $2,494,087, which represents a $224,012, or 9.9 percent, increase over <strong>the</strong>FY 2012 approved Local funds budget <strong>of</strong> $2,270,075.Initial Adjusted <strong>Budget</strong>Cost Decrease: Federal Grant funds were decreased by $88,145 from <strong>the</strong> Federal Operation Maintenance (Army)FOMA Training grant, $63,546 from <strong>the</strong> FOMA Air grant, and $20,361 from <strong>the</strong> Distance Learning grant.Additionally Adjusted <strong>Budget</strong>Technical Adjustment: Adjustment <strong>of</strong> Fringe Benefits to restore <strong>the</strong> District Government contribution for employeehealth insurance from 72 percent, implemented in <strong>the</strong> FY 2011 budget, to 75 percent in FY 2013, resulting inincreases <strong>of</strong> $7,962 in Local funds and $9,000 in Federal Grant funds.Additional Adjustments: DCNG adjusted its Federal Grants budget by reducing $9,000, to <strong>of</strong>fset <strong>the</strong> impact <strong>of</strong><strong>the</strong> policy that restored <strong>the</strong> District’s health insurance contribution.Policy InitiativesCost Increase: There was an increase <strong>of</strong> 41.0 FTEs to support <strong>the</strong> Youth ChalleNGe program. The positions havesplit funding, 25 percent Local and 75 percent Federal Grants, for a total <strong>of</strong> $549,046 and $1,349,987 respectively.There was an increase in <strong>the</strong> Federal Operation Maintenance Army grant (FOMA) for $288,000 and 3.0 FTEsand an additional $58,000 to properly align <strong>the</strong> budget for anticipated grant funding. Federal Payments were shiftedby $25,966 to align to <strong>the</strong> proposed Federal Payment level.Cost Decrease: DCNG’s Local budget was reduced by $34,095 in order to match Tuition Assistance funding.Shift: DCNG’s Local budget was reduced by $99,034 for funding and services that were shifted to FederalPayments.Technical Adjustments: Local funding was decreased by $121,609 to remove funding that was no longer necessaryfor property management.District <strong>of</strong> Columbia National GuardC-54FY 2013 Proposed <strong>Budget</strong> and <strong>Financial</strong> Plan
FY 2012 Approved <strong>Budget</strong> to FY 2013 Proposed <strong>Budget</strong>, by Revenue TypeTable FK0-5 itemizes <strong>the</strong> changes by revenue type between <strong>the</strong> FY 2012 approved budget and <strong>the</strong> FY 2013 proposedbudget.Table FK0-5(dollars in thousands)PROGRAM BUDGET FTELOCAL FUNDS: FY 2012 Approved <strong>Budget</strong> and FTE 2,270 27.5Recurring <strong>Budget</strong> Items Multiple Programs 70 0.0Fringe Benefit Rate Adjustment Multiple Programs 24 0.0Consumer Price Index Multiple Programs 1 0.0Fixed Cost Inflation Factor Multiple Programs 122 0.0Personal Services Growth Factor Multiple Programs 7 0.0FY 2013 Current Services Funding Level <strong>Budget</strong> (CSFL) 2,494 27.5Technical Adjustment: Health insurance contribution Multiple Programs 8 0.0FY 2013 Additionally Adjusted <strong>Budget</strong> 2,502 27.5FY 2013 Policy InitiativesCost Increase: Additional support for <strong>the</strong> Youth ChalleNGE program Youth Challenge Program 549 10.2Cost Decrease: To <strong>the</strong> amount needed to match <strong>the</strong> Tuition Joint Force Headquarters, D.C. -34 0.0Assistance fundingShift: Services moved to <strong>the</strong> Federal Payment from Local funding <strong>Agency</strong> Management -99 0.0Technical Adjustments: Removed funding no longer <strong>Agency</strong> Management -122 0.0necessary for property managementLOCAL FUNDS: FY 2013 Proposed <strong>Budget</strong> and FTE 2,796 37.8FEDERAL PAYMENTS: FY 2012 Approved <strong>Budget</strong> and FTE 375 0.0FY 2013 Policy InitiativesShift: From Local funds Subsidies and Transfers to Federal Payments Multiple Programs 71 0.0Shift: From Local funds Equipment and Equipment Rental Multiple Programs 28 0.0to Federal PaymentsShift: From Local funds Supplies and Materials to Federal Payments Multiple Programs 26 0.0FEDERAL PAYMENTS: FY 2013 Proposed <strong>Budget</strong> and FTE 500 0.0FEDERAL GRANT FUNDS: FY 2012 Approved <strong>Budget</strong> and FTE 3,994 40.8Cost Decrease: FOMA - Army grant reduced Joint Force Headquarters, D.C. -88 0.0Cost Decrease: FOMA - Air grant reduced Joint Force Headquarters, D.C. -64 0.0Cost Decrease: Distance Learning grant reduced Joint Force Headquarters, D.C. -20 0.2FY 2013 Initial Adjusted <strong>Budget</strong> 3,822 41.0Additional Adjustments: To adjust vacancy savings to <strong>of</strong>fset <strong>the</strong> Joint Force Headquarters, D.C. -9 0.0technical adjustment for <strong>the</strong> health insurance contributionTechnical Adjustment: Health insurance contribution Multiple Programs 9 0.0FY 2013 Additionally Adjusted <strong>Budget</strong> 3,822 41.0FY 2013 Policy InitiativesCost Increase: For <strong>the</strong> Youth ChalleNGE program Youth Challenge Program 1,350 30.8Cost Increase: In personal sevices for FOMA-Army training grant Joint Force Headquarters, D.C. 288 3.0Cost Increase:To properly align budget for anticipated grant funding Joint Force Headquarters, D.C. 58 0.0FEDERAL GRANT FUNDS: FY 2013 Proposed <strong>Budget</strong> and FTE 5,518 74.8Gross for FK0 - District <strong>of</strong> Columbia National Guard 8,815 112.0(Change is calculated by whole numbers and numbers may not add up due to rounding)FY 2013 Proposed <strong>Budget</strong> and <strong>Financial</strong> PlanDistrict <strong>of</strong> Columbia National GuardC-55
<strong>Agency</strong> Performance PlanThe agency’s performance plan has <strong>the</strong> following objectives for FY 2013:Objective 1: Rapidly and efficiently respond with un-mobilized units to contingency requests from <strong>the</strong> Executive<strong>Office</strong> <strong>of</strong> <strong>the</strong> Mayor to provide military, emergency, and community support as prescribed in <strong>the</strong> District <strong>of</strong>Columbia Emergency Response Plan.Objective 2: Ensure timely support to <strong>the</strong> District government during emergencies, civil disturbances, and naturaldisasters.Objective 3: Increase <strong>the</strong> number <strong>of</strong> applicants, etc.Performance MeasuresFY 2010 FY 2011 FY 2011 FY 2012 FY 2013 FY 2014Measure Actual Target Actual Projection Projection ProjectionEnd strength 2,654 2,654 2,563 2,654 2,654 2,654Number <strong>of</strong> Counter Drug Operations 138 50 58 50 50 50Number <strong>of</strong> Civil Support Team exercise hours 5,900 5,900 3,380 5,600 5,600 5,600Number <strong>of</strong> Preparedness exercises 10 20 13 20 20 20Number <strong>of</strong> completion / graduates from YouthLeaders Camp 117 100 94 100 100 100Number <strong>of</strong> completion / graduates from AboutFace Program 0.0 90 159 90 90 90Number <strong>of</strong> participants from Youth Challenge program(DCYCP) 38 100 80 100 100 100Number <strong>of</strong> participants from Drug Education for Youth(DEFY) program 120 120 60 60 60 60District <strong>of</strong> Columbia National GuardC-56FY 2013 Proposed <strong>Budget</strong> and <strong>Financial</strong> Plan
Homeland Security and EmergencyManagement <strong>Agency</strong>(BN0)www.hsema.dc.govTelephone: 202-727-6161% ChangeFY 2011 FY 2012 FY 2013 fromDescription Actual Approved Proposed FY 2012Operating <strong>Budget</strong> $114,641,479 $137,447,730 $102,039,144 -25.8FTEs 36.9 56.0 65.0 16.1The mission <strong>of</strong> <strong>the</strong> District <strong>of</strong> Columbia’s Homeland Security andEmergency Management <strong>Agency</strong> (HSEMA) is to support and coordinatehomeland security and emergency management efforts, ensuringthat <strong>the</strong> District <strong>of</strong> Columbia’s all-hazards emergency operationsare prepared to protect against, plan for, respond to, and recover fromnatural and man-made hazards.Summary <strong>of</strong> ServicesHSEMA coordinates all planning and preparedness efforts, training and exercises, and homeland security grants,and it facilitates a common operating picture during events to enable good decision-making and response. Thiscommon operating picture will achieve situational awareness and, where possible, eliminate or minimizeconflicting information received from numerous sources.The Homeland Security and Emergency Management <strong>Agency</strong> is comprised <strong>of</strong> five major divisions: 1) Plansand Preparedness Division facilitates <strong>the</strong> comprehensive planning that promotes resiliency in government agencies,our communities and critical infrastructure; 2) Training and Exercises Division ensures that all relevantindividuals, agencies and responders are able to operate in <strong>the</strong>ir respective roles through effective training courses,hazard and capabilities-based exercises, and plan validations; 3) Operations Division provides situational awareness,logistical and resource support, and field command operation to coordinate incident response, mitigation, andrecovery, and to support District and Federal agencies during special events; 4) Homeland Security Grants Divisionis <strong>the</strong> State Administrative Agent (SAA) for <strong>the</strong> federal homeland security grant programs that are awarded to <strong>the</strong>District <strong>of</strong> Columbia and to <strong>the</strong> National Capital Region (NCR), which encompasses neighboring counties inMaryland and Virginia, and it provides programmatic oversight to grant-funded homeland-security projects toensure milestones are met and are in compliance with <strong>the</strong> applicable grant guidance; and 5) <strong>Agency</strong> Management/<strong>Office</strong> <strong>of</strong> <strong>the</strong> Director provides leadership to internal agency operations to perform its overall mission efficientlyFY 2013 Proposed <strong>Budget</strong> and <strong>Financial</strong> PlanHomeland Security and Emergency Management <strong>Agency</strong>C-57
and effectively, leads <strong>the</strong> Mayor’s Special Events Task Group, supports a community engagement program and publicinformation program to connect with and inform <strong>the</strong> public, and provides leadership to <strong>the</strong> Washington regionas members <strong>of</strong> <strong>the</strong> National Capital Region homeland security policy advisory group.The agency’s FY 2013 proposed budget is presented in <strong>the</strong> following tables:FY 2013 Proposed Gross Funds Operating <strong>Budget</strong>, by Revenue TypeTable BN0-1 contains <strong>the</strong> proposed FY 2013 agency budget compared to <strong>the</strong> FY 2012 approved budget. It alsoprovides FY 2010 and FY 2011 actual expenditures.Table BN0-1(dollars in thousands)ChangeActual Actual Approved Proposed from PercentAppropriated Fund FY 2010 FY 2011 FY 2012 FY 2013 FY 2012 Change*General FundLocal Funds 3,561 1,839 1,829 2,007 178 9.7Total for General Fund 3,561 1,839 1,829 2,007 178 9.7Federal ResourcesFederal Grant Funds 91,831 112,794 135,619 100,032 -35,586 -26.2Total for Federal Resources 91,831 112,794 135,619 100,032 -35,586 -26.2Intra-District FundsIntra-District Funds 235 9 0 0 0 N/ATotal for Intra-District Funds 235 9 0 0 0 N/AGross Funds 95,627 114,641 137,448 102,039 -35,409 -25.8*Percent change is based on whole dollars.Note: If applicable, for a breakdown <strong>of</strong> each Grant (Federal and Private), Special Purpose Revenue type and Intra-District agreement,please refer to Schedule 80 <strong>Agency</strong> Summary by Revenue Source in <strong>the</strong> FY 2013 Operating Appendices located on <strong>the</strong> <strong>Office</strong> <strong>of</strong> <strong>the</strong><strong>Chief</strong> <strong>Financial</strong> <strong>Office</strong>r’s website.FY 2013 Proposed Full-Time Equivalents, by Revenue TypeTable BN0-2 contains <strong>the</strong> proposed FY 2013 FTE level compared to <strong>the</strong> FY 2012 approved FTE level by revenuetype. It also provides FY 2010 and FY 2011 actual data.Table BN0-2ChangeActual Actual Approved Proposed from PercentAppropriated Fund FY 2010 FY 2011 FY 2012 FY 2013 FY 2012 ChangeGeneral FundLocal Funds 22.5 15.0 16.5 16.5 0.0 0.0Total for General Fund 22.5 15.0 16.5 16.5 0.0 0.0Federal ResourcesFederal Grant Funds 26.4 21.9 39.5 48.5 9.0 22.8Total for Federal Resources 26.4 21.9 39.5 48.5 9.0 22.8Total Proposed FTEs 48.8 36.9 56.0 65.0 9.0 16.1Homeland Security and Emergency Management <strong>Agency</strong>C-58FY 2013 Proposed <strong>Budget</strong> and <strong>Financial</strong> Plan
FY 2013 Proposed Operating <strong>Budget</strong>, by Comptroller Source GroupTable BN0-3 contains <strong>the</strong> proposed FY 2013 budget at <strong>the</strong> Comptroller Source Group (object class) level comparedto <strong>the</strong> FY 2012 approved budget. It also provides FY 2010 and FY 2011 actual expenditures.Table BN0-3(dollars in thousands)ChangeActual Actual Approved Proposed from PercentComptroller Source Group FY 2010 FY 2011 FY 2012 FY 2013 FY 2012 Change*11 - Regular Pay - Continuing Full Time 2,851 2,574 2,769 2,997 229 8.312 - Regular Pay - O<strong>the</strong>r 1,182 1,172 1,541 1,881 340 22.113 - Additional Gross Pay 112 202 30 353 322 1,057.714 - Fringe Benefits - Current Personnel 722 772 968 1,189 220 22.815 - Overtime Pay 95 154 110 326 216 196.5Subtotal Personal Services (PS) 4,962 4,874 5,418 6,746 1,327 24.520 - Supplies and Materials 116 73 93 100 7 7.330 - Energy, Comm. and Building Rentals 253 0 0 0 0 N/A31 - Telephone, Telegraph, Telegram, Etc. 392 68 100 100 0 0.033 - Janitorial Services 65 0 0 0 0 N/A34 - Security Services 509 0 0 0 0 N/A35 - Occupancy Fixed Costs 62 0 0 0 0 N/A40 - O<strong>the</strong>r Services and Charges 9,345 3,381 1,538 4,737 3,198 207.941 - Contractual Services - O<strong>the</strong>r 1,373 2,986 7,348 10,961 3,613 49.250 - Subsidies and Transfers 78,005 100,757 120,815 75,040 -45,775 -37.970 - Equipment and Equipment Rental 545 2,502 2,136 4,356 2,221 104.0Subtotal Nonpersonal Services (NPS) 90,664 109,768 132,029 95,293 -36,736 -27.8Gross Funds 95,627 114,641 137,448 102,039 -35,409 -25.8*Percent change is based on whole dollars.FY 2013 Proposed <strong>Budget</strong> and <strong>Financial</strong> PlanHomeland Security and Emergency Management <strong>Agency</strong>C-59
Division DescriptionThe Homeland Security and Emergency Management <strong>Agency</strong> operates through <strong>the</strong> following 5 divisions:Plans and Preparedness - coordinates <strong>the</strong> preparedness, response, and recovery efforts <strong>of</strong> <strong>the</strong> District and its federaland regional partners. The division is responsible for <strong>the</strong> creation, implementation, and revision <strong>of</strong> plans dictating<strong>the</strong> operational alignment and tempo <strong>of</strong> steady-state, threat-initiated, and incident-state scenarios.This division contains <strong>the</strong> following 2 activities:■ Planning - provides training and education to individuals and organizations in <strong>the</strong> District <strong>of</strong> Columbia andsurrounding jurisdictions with <strong>the</strong> goals <strong>of</strong> saving lives, protecting property, and safeguarding <strong>the</strong> environment;and■ Training - Conducts training for emergency personnel and citizens.Operations - serves as <strong>the</strong> central hub <strong>of</strong> information within HSEMA, processing and analyzing information froma myriad <strong>of</strong> sources and disseminating it to create situational awareness. Provides well-coordinated critical and essentialservices during and immediately after emergencies and disasters within <strong>the</strong> District <strong>of</strong> Columbia and surroundingjurisdictions. The goals <strong>of</strong> <strong>the</strong>se services are to protect health and property, to expedite <strong>the</strong> return to astate <strong>of</strong> normality, and to guard against <strong>the</strong> effects <strong>of</strong> future disasters.Homeland Security Grants - serves as <strong>the</strong> State Administrative Agent (SAA) for <strong>the</strong> Federal Homeland SecurityGrant programs that are awarded to <strong>the</strong> District <strong>of</strong> Columbia, and for grant programs awarded to <strong>the</strong> NationalCapital Region (NCR), which encompasses neighboring counties in Maryland and Virginia.This division contains 20 activities in <strong>the</strong> following 2 categories:■ Homeland Security/State - identifies and mitigates threats, risks, and vulnerabilities within <strong>the</strong> District <strong>of</strong>Columbia; and■ Homeland Security/Regional - serves as <strong>the</strong> SAA for <strong>the</strong> Department <strong>of</strong> Homeland Security grants awardedto <strong>the</strong> District and <strong>the</strong> National Capital Region.Training and Exercise - ensures that all relevant individuals are able to operate in <strong>the</strong>ir respective roles, throughtraining courses, hazard and capabilities-based exercises, and plan validations. Conducts training/educational programsfor emergency personnel, key <strong>of</strong>ficials, and citizens.<strong>Agency</strong> Management - provides administrative support and <strong>the</strong> required tools to achieve operational and programmaticresults. This division is standard for all agencies using performance-based budgeting.Division Structure ChangeThe Homeland Security and Emergency Management <strong>Agency</strong> has no division structure changes in <strong>the</strong> FY 2013 proposedbudget.Homeland Security and Emergency Management <strong>Agency</strong>C-60FY 2013 Proposed <strong>Budget</strong> and <strong>Financial</strong> Plan
FY 2013 Proposed Operating <strong>Budget</strong> and FTEs, by Division and ActivityTable BN0-4 contains <strong>the</strong> proposed FY 2013 budget by division and activity compared to <strong>the</strong> FY 2012 approved budget.It also provides <strong>the</strong> FY 2011 actual data.Table BN0-4(dollars in thousands)Dollars in ThousandsFull-Time EquivalentsChangeChangeActual Approved Proposed from Actual Approved Proposed fromDivision/Activity FY 2011 FY 2012 FY 2013 FY 2012 FY 2011 FY 2012 FY 2013 FY 2012(1000) <strong>Agency</strong> Management(1010) Personnel 0 10 0 -10 0.0 0.0 0.0 0.0(1020) Contracting and Procurement 0 4 0 -4 0.0 0.0 0.0 0.0(1030) Property Management 21 26 18 -7 0.0 0.0 0.0 0.0(1040) Information Technology 48 42 86 44 0.0 0.0 0.0 0.0(1320) All Hazards Emergency Support Services 2,470 1,935 1,770 -165 11.4 17.0 15.0 -2.0No Activity Assigned 9 0 0 0 0.0 0.0 0.0 0.0Subtotal (1000) <strong>Agency</strong> Management 2,549 2,018 1,874 -143 11.4 17.0 15.0 -2.0(2000) Plans and Preparedness(2100) Planning 2,783 373 272 -101 1.5 3.0 3.0 0.0(2400) Training 277 0 6 6 0.0 0.0 0.0 0.0Subtotal (2000) Plans and Preparedness 3,061 373 278 -95 1.5 3.0 3.0 0.0(3000) Operations(3100) Incident Command and Disaster 1,662 1,292 2,309 1,016 13.1 15.0 24.0 9.0Subtotal (3000) Operations 1,662 1,292 2,309 1,016 13.1 15.0 24.0 9.0(4000) Homeland Security Grants(4100) Homeland Security/State 98,566 127,113 88,631 -38,482 6.9 14.0 16.0 2.0(4101) Homeland Security/State 0 435 600 165 0.0 0.0 0.0 0.0(4102) Homeland Security/State 0 36 50 14 0.0 0.0 0.0 0.0(4103) Homeland Security/State 18 0 350 350 0.0 0.0 0.0 0.0(4104) Homeland Security/DC Command and Cont. Ex. 0 2,328 1,600 -728 0.0 0.0 0.0 0.0(4105) Homeland Security/UASI 0 0 100 100 0.0 0.0 0.0 0.0(4106) HS/Citizen Preparedness and Public Education 0 0 130 130 0.0 0.0 0.0 0.0(4107) HS/Vertical Communities 0 0 85 85 0.0 0.0 0.0 0.0(4108) Homeland Security/EOC Staff Support 30 0 0 0 0.0 0.0 0.0 0.0(4109) Homeland Security/State/RCPG 405 1,060 1,115 55 0.0 0.0 0.0 0.0(4110) HS/Inauguration Ex.Backfill and OT 0 0 37 37 0.0 0.0 0.0 0.0(4111) HS/Outreach Marketing and Promotion 0 73 73 0 0.0 0.0 0.0 0.0(4112) HS/Enhancement <strong>of</strong> VIPS Program 331 200 0 -200 0.0 0.0 0.0 0.0(Continued on next page)FY 2013 Proposed <strong>Budget</strong> and <strong>Financial</strong> PlanHomeland Security and Emergency Management <strong>Agency</strong>C-61
Table BN0-4 (Continued)(dollars in thousands)Dollars in ThousandsFull-Time EquivalentsChangeChangeActual Approved Proposed from Actual Approved Proposed fromDivision/Activity FY 2011 FY 2012 FY 2013 FY 2012 FY 2011 FY 2012 FY 2013 FY 2012(4113) Homeland Security/UASI Mass Not Sys Main 0 400 50 -350 0.0 0.0 0.0 0.0(4114) Homeland Security/Exercise Plan 0 5 205 200 0.0 0.0 0.0 0.0(4118) HS/Cyber Security Strategic Roadmap 0 0 85 85 0.0 0.0 0.0 0.0(4119) HS/Compliance <strong>Office</strong>r 32 2 2 0 0.0 0.0 0.0 0.0(4120) HS/Strat. Anay. and Info Sharing 0 0 210 210 0.0 0.0 0.0 0.0(4123) HS/CCTV Expansion 1,735 500 100 -400 0.0 0.0 0.0 0.0(4126) HS/EOC Staff Support Continuation 318 200 0 -200 0.0 0.0 0.0 0.0(4127) HS/SHSP Outreach 278 100 0 -100 0.0 0.0 0.0 0.0(4128) HS/Five Year Exercise Plan 296 100 0 -100 0.0 0.0 0.0 0.0(4131) Homeland Security 48 0 2,523 2,523 0.0 0.0 0.0 0.0(4133) HS/Situational Awareness Dashboard 0 0 850 850 0.0 0.0 0.0 0.0(4136) HS/Hazardous Materials Rep. System 0 0 220 220 0.0 0.0 0.0 0.0(4200) Homeland Security/Regional 5,235 500 0 -500 0.0 0.0 0.0 0.0Subtotal (4000) Homeland Security Grants 107,292 133,053 97,016 -36,037 6.9 14.0 16.0 2.0(5000) Training and Exercise(5100) Training 79 624 562 -62 3.3 6.0 7.0 1.0(5300) Outreach 0 87 0 -87 0.6 1.0 0.0 -1.0Subtotal (5000) Training and Exercise 79 712 562 -149 4.0 7.0 7.0 0.0Total Proposed Operating <strong>Budget</strong> 114,641 137,448 102,039 -35,409 36.9 56.0 65.0 9.0(Change is calculated by whole numbers and numbers may not add up due to rounding)Note: For more detailed information regarding <strong>the</strong> proposed funding for <strong>the</strong> activities within this agency’s divisions, please see Schedule 30-PBBProgram Summary by Activity in <strong>the</strong> FY 2013 Operating Appendices located on <strong>the</strong> <strong>Office</strong> <strong>of</strong> <strong>the</strong> <strong>Chief</strong> <strong>Financial</strong> <strong>Office</strong>r’s website.Homeland Security and Emergency Management <strong>Agency</strong>C-62FY 2013 Proposed <strong>Budget</strong> and <strong>Financial</strong> Plan
FY 2013 Proposed <strong>Budget</strong> ChangesThe Homeland Security and Emergency Management <strong>Agency</strong>’s (HSEMA) proposed FY 2013 gross budget is$102,039,144, which represents a 25.8 percent decrease from its FY 2012 approved gross budget <strong>of</strong> $137,447,730.The budget is comprised <strong>of</strong> $2,006,892 in Local funds and $100,032,252 in Federal Grants funds.Current Services Funding LevelThe Current Services Funding Level (CSFL) is a Local funds ONLY representation <strong>of</strong> <strong>the</strong> true cost <strong>of</strong> operatingDistrict agencies, before consideration <strong>of</strong> policy decisions. The CSFL reflects changes from <strong>the</strong> FY 2012 approvedbudget across multiple programs, and it estimates how much it would cost an agency to continue its current programsand operations into <strong>the</strong> following fiscal year. The initial adjustments in <strong>the</strong> budget proposal representchanges that should be compared to <strong>the</strong> FY 2013 CSFL budget and not necessarily changes made to <strong>the</strong> FY 2012Local funds budget. The FY 2013 CSFL adjustments to <strong>the</strong> FY 2012 Local funds budget are described in table 5<strong>of</strong> this agency's budget chapter. Please see <strong>the</strong> CSFL Development section within Volume 1: Executive Summaryfor more information regarding <strong>the</strong> methodology used and components that comprise <strong>the</strong> CSFL.HSEMA’s FY 2013 CSFL budget is $1,940,303, which represents an $111,264, or 6.1 percent, increase over<strong>the</strong> FY 2012 approved Local funds budget <strong>of</strong> $1,829,039.Initial Adjusted <strong>Budget</strong>Cost Increase: HSEMA increased Local funds by $9,370 in O<strong>the</strong>r Services and Charges to cover new projectexpenses, $6,145 in Equipment for <strong>the</strong> replacement <strong>of</strong> computers, and $1,600 for additional Supplies. In FederalGrant funds, <strong>the</strong> agency increased Contractual Services by $3,612,975, O<strong>the</strong>r Services and Charges by $3,184,624,Equipment by $2,214,480, and Supplies by $5,000. Personal services for salary, steps and Fringe Benefits in FederalGrant funds increased $1,171,481 and include 9.0 new full-time equivalent (FTE) positions.Cost Decrease: To <strong>of</strong>fset increases in Local funds nonpersonal services, <strong>the</strong> agency reduced Additional Gross Payby $16,462 and Contractual Services by $653. In Federal Grant funds, Subsidies and Transfers were reduced by$45,775,000 from <strong>the</strong> expiration and reduction <strong>of</strong> funding in existing grants.Additionally Adjusted <strong>Budget</strong>Technical Adjustments: Adjustment <strong>of</strong> Fringe Benefits to restore <strong>the</strong> District Government contribution foremployee health insurance from 72 percent, implemented in <strong>the</strong> FY 2011 budget, to 75 percent in FY 2013, resultingin an increase <strong>of</strong> $6,589 to HSEMA’s Local funds and $15,229 to Federal Grant funds.Additional Adjustments: Federal Grant funds were reduced by $15,229 in Overtime to <strong>of</strong>fset <strong>the</strong> cost <strong>of</strong> <strong>the</strong> healthinsurance contribution.Policy InitiativesCost Increase: Local funds were increased by $60,000 in Additional Gross Pay to cover <strong>the</strong> higher rate for unionpay differential.FY 2013 Proposed <strong>Budget</strong> and <strong>Financial</strong> PlanHomeland Security and Emergency Management <strong>Agency</strong>C-63
FY 2012 Approved <strong>Budget</strong> to FY 2013 Proposed <strong>Budget</strong>, by Revenue TypeTable BN0-5 itemizes <strong>the</strong> changes by revenue type between <strong>the</strong> FY 2012 approved budget and <strong>the</strong> FY 2013 proposedbudget.Table BN0-5(dollars in thousands)PROGRAM BUDGET FTELOCAL FUNDS: FY 2012 Approved <strong>Budget</strong> and FTE 1,829 16.5Fringe Benefit Rate Adjustment Multiple Programs 19 0.0Recurring <strong>Budget</strong> Items Multiple Programs 80 0.0Consumer Price Index Multiple Programs 5 0.0Personal services growth factor Multiple Programs 6 0.0FY 2013 Current Services Funding Level <strong>Budget</strong> (CSFL) 1,940 16.5Cost Increase: Adjustment to O<strong>the</strong>r Services and Charges <strong>Agency</strong> Management 9 0.0Cost Increase: Adjustment to Equipment <strong>Agency</strong> Management 6 0.0Cost Increase: Adjustment to Supplies <strong>Agency</strong> Management 2 0.0Cost Decrease: Adjustment for salary, steps, and Fringe Benefits Multiple Programs -16 0.0Cost Decrease: Adjustment to Contractual Services <strong>Agency</strong> Management -1 0.0FY 2013 Initial Adjusted <strong>Budget</strong> 1,940 16.5Technical Adjustment: Health insurance contribution Multiple Programs 7 0.0FY 2013 Additionally Adjusted <strong>Budget</strong> 1,947 16.5FY 2013 Policy InitiativesCost Increase: Policy adjustment for union pay differential Operations 60 0.0LOCAL FUNDS: FY 2013 Proposed <strong>Budget</strong> and FTE 2,007 16.5FEDERAL GRANT FUNDS: FY 2012 Approved <strong>Budget</strong> and FTE 135,619 39.5Cost Increase: Adjustment to Contractual Services Homeland Security Grants 3,613 0.0Cost Increase: Adjustment to O<strong>the</strong>r Services and Charges Homeland Security Grants 3,185 0.0Cost Increase: Adjustment to Equipment Homeland Security Grants 2,214 0.0Cost Increase: Adjustments for salary, steps, Fringe Benefits and Multiple Programs 1,171 9.0new FTEsCost Increase: Adjustment to Supplies Homeland Security Grants 5 0.0Cost Decrease: Adjustment to Subsidies and Transfers Homeland Security Grants -45,775 0.0FY 2013 Initial Adjusted <strong>Budget</strong> 100,032 48.5Technical Adjustment: Health insurance contribution Multiple Programs 15 0.0Additional Adjustments: Adjustment to compensate for Homeland Security Grants -15 0.0<strong>the</strong> Health insurance contributionFY 2013 Additionally Adjusted <strong>Budget</strong> 100,032 48.5FEDERAL GRANT FUNDS: FY 2013 Proposed <strong>Budget</strong> and FTE 100,032 48.5Gross for BN0 - Homeland Security and Emergency Management <strong>Agency</strong> 102,039 65.0(Change is calculated by whole numbers and numbers may not add up due to rounding)Homeland Security and Emergency Management <strong>Agency</strong>C-64FY 2013 Proposed <strong>Budget</strong> and <strong>Financial</strong> Plan
<strong>Agency</strong> Performance PlanThe agency’s performance plan has <strong>the</strong> following objectives for FY 2013:1. Plans and Preparedness DivisionObjective 1: Identify <strong>the</strong> District’s greatest risks, prioritize preparedness efforts according to those risks, and enhancecapabilities that address <strong>the</strong> risks.Objective 2: Devise contingencies to sustain essential government operations and protect critical infrastructure andkey assets.Plans and Preparedness DivisionFY 2010 FY 2011 FY 2011 FY 2012 FY 2013 FY 2014Measure Actual Target Actual Projection Projection ProjectionNumber <strong>of</strong> COOP plans developed for lead EmergencySupport Function agencies (ESF) 1 12 6 17 TBD TBD TBDNumber <strong>of</strong> critical infrastructure plans (CIP) developed,reviewed and/or updated 2 1 1 1 1 1 1Number <strong>of</strong> reviewed and updated HSEMA plansannually 36 10 19 29 29 29Percentage <strong>of</strong> finalized CONOPS (Concept <strong>of</strong>Operations Plan) within 72 hours <strong>of</strong> EOC ActivationsNotfor planned events Available 100% 100% 100% 100% 100%COOP: Continuity <strong>of</strong> Operations PlanFY 2013 Proposed <strong>Budget</strong> and <strong>Financial</strong> PlanHomeland Security and Emergency Management <strong>Agency</strong>C-65
2. Training and Exercise DivisionObjective 1: Ensure compliance with Homeland Security Exercise and Evaluation Program (HSEEP) requirements3 .Objective 2: Ensure that all programs and exercises are compliant with National Incident Management System(NIMS) standards and guidelines 4 .Objective 3: Ensure that all programs, training classes and exercises incorporate requirements for <strong>the</strong> District’s specialneeds population.Objective 4: The Training and Exercise Division will engage local, regional, federal and private sector entities in <strong>the</strong>development and execution <strong>of</strong> training and exercises when required.Training and Exercise DivisionFY 2010 FY 2011 FY 2011 FY 2012 FY 2013 FY 2014Measure Actual Target Actual Projection Projection ProjectionPercentage <strong>of</strong> all programs and exercises compliantwith National Incident Management System(NIMS) standards and guidelines 100% 100% 100% 100% 100% 100%Percentage <strong>of</strong> all programs, training classes andexercises incorporate requirements for <strong>the</strong>District’s special needs population 100% 100% 100% 100% 100% 100%Increase exercise participants’ satisfaction ratingby 5% annually 64% 80% 80% TBD TBD 80%Percentage <strong>of</strong> corrective action items in afteraction reports successfully implemented incompliance with HSEEP 5 100% 100% 100% 100% 100% 100%Percentage <strong>of</strong> new District employees trained in Not 5 Not 6 Not 7 Not 8emergency preparedness 100% 100% Available Available Available AvailableNumber <strong>of</strong> exercises conducted 2 4 4 5 5 5Percentage <strong>of</strong> After Action Reports (AAR)completed after every exercise 9 100% 100% 100% 100% 100% 100%HSEEP: Homeland Security Exercise and Evaluation ProgramHomeland Security and Emergency Management <strong>Agency</strong>C-66FY 2013 Proposed <strong>Budget</strong> and <strong>Financial</strong> Plan
3. Operations DivisionObjective 1: Ensure a common operating picture during emergencies to facilitate informed decision-making andresponse.Objective 2: Coordinate and integrate all activities necessary to build, sustain, and improve <strong>the</strong> capability to mitigateagainst, prepare for, respond to, and recover from threatened or actual natural disasters, acts <strong>of</strong> terrorism, oro<strong>the</strong>r man-made disasters.Operations DivisionFY 2010 FY 2011 FY 2011 FY 2012 FY 2013 FY 2014Measure Actual Target Actual Projection Projection ProjectionNumber <strong>of</strong> District special events supported eachquarter 10 8 11 4 TBD TBD TBD TBDNumber <strong>of</strong> unannounced tests <strong>of</strong> <strong>the</strong> EmergencyAlert System completed annually 365 365 365 365 365 365Percentage <strong>of</strong> After Action Reports (AAR) for every Not Not NotEmergency Operations Center activation 12 Available Available Available Baseline 13 100% 100%Percentage <strong>of</strong> testing <strong>the</strong> Emergency Operations Not Not NotCenter Emergency Communications tools 14 Available Available Available Baseline 15 100% 100%Updating Emergency Contact list on WebEOC 16 Not Not NotAvailable Available Available Baseline 17 100% 100%4. Homeland Security Grants DivisionObjective 1: Improve <strong>the</strong> District’s and <strong>the</strong> Region’s administration <strong>of</strong> grant funding for preparedness, response,and recovery capabilities.Objective 2: Identify emergency preparedness areas in need <strong>of</strong> improvement.Objective 3: Provide critical information for dissemination, as needed, to Congress, <strong>the</strong> public, <strong>the</strong> media, and <strong>the</strong>emergency management community.Homeland Security Grants DivisionFY 2010 FY 2011 FY 2011 FY 2012 FY 2013 FY 2014Measure Actual Target Actual Projection Projection ProjectionPercentage <strong>of</strong> grant dollars spent within <strong>the</strong>timeframe <strong>of</strong> <strong>the</strong> grants 100% 100% 100% 100% 100% 100%Number <strong>of</strong> audit exceptions reported in <strong>the</strong>Notannual D.C. Single Audit 18 6 Available 2 TBD TBD TBDPercentage <strong>of</strong> subgrants issued within 45 days <strong>of</strong>award receipt Baseline 19 80% 97.4% 85% 90% 90%Percentage <strong>of</strong> subgrantee’s budget spent onNotprogrammatic costs 20 Available 65% 90.25% 65% 65% 65%Percentage <strong>of</strong> scheduled monitoring reports asdefined in agency monitoring plan completedNotfor each grant award 21 Available 100% 100% 100% 100% 100%FY 2013 Proposed <strong>Budget</strong> and <strong>Financial</strong> PlanHomeland Security and Emergency Management <strong>Agency</strong>C-67
5. <strong>Office</strong> <strong>of</strong> <strong>the</strong> Director (<strong>Agency</strong> Management Program)Objective 1: Ensure that HSEMA provides its divisions with sufficient resources while ensuring that all fiscalrequirements are fulfilled.Objective 2: Increase awareness to <strong>the</strong> public and District agencies on community preparedness, resiliency andemergency management.Objective 3: Ensure that <strong>the</strong> District <strong>of</strong> Columbia’s overall homeland security objectives are addressed as part <strong>of</strong> <strong>the</strong>NCR UASI homeland security grant awards decision-making process.<strong>Agency</strong> Management / <strong>Office</strong> <strong>of</strong> <strong>the</strong> DirectorFY 2010 FY 2011 FY 2011 FY 2012 FY 2013 FY 2014Measure Actual Target Actual Projection Projection ProjectionNumber <strong>of</strong> HSEMA planned outreach events 22 Not 20 37 55 55 55AvailablePercent increase <strong>of</strong> recipients <strong>of</strong> DC Alerts 23 Not 15% 23% 16% 17% 18%AvailablePercentage <strong>of</strong> Neighborhood Block Party Permits Not Not Notprocessed within 15 business days 24 Available Available Available Baseline 25 100% 100%Percentage <strong>of</strong> travel reimbursements processed Not Not Notand closed within 30 business days <strong>of</strong> receipt 26 Available Available Available Baseline 27 100% 100%Performance Plan Endnotes:1 All COOP plans for lead ESF agencies were completed in FY 2010.2 Only one CIP Plan will be developed because <strong>the</strong> District <strong>of</strong> Columbia is a single jurisdiction.3 HSEEP is a capabilities and performance-based exercise program which provides a standardized policy, methodology, andterminology for exercise design, development, conduct, evaluation, and improvement planning. HSEEP Policy and Guidance ispresented in detail in HSEEP Volumes I-III, US Department <strong>of</strong> Homeland Security. Adherence to <strong>the</strong> policy and guidancepresented in <strong>the</strong> HSEEP Volumes ensures that exercise programs conform to established best practices and helps provide unityand consistency <strong>of</strong> effort for exercises at all levels <strong>of</strong> government. https://hseep.dhs.gov/pages/1001_About.aspx.4 The National Incident Management System (NIMS) is a nationally mandated systematic, proactive approach to guide agenciesat all levels <strong>of</strong> government, nongovernmental organizations, and <strong>the</strong> private sector to work seamlessly to prevent, protectagainst, respond to, recover from, and mitigate <strong>the</strong> effects <strong>of</strong> incidents, regardless <strong>of</strong> cause, size, location, or complexity, inorder to reduce <strong>the</strong> loss <strong>of</strong> life and property and harm to <strong>the</strong> environment. NIMS provides <strong>the</strong> template for <strong>the</strong> management <strong>of</strong>incidents nationwide, The Secretary <strong>of</strong> Homeland Security, through <strong>the</strong> National Integration Center (NIC), publishes <strong>the</strong>standards, guidelines, and compliance protocols for determining whe<strong>the</strong>r a Federal, State, tribal, or local government hasimplemented NIMS as is federally mandated and required for DHS funding.5 This data is no longer available. In <strong>the</strong> past, HSEMA’s outreach staff delivered new hire orientation. The Training and ExerciseDivision is no longer directly involved in <strong>the</strong> delivery <strong>of</strong> new hire orientation. The <strong>Office</strong> <strong>of</strong> Personnel has made <strong>the</strong> new hireorientation available to new hires via video.6 See citation 127 See citation 128 See citation 129 May be a short AAR, Summary with Evaluations, Quick look, or full AAR depending on depth and breadth <strong>of</strong> exercise.Homeland Security and Emergency Management <strong>Agency</strong>C-68FY 2013 Proposed <strong>Budget</strong> and <strong>Financial</strong> Plan
Performance Plan Endnotes: (Continued)10 This value was obtained using <strong>the</strong> following formula: # <strong>of</strong> FY 2011 events (September 30, 2010 to October 1, 2011) HSEMAOperations Division supported divided by four quarters per year = # <strong>of</strong> Special events supported per quarter.11 The total number <strong>of</strong> special events approved by <strong>the</strong> Mayor’s Special Events Task Group and supported by HSEMA OperationsDivision for FY 2010 is 30.12 For all planned and unplanned EOC activations, each AAR will include <strong>the</strong> collection <strong>of</strong> Situation Reports, final summary memowith documentation that closes out <strong>the</strong> activation activity.13 FY 2012 is <strong>the</strong> first year this KPI will be measured.14 Includes Conference Bridge testing at every shift every day, Video teleconference testing every week with o<strong>the</strong>r EOCs in <strong>the</strong>National Capital Region, and EOC stationary satellite phone testing annually (with o<strong>the</strong>r EOCs and select Cabinet members).15 FY 2012 is <strong>the</strong> first year this KPI will be measured.16 Quarterly updates <strong>of</strong> emergency contacts for key utilities (such as PEPCO, DC Water, etc.), Emergency Liaisons, federal partners,Cabinet members, etc.17 FY 2012 is <strong>the</strong> first year this KPI will be measured.18 The Department <strong>of</strong> Homeland Security grants are audited annually in <strong>the</strong> District <strong>of</strong> Columbia’s Single Audit <strong>of</strong> federal grantexpenditures; it can be concluded that <strong>the</strong> fewer number <strong>of</strong> audit exceptions reported is an indicator <strong>of</strong> stronger managementand oversight by <strong>the</strong> HSEMA Grants Division staff.19 FY 2010 is <strong>the</strong> first year this KPI will be measured.20 The Wise Giving Alliance <strong>of</strong> <strong>the</strong> Better Business Bureau identifies 65% to be an industry standard for this measurehttp://www.bbb.org/us/Charity-Standards/. This metric measures all sub grantees’ programmatic costs as a percentage <strong>of</strong> <strong>the</strong>iroverall costs.21 Pursuant to 11.4 <strong>of</strong> <strong>the</strong> Grants Manual and Source Book all District agencies must complete monitoring reports. All Districtagencies should be in compliance with this standard. The standard is 100%.22 FY 2012, 2013 and 2014 projections are based on eight ward events, up to twelve DC language access and functional needscommunity events, up to eight events anticipated from <strong>the</strong> <strong>Office</strong> <strong>of</strong> <strong>the</strong> Director, ten community emergency managementplanning meetings, up to five National Preparedness Month (NPM) events, up to twelve Truck Touch events- up. FY 2011 valuesare based on estimated number <strong>of</strong> events annually which includes: three focus groups in 2010, eight ward based exercises in2011, one functional exercise <strong>of</strong> DC alert in 2011, four special needs seminars in 2011, ten community management planningmeetings in 2011, ten Truck Touch events for <strong>the</strong> Deputy Mayor’s <strong>of</strong>fice in 2011, four events for NPM in 2011 and <strong>the</strong> severewea<strong>the</strong>r symposium in 2011.23 As <strong>of</strong> 9/16/11, FY 2011 users: 44,546. FY 2010 users: 34,176. YTD total: 117,145.24 Upon HSEMA receipt <strong>of</strong> completed applications.25 FY 2012 is <strong>the</strong> first year this KPI will be measured.26 Process begins once travel reimbursement request documentation has been submitted by staff.27 FY 2012 is <strong>the</strong> first year this KPI will be measured.FY 2013 Proposed <strong>Budget</strong> and <strong>Financial</strong> PlanHomeland Security and Emergency Management <strong>Agency</strong>C-69
(DQ0)Commission on Judicial Disabilities andTenurewww.cjdt.dc.govTelephone: 202-727-1363% ChangeFY 2011 FY 2012 FY 2013 fromDescription Actual Approved Proposed FY 2012Operating <strong>Budget</strong> $272,710 $295,000 $295,000 0.0FTEs 1.9 2.0 2.0 0.0The mission <strong>of</strong> <strong>the</strong> Commission on Judicial Disabilities and Tenure(CJDT) is to preserve an independent and fair judiciary.Summary <strong>of</strong> ServicesThe services provided by CJDT are as follows: reviewing complaints concerning <strong>the</strong> misconduct <strong>of</strong> judges; conductingperformance evaluations <strong>of</strong> associate judges eligible for reappointment; conducting fitness and qualificationreviews <strong>of</strong> retiring and senior judges; and processing <strong>the</strong> involuntary retirement <strong>of</strong> judges for health reasons.The agency’s FY 2013 proposed budget is presented in <strong>the</strong> following tables:FY 2013 Proposed <strong>Budget</strong> and <strong>Financial</strong> PlanCommission on Judicial Disabilities and TenureC-71
FY 2013 Proposed Gross Funds Operating <strong>Budget</strong>, by Revenue TypeTable DQ0-1 contains <strong>the</strong> proposed FY 2013 agency budget compared to <strong>the</strong> FY 2012 approved budget. It alsoprovides FY 2010 and FY 2011 actual expenditures.Table DQ0-1(dollars in thousands)ChangeActual Actual Approved Proposed from PercentAppropriated Fund FY 2010 FY 2011 FY 2012 FY 2013 FY 2012 Change*Federal ResourcesFederal Payments 263 273 295 295 0 0.0Total for Federal Resources 263 273 295 295 0 0.0Gross Funds 263 273 295 295 0 0.0*Percent change is based on whole dollars.Note: If applicable, for a breakdown <strong>of</strong> each Grant (Federal and Private), Special Purpose Revenue type and Intra-District agreement,please refer to Schedule 80 <strong>Agency</strong> Summary by Revenue Source in <strong>the</strong> FY 2013 Operating Appendices located on <strong>the</strong> <strong>Office</strong> <strong>of</strong> <strong>the</strong><strong>Chief</strong> <strong>Financial</strong> <strong>Office</strong>r’s website.FY 2013 Proposed Full-Time Equivalents, by Revenue TypeTable DQ0-2 contains <strong>the</strong> proposed FY 2013 FTE level compared to <strong>the</strong> FY 2012 approved FTE level by revenuetype. It also provides FY 2010 and FY 2011 actual data.Table DQ0-2ChangeActual Actual Approved Proposed from PercentAppropriated Fund FY 2010 FY 2011 FY 2012 FY 2013 FY 2012 ChangeFederal ResourcesFederal Payments 2.0 1.9 2.0 2.0 0.0 0.0Total for Federal Resources 2.0 1.9 2.0 2.0 0.0 0.0Total Proposed FTEs 2.0 1.9 2.0 2.0 0.0 0.0Commission on Judicial Disabilities and TenureC-72FY 2013 Proposed <strong>Budget</strong> and <strong>Financial</strong> Plan
FY 2013 Proposed Operating <strong>Budget</strong>, by Comptroller Source GroupTable DQ0-3 contains <strong>the</strong> proposed FY 2013 budget at <strong>the</strong> Comptroller Source Group (object class) level comparedto <strong>the</strong> FY 2012 approved budget. It also provides FY 2010 and FY 2011 actual expenditures.Table DQ0-3(dollars in thousands)ChangeActual Actual Approved Proposed from PercentComptroller Source Group FY 2010 FY 2011 FY 2012 FY 2013 FY 2012 Change*11 - Regular Pay - Continuing Full Time 189 186 184 193 9 4.913 - Additional Gross Pay 0 0 5 0 -5 -100.014 - Fringe Benefits - Current Personnel 20 18 24 25 1 5.8Subtotal Personal Services (PS) 208 204 212 218 5 2.520 - Supplies and Materials 5 2 4 4 0 0.031 - Telephone, Telegraph, Telegram, Etc. 3 11 3 9 6 196.940 - O<strong>the</strong>r Services and Charges 20 27 40 31 -9 -22.041 - Contractual Services - O<strong>the</strong>r 25 16 28 28 0 0.070 - Equipment and Equipment Rental 2 12 8 6 -2 -30.7Subtotal Nonpersonal Services (NPS) 55 69 83 77 -5 -6.4Gross Funds 263 273 295 295 0 0.0*Percent change is based on whole dollars.Program DescriptionThe Commission on Judicial Disabilities and Tenure operates through <strong>the</strong> following 2 programs:Judicial Disabilities and Tenure - provides administrative support to <strong>the</strong> Judicial Disabilities and TenureCommission to ensure <strong>the</strong> Commission fulfills its mission, pursuant to section 11-1521 <strong>of</strong> <strong>the</strong> D.C. Official Code.<strong>Agency</strong> Management - provides for administrative support and <strong>the</strong> required tools to achieve operational and programmaticresults. This program is standard for all agencies using performance-based budgeting.Program Structure ChangeThe Commission on Judicial Disabilities and Tenure has no program structure changes in <strong>the</strong> FY 2013 proposedbudget.FY 2013 Proposed <strong>Budget</strong> and <strong>Financial</strong> PlanCommission on Judicial Disabilities and TenureC-73
FY 2013 Proposed Operating <strong>Budget</strong> and FTEs, by Program and ActivityTable DQ0-4 contains <strong>the</strong> proposed FY 2013 budget by program and activity compared to <strong>the</strong> FY 2012 approved budget.It also provides <strong>the</strong> FY 2011 actual data.Table DQ0-4(dollars in thousands)Dollars in ThousandsFull-Time EquivalentsChangeChangeActual Approved Proposed from Actual Approved Proposed fromProgram/Activity FY 2011 FY 2012 FY 2013 FY 2012 FY 2011 FY 2012 FY 2013 FY 2012(1000) <strong>Agency</strong> Management(1020) Contracting and Procurement 0 1 1 0 0.0 0.0 0.0 0.0Subtotal (1000) <strong>Agency</strong> Management 0 1 1 0 0.0 0.0 0.0 0.0(2000) Judicial Disabilities and Tenure(2100) Commission Administration and Support 273 294 294 0 1.9 2.0 2.0 0.0Subtotal (2000) Judicial Disabilities and Tenure 273 294 294 0 1.9 2.0 2.0 0.0Total Proposed Operating <strong>Budget</strong> 273 295 295 0 1.9 2.0 2.0 0.0(Change is calculated by whole numbers and numbers may not add up due to rounding)Note: For more detailed information regarding <strong>the</strong> proposed funding for <strong>the</strong> activities within this agency’s programs, please see Schedule 30-PBBProgram Summary by Activity in <strong>the</strong> FY 2013 Operating Appendices located on <strong>the</strong> <strong>Office</strong> <strong>of</strong> <strong>the</strong> <strong>Chief</strong> <strong>Financial</strong> <strong>Office</strong>r’s website.FY 2013 Proposed <strong>Budget</strong> ChangesThe Commission on Judicial Disabilities and Tenure’s (CJDT) proposed FY 2013 gross budget is $295,000, nochange from its FY 2012 approved gross budget. The budget is comprised entirely <strong>of</strong> Federal Payment funds.Initial Adjusted <strong>Budget</strong>Cost Increase: CJDT increased its personal services by $5,306 due to an increase in step costs and FringeBenefits.Cost Decrease: $5,306 was decreased from nonpersonal services to absorb <strong>the</strong> personal services increase.Commission on Judicial Disabilities and TenureC-74FY 2013 Proposed <strong>Budget</strong> and <strong>Financial</strong> Plan
FY 2012 Approved <strong>Budget</strong> to FY 2013 Proposed <strong>Budget</strong>, by Revenue TypeTable DQ0-5 itemizes <strong>the</strong> changes by revenue type between <strong>the</strong> FY 2012 approved budget and <strong>the</strong> FY 2013 proposedbudget.Table DQ0-5(dollars in thousands)PROGRAM BUDGET FTEFEDERAL PAYMENTS: FY 2012 Approved <strong>Budget</strong> and FTE 295 2.0Cost Increase: In personal services cost due to stepincrease and associated benefits Judicial Disabilities Tenure 5 0.0Cost Decrease: In nonpersonal services cost Judicial Disabilities Tenure -5 0.0FY 2013 Initial Adjusted <strong>Budget</strong> 295 2.0FEDERAL PAYMENTS: FY 2013 Proposed <strong>Budget</strong> and FTE 295 2.0Gross for DQ0 - Commission on Judicial Disabilities and Tenure 295 2.0(Change is calculated by whole numbers and numbers may not add up due to rounding)<strong>Agency</strong> Performance PlanThe agency’s performance plan has <strong>the</strong> following objectives for FY 2013:Objective 1: Implement electronic filing for judges <strong>of</strong> DC Courts to submit financial reports and upgrade datacabling.Performance MeasuresFY 2010 FY 2011 FY 2012 FY 2013 FY 2014Measure Actual Actual Projection Projection ProjectionMeasure 1: Complaints Reviewed 47 54 35 35 35Measure 2: Judicial Misconduct InvestigationsCompleted 18 13 15 15 15Measure 3: Judicial Reappointment EvaluationsCompleted 3 1 2 5 2Measure 4: Senior Judge Reviews Completed 16 13 13 13 14Performance Plan Endnotes:1. The Commission’s enabling statutes mandate <strong>the</strong> completion <strong>of</strong> judicial reappointment evaluations and senior judge reviews withinstrict time frames. The target numbers projected reflect <strong>the</strong> actual number <strong>of</strong> associate and senior judges <strong>of</strong> both Courts whoseterms will expire during FY 2012 through FY 2013.2. The statutes also mandate that Commission investigations are limited to matters concerning <strong>the</strong> conduct or health <strong>of</strong> a judge. TheCommission complies with <strong>the</strong> statutory requirements, and <strong>the</strong> target numbers reflected for complaints and investigations represents<strong>the</strong> average <strong>the</strong> Commission receives and conducts annually.FY 2013 Proposed <strong>Budget</strong> and <strong>Financial</strong> PlanCommission on Judicial Disabilities and TenureC-75
Judicial Nomination Commission(DV0)www.jnc.dc.govTelephone: 202-879-0478% ChangeFY 2011 FY 2012 FY 2013 fromDescription Actual Approved Proposed FY 2012Operating <strong>Budget</strong> $188,236 $205,000 $205,000 0.0FTEs 1.8 2.0 2.0 0.0The mission <strong>of</strong> <strong>the</strong> District <strong>of</strong> Columbia Judicial NominationCommission (JNC) is to screen, select, and recommend candidates to<strong>the</strong> President <strong>of</strong> <strong>the</strong> United States for nomination for judicial vacancieson <strong>the</strong> Superior Court <strong>of</strong> <strong>the</strong> District <strong>of</strong> Columbia and <strong>the</strong>District <strong>of</strong> Columbia Court <strong>of</strong> Appeals, and to appoint <strong>the</strong> chiefjudges for both courts.Summary <strong>of</strong> ServicesThe Judicial Nomination Commission notifies <strong>the</strong> bench, bar, and public <strong>of</strong> upcoming judicial vacancies, and solicitsbench, bar, and public comment on applicants. JNC screens, selects, and recommends candidates to <strong>the</strong>President <strong>of</strong> <strong>the</strong> United States for nomination to judicial vacancies on <strong>the</strong> Superior Court <strong>of</strong> <strong>the</strong> District <strong>of</strong>Columbia and <strong>the</strong> District <strong>of</strong> Columbia Court <strong>of</strong> Appeals. It is also responsible for appointing <strong>the</strong> chief judges for<strong>the</strong> Superior Court <strong>of</strong> <strong>the</strong> District <strong>of</strong> Columbia and <strong>the</strong> District <strong>of</strong> Columbia Court <strong>of</strong> Appeals.The agency’s FY 2013 proposed budget is presented in <strong>the</strong> following tables:FY 2013 Proposed <strong>Budget</strong> and <strong>Financial</strong> PlanJudicial Nomination CommissionC-77
FY 2013 Proposed Gross Funds Operating <strong>Budget</strong>, by Revenue TypeTable DV0-1 contains <strong>the</strong> proposed FY 2013 agency budget compared to <strong>the</strong> FY 2012 approved budget. It alsoprovides FY 2010 and FY 2011 actual expenditures.Table DV0-1(dollars in thousands)ChangeActual Actual Approved Proposed from PercentAppropriated Fund FY 2010 FY 2011 FY 2012 FY 2013 FY 2012 Change*Federal ResourcesFederal Payments 146 188 205 205 0 0.0Total for Federal Resources 146 188 205 205 0 0.0Gross Funds 146 188 205 205 0 0.0*Percent change is based on whole dollars.Note: If applicable, for a breakdown <strong>of</strong> each Grant (Federal and Private), Special Purpose Revenue type and Intra-District agreement,please refer to Schedule 80 <strong>Agency</strong> Summary by Revenue Source in <strong>the</strong> FY 2013 Operating Appendices located on <strong>the</strong> <strong>Office</strong> <strong>of</strong> <strong>the</strong><strong>Chief</strong> <strong>Financial</strong> <strong>Office</strong>r’s website.FY 2013 Proposed Full-Time Equivalents, by Revenue TypeTable DV0-2 contains <strong>the</strong> proposed FY 2013 FTE level compared to <strong>the</strong> FY 2012 approved FTE level by revenuetype. It also provides FY 2010 and FY 2011 actual data.Table DV0-2ChangeActual Actual Approved Proposed from PercentAppropriated Fund FY 2010 FY 2011 FY 2012 FY 2013 FY 2012 ChangeFederal ResourcesFederal Payments 1.5 1.8 2.0 2.0 0.0 0.0Total for Federal Resources 1.5 1.8 2.0 2.0 0.0 0.0Total Proposed FTEs 1.5 1.8 2.0 2.0 0.0 0.0Judicial Nomination CommissionC-78FY 2013 Proposed <strong>Budget</strong> and <strong>Financial</strong> Plan
FY 2013 Proposed Operating <strong>Budget</strong>, by Comptroller Source GroupTable DV0-3 contains <strong>the</strong> proposed FY 2013 budget at <strong>the</strong> Comptroller Source Group (object class) level comparedto <strong>the</strong> FY 2012 approved budget. It also provides FY 2010 and FY 2011 actual expenditures.Table DV0-3(dollars in thousands)ChangeActual Actual Approved Proposed from PercentComptroller Source Group FY 2010 FY 2011 FY 2012 FY 2013 FY 2012 Change*11 - Regular Pay - Continuing Full Time 80 121 110 155 46 41.612 - Regular Pay - O<strong>the</strong>r 26 20 46 0 -46 -100.013 - Additional Gross Pay 4 1 0 0 0 N/A14 - Fringe Benefits - Current Personnel 9 12 15 15 0 0.0Subtotal Personal Services (PS) 119 154 170 170 0 0.020 - Supplies and Materials 6 10 7 7 0 0.031 - Telephone, Telegraph, Telegram, Etc. 1 1 6 7 1 8.540 - O<strong>the</strong>r Services and Charges 10 15 14 14 0 0.041 - Contractual Services - O<strong>the</strong>r 6 0 4 3 -1 -14.470 - Equipment and Equipment Rental 5 8 4 4 0 0.0Subtotal Nonpersonal Services (NPS) 28 34 35 35 0 0.0Gross Funds 146 188 205 205 0 0.0*Percent change is based on whole dollars.Program DescriptionThe Judicial Nomination Commission operates through <strong>the</strong> following 2 programs:Judicial Nomination Commission - solicits, screens, and recommends candidates to <strong>the</strong> President <strong>of</strong> <strong>the</strong> UnitedStates for judicial vacancies on <strong>the</strong> District <strong>of</strong> Columbia Court <strong>of</strong> Appeals and <strong>the</strong> Superior Court <strong>of</strong> <strong>the</strong> District<strong>of</strong> Columbia.This program contains <strong>the</strong> following 2 activities:■ Advertising Judicial Vacancies – publishes, posts, and disseminates notices <strong>of</strong> judicial vacancies so that anexpanded and diverse pool <strong>of</strong> candidates can be identified and considered for judicial vacancies; and■ Commission Administration and Support - provides administration and support to ensure that applicationsare complete, applicant background investigations are conducted, public comments are sought, and applicantmaterials are readily available for Commission members’ review.<strong>Agency</strong> Management - provides for administrative support and <strong>the</strong> required tools to achieve operational and programmaticresults. This program is standard for all agencies using performance-based budgeting.Program Structure ChangeThe Judicial Nomination Commission has no program structure changes in <strong>the</strong> FY 2013 proposed budget.FY 2013 Proposed <strong>Budget</strong> and <strong>Financial</strong> PlanJudicial Nomination CommissionC-79
FY 2013 Proposed Operating <strong>Budget</strong> and FTEs, by Program and ActivityTable DV0-4 contains <strong>the</strong> proposed FY 2013 budget by program and activity compared to <strong>the</strong> FY 2012 approved budget.It also provides <strong>the</strong> FY 2011 actual data.Table DV0-4(dollars in thousands)Dollars in ThousandsFull-Time EquivalentsChangeChangeActual Approved Proposed from Actual Approved Proposed fromProgram/Activity FY 2011 FY 2012 FY 2013 FY 2012 FY 2011 FY 2012 FY 2013 FY 2012(1000) <strong>Agency</strong> Management(1020) Contracting and Procurement 0 1 1 0 0.0 0.0 0.0 0.0Subtotal (1000) <strong>Agency</strong> Management 0 1 1 0 0.0 0.0 0.0 0.0(2000) Judicial Nomination(2100) Advertising Judicial Vacancies 0 2 2 0 0.0 0.0 0.0 0.0(2500) Commission Administration and Support 188 202 202 0 1.8 2.0 2.0 0.0Subtotal (2000) Judicial Nomination 188 204 204 0 1.8 2.0 2.0 0.0Total Proposed Operating <strong>Budget</strong> 188 205 205 0 1.8 2.0 2.0 0.0(Change is calculated by whole numbers and numbers may not add up due to rounding)Note: For more detailed information regarding <strong>the</strong> proposed funding for <strong>the</strong> activities within this agency’s programs, please see Schedule 30-PBBProgram Summary by Activity in <strong>the</strong> FY 2013 Operating Appendices located on <strong>the</strong> <strong>Office</strong> <strong>of</strong> <strong>the</strong> <strong>Chief</strong> <strong>Financial</strong> <strong>Office</strong>r’s website.FY 2013 Proposed <strong>Budget</strong> ChangesThe District <strong>of</strong> Columbia Judicial Nomination Commission’s (JNC) proposed FY 2013 gross budget is $205,000,which represents no change from <strong>the</strong> FY 2012 approved budget. The budget is comprised entirely <strong>of</strong> FederalPayments.Initial Adjusted <strong>Budget</strong>Cost Increase: $45,560 in Regular Pay - Continuing Full Time and 1.0 FTE to align budget with projected personalservices costs and $529 for Telecom fixed costs.Cost Decrease: $45,560 and 1.0 FTE from Regular Pay - O<strong>the</strong>r for personal services adjustment and $529 fromContractual Services to fund <strong>the</strong> fixed cost increase for Telecom.Judicial Nomination CommissionC-80FY 2013 Proposed <strong>Budget</strong> and <strong>Financial</strong> Plan
FY 2012 Approved <strong>Budget</strong> to FY 2013 Proposed <strong>Budget</strong>, by Revenue TypeTable DV0-5 itemizes <strong>the</strong> changes by revenue type between <strong>the</strong> FY 2012 approved budget and <strong>the</strong> FY 2013 proposedbudget.Table DV0-5(dollars in thousands)PROGRAM BUDGET FTEFEDERAL PAYMENTS: FY 2012 Approved <strong>Budget</strong> and FTE 205 2.0Cost Increase: Align budget with personal services adjustment Judicial Nomination 46 1.0Cost Increase: Fixed costs for Telecom Judicial Nomination 1 0.0Cost Decrease: Reduce Regular Pay-O<strong>the</strong>r Judicial Nomination -46 -1.0Cost Decrease: Reduce Contractual Services to fund fixed costs Judicial Nomination -1 0.0FY 2013 Initial Adjusted <strong>Budget</strong> 205 2.0FEDERAL PAYMENTS: FY 2013 Proposed <strong>Budget</strong> and FTE 205 2.0Gross for DV0 - Judicial Nomination Commission 205 2.0(Change is calculated by whole numbers and numbers may not add up due to rounding)<strong>Agency</strong> Performance PlanThe agency’s performance plan has <strong>the</strong> following objective for FY 2013:Objective 1: Increase <strong>the</strong> pool <strong>of</strong> highly qualified applicants to fill each judicial vacancy within <strong>the</strong> required 60-day period ei<strong>the</strong>r prior to or following <strong>the</strong> occurrence <strong>of</strong> a vacancy in accordance with <strong>the</strong> agency’s statute.<strong>Agency</strong> Performance MeasuresFY 2010 FY 2011 FY 2012 FY 2013 FY 2014Measure Actual Target Target Projection ProjectionPercent <strong>of</strong> candidate panels for judicial vacanciespresented within statutory time frames 100% 100% 100% 100% 100%Percent <strong>of</strong> required background investigations conductedand completed on judicial vacancy applicants withinstatutory time frames 100% 100% 100% 100% 100%FY 2013 Proposed <strong>Budget</strong> and <strong>Financial</strong> PlanJudicial Nomination CommissionC-81
<strong>Office</strong> <strong>of</strong> Police Complaints(FH0)www.policecomplaints.dc.govTelephone: 202-727-3838% ChangeFY 2011 FY 2012 FY 2013 fromDescription Actual Approved Proposed FY 2012Operating <strong>Budget</strong> $1,770,245 $2,051,138 $2,091,473 2.0FTEs 21.7 23.2 23.2 0.0The mission <strong>of</strong> <strong>the</strong> <strong>Office</strong> <strong>of</strong> Police Complaints (OPC) is to increasepublic confidence in <strong>the</strong> police and promote positive communitypoliceinteractions.Summary <strong>of</strong> ServicesOPC receives, investigates, adjudicates, and mediates police misconduct complaints filed by <strong>the</strong> public againstMetropolitan Police Department (MPD) and D.C. Housing Authority Police Department (DCHAPD) police<strong>of</strong>ficers. In addition to <strong>the</strong>se responsibilities, <strong>the</strong> agency issues policy recommendations to <strong>the</strong> Mayor, <strong>the</strong> Council<strong>of</strong> <strong>the</strong> District <strong>of</strong> Columbia, and <strong>the</strong> <strong>Chief</strong>s <strong>of</strong> Police <strong>of</strong> MPD and DCHAPD proposing reforms that will promotegreater police accountability by reducing <strong>the</strong> level <strong>of</strong> police misconduct or improving <strong>the</strong> citizen complaintprocess.The agency’s FY 2013 proposed budget is presented in <strong>the</strong> following tables:FY 2013 Proposed <strong>Budget</strong> and <strong>Financial</strong> Plan<strong>Office</strong> <strong>of</strong> Police ComplaintsC-83
FY 2013 Proposed Gross Funds Operating <strong>Budget</strong>, by Revenue TypeTable FH0-1 contains <strong>the</strong> proposed FY 2013 agency budget compared to <strong>the</strong> FY 2012 approved budget. It alsoprovides <strong>the</strong> FY 2010 and FY 2011 actual expenditures.Table FH0-1(dollars in thousands)ChangeActual Actual Approved Proposed from PercentAppropriated Fund FY 2010 FY 2011 FY 2012 FY 2013 FY 2012 Change*General FundLocal Funds 2,587 1,770 2,051 2,091 40 2.0Total for General Fund 2,587 1,770 2,051 2,091 40 2.0Private FundsPrivate Donations 0 0 0 0 0 N/ATotal for Private Funds 0 0 0 0 0 N/AGross Funds 2,587 1,770 2,051 2,091 40 2.0*Percent change is based on whole dollars.Note: If applicable, for a breakdown <strong>of</strong> each Grant (Federal and Private), Special Purpose Revenue type and Intra-District agreementplease refer to Schedule 80 <strong>Agency</strong> Summary by Revenue Source in <strong>the</strong> FY 2013 Operating Appendices located on <strong>the</strong> <strong>Office</strong> <strong>of</strong> <strong>the</strong><strong>Chief</strong> <strong>Financial</strong> <strong>Office</strong>r’s website.FY 2013 Proposed Full-Time Equivalents, by Revenue TypeTable FH0-2 contains <strong>the</strong> proposed FY 2013 FTE level compared to <strong>the</strong> FY 2012 approved FTE level by revenuetype. It also provides FY 2010 and FY 2011 actual data.Table FH0-2ChangeActual Actual Approved Proposed from PercentAppropriated Fund FY 2010 FY 2011 FY 2012 FY 2013 FY 2012 ChangeGeneral FundLocal Funds 23.2 21.7 23.2 23.2 0.0 0.0Total for General Fund 23.2 21.7 23.2 23.2 0.0 0.0Total Proposed FTEs 23.2 21.7 23.2 23.2 0.0 0.0<strong>Office</strong> <strong>of</strong> Police ComplaintsC-84FY 2013 Proposed <strong>Budget</strong> and <strong>Financial</strong> Plan
FY 2013 Proposed Operating <strong>Budget</strong>, by Comptroller Source GroupTable FH0-3 contains <strong>the</strong> proposed FY 2013 budget at <strong>the</strong> Comptroller Source Group (object class) level comparedto <strong>the</strong> FY 2012 approved budget. It also provides FY 2010 and FY 2011 actual expenditures.Table FH0-3(dollars in thousands)ChangeActual Actual Approved Proposed from PercentComptroller Source Group FY 2010 FY 2011 FY 2012 FY 2013 FY 2012 Change*11 - Regular Pay - Continuing Full Time 1,076 951 1,208 1,258 50 4.212 - Regular Pay - O<strong>the</strong>r 482 423 311 272 -39 -12.613 - Additional Gross Pay 20 17 17 17 0 0.014 - Fringe Benefits - Current Personnel 252 248 305 334 29 9.615 - Overtime Pay 0 0 0 0 0 N/ASubtotal Personal Services (PS) 1,830 1,639 1,840 1,881 40 2.220 - Supplies and Materials 21 10 9 10 1 7.131 - Telephone, Telegraph, Telegram, Etc. 8 5 0 3 3 N/A32 - Rentals - Land and Structures 383 0 0 0 0 N/A34 - Security Services 45 0 0 0 0 N/A35 - Occupancy Fixed Costs 3 0 0 0 0 N/A40 - O<strong>the</strong>r Services and Charges 35 22 75 71 -4 -5.241 - Contractual Services - O<strong>the</strong>r 235 85 110 113 3 2.770 - Equipment and Equipment Rental 27 10 17 15 -3 -16.4Subtotal Nonpersonal Services (NPS) 757 132 211 211 0 0.0Gross Funds 2,587 1,770 2,051 2,091 40 2.0*Percent change is based on whole dollars.FY 2013 Proposed <strong>Budget</strong> and <strong>Financial</strong> Plan<strong>Office</strong> <strong>of</strong> Police ComplaintsC-85
Program DescriptionThe <strong>Office</strong> <strong>of</strong> Police Complaints operates through <strong>the</strong> following 4 programs:Complaint Resolution – investigates, adjudicates, and mediates misconduct complaints against sworn <strong>of</strong>ficers <strong>of</strong>MPD and DCHAPD in a fair, impartial, and timely manner.This program contains <strong>the</strong> following 3 activities:■ Investigation – investigates and produces reports related to complaints <strong>of</strong> misconduct against sworn MPD andDCHAPD <strong>of</strong>ficers;■ Adjudication – renders final determinations <strong>of</strong> police misconduct complaints against sworn <strong>of</strong>ficers <strong>of</strong> MPDand DCHAPD; and■ Mediation – provides a forum for complainants and subject <strong>of</strong>ficers to interact and, <strong>the</strong>refore, develop a betterawareness and understanding <strong>of</strong> <strong>the</strong> incident that led to <strong>the</strong> filing <strong>of</strong> a misconduct complaint, and if possible,reach an agreement to resolve <strong>the</strong> conflict.Public Relations – informs and educates <strong>the</strong> public through outreach concerning OPC’s mission, authority, andprocesses to ensure that <strong>the</strong> agency's services can be fully accessed; performs liaison functions between <strong>the</strong> <strong>of</strong>fice,o<strong>the</strong>r District agencies, and <strong>the</strong> public.Policy Recommendation – proposes to <strong>the</strong> Mayor, District Council, and <strong>Chief</strong>s <strong>of</strong> Police for MPD and DCHAPDimprovements to those elements <strong>of</strong> management <strong>of</strong> <strong>the</strong> law enforcement agencies that affect <strong>the</strong> incidence <strong>of</strong> policemisconduct, such as recruitment, training, evaluation, discipline, and supervision <strong>of</strong> police <strong>of</strong>ficers.<strong>Agency</strong> Management – provides for administrative support and <strong>the</strong> required tools to achieve operational and programmaticresults. This program is standard for all agencies using performance-based budgeting.Program Structure ChangeThe <strong>Office</strong> <strong>of</strong> Police Complaints has no program structure changes in <strong>the</strong> FY 2013 proposed budget.<strong>Office</strong> <strong>of</strong> Police ComplaintsC-86FY 2013 Proposed <strong>Budget</strong> and <strong>Financial</strong> Plan
FY 2013 Proposed Operating <strong>Budget</strong> and FTEs, by Program and ActivityTable FH0-4 contains <strong>the</strong> proposed FY 2013 budget by program and activity compared to <strong>the</strong> FY 2012 approved budget.It also provides <strong>the</strong> FY 2011 actual data.Table FH0-4(dollars in thousands)Dollars in ThousandsFull-Time EquivalentsChangeChangeActual Approved Proposed from Actual Approved Proposed fromProgram/Activity FY 2011 FY 2012 FY 2013 FY 2012 FY 2011 FY 2012 FY 2013 FY 2012(1000) <strong>Agency</strong> Management Program(1015) Training and Employee Development 4 9 19 10 0.0 0.0 0.0 0.0(1030) Property Management 6 4 0 -4 0.0 0.0 0.0 0.0(1040) Information Technology 22 29 17 -12 0.0 0.0 0.0 0.0(1070) Fleet Management 1 2 1 -1 0.0 0.0 0.0 0.0(1085) Customer Service 97 99 43 -56 0.0 2.0 1.0 -1.0(1090) Performance Management 521 559 578 19 3.7 5.0 4.0 -1.0Subtotal (1000) <strong>Agency</strong> Management Program 651 701 658 -43 3.7 7.0 5.0 -2.0(2000) Complaint Resolution(2010) Investigation 877 1,053 1,116 63 15.4 13.5 15.5 2.0(2020) Adjudication 31 58 29 -29 0.0 0.0 0.0 0.0(2030) Mediation 3 6 48 42 0.0 0.0 0.0 0.0Subtotal (2000) Complaint Resolution 911 1,117 1,193 76 15.4 13.5 15.5 2.0(3000) Public Relations(3010) Outreach 70 70 84 14 0.9 1.0 1.2 0.2Subtotal (3000) Public Relations 70 70 84 14 0.9 1.0 1.2 0.2(4000) Policy Recommendation(4010) Policy Recommendation 139 162 156 -6 1.6 1.8 1.5 -0.2Subtotal (4000) Policy Recommendation 139 162 156 -6 1.6 1.8 1.5 -0.2Total Proposed Operating <strong>Budget</strong> 1,770 2,051 2,091 40 21.7 23.2 23.2 0.0(Change is calculated by whole numbers and numbers may not add up due to rounding)Note: For more detailed information regarding <strong>the</strong> proposed funding for <strong>the</strong> activities within this agency’s programs, please see Schedule 30-PBBProgram Summary by Activity in <strong>the</strong> FY 2013 Operating Appendices located on <strong>the</strong> <strong>Office</strong> <strong>of</strong> <strong>the</strong> <strong>Chief</strong> <strong>Financial</strong> <strong>Office</strong>r’s website.FY 2013 Proposed <strong>Budget</strong> and <strong>Financial</strong> Plan<strong>Office</strong> <strong>of</strong> Police ComplaintsC-87
FY 2013 Proposed <strong>Budget</strong> ChangesThe <strong>Office</strong> <strong>of</strong> Police Complaints’ (OPC) proposed FY 2013 gross budget is $2,091,473, which represents a 2.0percent increase over its FY 2012 approved gross budget <strong>of</strong> $2,051,138. The budget is comprised entirely <strong>of</strong> LocalFunds.Current Services Funding LevelThe Current Services Funding Level (CSFL) is a Local funds ONLY representation <strong>of</strong> <strong>the</strong> true cost <strong>of</strong> operatingDistrict agencies, before consideration <strong>of</strong> policy decisions. The CSFL reflects changes from <strong>the</strong> FY 2012 approvedbudget across multiple programs, and it estimates how much it would cost an agency to continue its current programsand operations into <strong>the</strong> following fiscal year. The initial adjustments in <strong>the</strong> budget proposal representchanges that should be compared to <strong>the</strong> FY 2013 CSFL budget and not necessarily changes made to <strong>the</strong> FY 2012Local funds budget. The FY 2013 CSFL adjustments to <strong>the</strong> FY 2012 Local funds budget are described in table 5<strong>of</strong> this agency's budget chapter. Please see <strong>the</strong> CSFL Development section within Volume 1: Executive Summaryfor more information regarding <strong>the</strong> methodology used and components that comprise <strong>the</strong> CSFL.OPC’s FY 2013 CSFL budget is $2,084,274, which represents a $33,136, or 1.6 percent, increase over <strong>the</strong> FY 2012approved Local funds budget <strong>of</strong> $2,051,138.Initial Adjusted <strong>Budget</strong>Cost Increase: In Local funds, OPC increased personal services by $4,304 due to projected increases in steps andFringe Benefits. The agency also established a $3,000 budget to cover Requests for Telecom Services (RTS) providedby <strong>the</strong> <strong>Office</strong> <strong>of</strong> <strong>the</strong> <strong>Chief</strong> Technology <strong>Office</strong>r (OCTO). Additionally, <strong>the</strong> agency increased its ContractualServices budget by $820 and Supplies by $478.Cost Decrease: In Local funds, reductions <strong>of</strong> $5,394 in O<strong>the</strong>r Services and Charges and $3,208 in Equipmentwere made to compensate for increased costs in personal services for salary, steps, and Fringe Benefits.Correct: In Local funds, OPC moved $96,334 and 2.0 full-time employee (FTE) positions from <strong>the</strong> <strong>Agency</strong>Management program to <strong>the</strong> Complaint Resolution program. This correction places <strong>the</strong> expenses within <strong>the</strong> programwhere <strong>the</strong> work was being performed by <strong>the</strong> two FTEs.Additionally Adjusted <strong>Budget</strong>Technical Adjustments: Adjustment <strong>of</strong> Fringe Benefits to restore <strong>the</strong> District Government contribution foremployee health insurance from 72 percent, implemented in <strong>the</strong> FY 2011 budget, to 75 percent in FY 2013, resultingin an increase <strong>of</strong> $7,199 to OPC’s Local funds.<strong>Office</strong> <strong>of</strong> Police ComplaintsC-88FY 2013 Proposed <strong>Budget</strong> and <strong>Financial</strong> Plan
FY 2012 Approved <strong>Budget</strong> to FY 2013 Proposed <strong>Budget</strong>, by Revenue TypeTable FH0-5 itemizes <strong>the</strong> changes by revenue type between <strong>the</strong> FY 2012 approved budget and <strong>the</strong> FY 2013 proposedbudget.Table FH0-5(dollars in thousands)PROGRAM BUDGET FTELOCAL FUNDS: FY 2012 Approved <strong>Budget</strong> and FTE 2,051 23.2Fringe Benefit Rate Adjustment Multiple Programs 21 0.0Consumer Price Index Multiple Programs 4 0.0Personal Services Growth Factor Multiple Programs 8 0.0FY 2013 Current Services Funding Level <strong>Budget</strong> (CSFL) 2,084 23.2Cost Increase: Adjustment for salary, step increases, andFringe Benefits costs Multiple Programs 4 0.0Cost Increase: Request for Telecommunication Service (RTS) fees <strong>Agency</strong> Management Program 3 0.0Cost Increase: Adjustment to Contractual Services Multiple Programs 1 0.0Cost Increase: Adjustment to Supplies (less than $500) Multiple Programs 0 0.0Cost Decrease: Adjustment to O<strong>the</strong>r Services and Charges Multiple Programs -5 0.0Cost Decrease: Adjustment to Equipment Multiple Programs -3 0.0Correct: FTEs from <strong>Agency</strong> Management Complaint Resolution 96 2.0Correct: FTEs moved to Complaint Resolution <strong>Agency</strong> Management Program -96 -2.0FY 2013 Initial Adjusted <strong>Budget</strong> 2,084 23.2Technical Adjustment: Health Care Contribution Multiple Programs 7 0.0FY 2013 Additionally Adjusted <strong>Budget</strong> 2,091 23.2LOCAL FUNDS: FY 2013 Proposed <strong>Budget</strong> and FTE 2,091 23.2Gross for FH0 - <strong>Office</strong> <strong>of</strong> Police Complaints 2,091 23.2(Change is calculated by whole numbers and numbers may not add up due to rounding)FY 2013 Proposed <strong>Budget</strong> and <strong>Financial</strong> Plan<strong>Office</strong> <strong>of</strong> Police ComplaintsC-89
<strong>Agency</strong> Performance PlanThe agency’s performance plan has <strong>the</strong> following objectives for FY 2013:Objective 1: Resolve police misconduct complaints in an impartial, timely, and pr<strong>of</strong>essional manner.Objective 2: Promote positive community-police interactions through public education and awareness.Objective 3: Enhance OPC’s ability to effect police reform by issuing policy recommendations to <strong>the</strong> Mayor, <strong>the</strong>District Council, MPD, and DCHA.<strong>Agency</strong> Performance MeasuresFY 2010 FY 2011 FY 2012 FY 2013 FY 2014Measure Actual Actual Projection Projection ProjectionPercent <strong>of</strong> investigations completed and reportsproduced by <strong>the</strong> agency within six months. 65.73% 57.14% 75% 75% 75%Percent <strong>of</strong> Complaint Examiner decisions issuedwithin 120 days. 81.82% 42.86% 90% 90% 90%Percent <strong>of</strong> complaints resolved through mediation. 1 9.03% 8.70% 9% 9% 9%Number <strong>of</strong> outreach activities sponsored or attendedby OPC. 24 24 24 24 24Performance Plan Endnotes:1. This Key Performance Indicator is also an industry measure. In assessing <strong>the</strong> effectiveness <strong>of</strong> mediation programs used bydifferent police oversight agencies, experts in <strong>the</strong> field consider <strong>the</strong> percentage <strong>of</strong> all complaints that were successfully mediatedby an oversight agency. See Samuel Walker, Carol Archbold, and Leigh Herbst, Mediating Citizen Complaints Against Police<strong>Office</strong>rs: A Guide for Police and Community Leaders, U.S. Department <strong>of</strong> Justice, <strong>Office</strong> <strong>of</strong> Community Oriented Policing Servicesat 40 (2002). With 9.03 percent <strong>of</strong> its complaints resolved through mediation in FY 2010, OPC’s performance places it at or near<strong>the</strong> top when compared to o<strong>the</strong>r mediation programs in <strong>the</strong> United States.<strong>Office</strong> <strong>of</strong> Police ComplaintsC-90FY 2013 Proposed <strong>Budget</strong> and <strong>Financial</strong> Plan
District <strong>of</strong> Columbia Sentencing andCriminal Code Revision Commissionwww.scdc.dc.govTelephone: 202-727-8822(FZ0)% ChangeFY 2011 FY 2012 FY 2013 fromDescription Actual Approved Proposed FY 2012Operating <strong>Budget</strong> $630,247 $887,659 $1,388,813 56.5FTEs 6.8 8.0 10.0 25.0The mission <strong>of</strong> <strong>the</strong> District <strong>of</strong> Columbia Sentencing and CriminalCode Revision Commission (SCCRC) is to implement, monitor, andsupport <strong>the</strong> District's voluntary sentencing guidelines, to promote fairand consistent sentencing policies, to increase public understanding <strong>of</strong>sentencing policies and practices, and to evaluate <strong>the</strong> effectiveness <strong>of</strong><strong>the</strong> guidelines system in order to recommend changes based on actualsentencing and corrections practice and research.Summary <strong>of</strong> ServicesSCCRC advises <strong>the</strong> District <strong>of</strong> Columbia on matters related to criminal law, sentencing, and corrections policy. TheSentencing and Criminal Code Revision Commission Amendment Act <strong>of</strong> 2007 established permanent, voluntaryfelony sentencing guidelines, and requires <strong>the</strong> commission to monitor those guidelines and make adjustments to<strong>the</strong>m as needed to promote sentencing policies that limit unwarranted disparity while allowing adequate judicial discretionand proportionality. The sentencing guidelines provide recommended sentences that enhance fairness so that<strong>of</strong>fenders, victims, <strong>the</strong> community, and all parties will understand <strong>the</strong> sentence, and sentences will be both more predictableand consistent. The Commission provides analysis <strong>of</strong> sentencing trends and guideline compliance to <strong>the</strong>public and its representatives to assist in identifying sentencing patterns <strong>of</strong> felony convictions. In addition, <strong>the</strong>Advisory Commission on Sentencing Amendment Act <strong>of</strong> 2006 requires <strong>the</strong> commission to conduct a multi-yearstudy <strong>of</strong> <strong>the</strong> District’s Criminal Code reform, including analysis <strong>of</strong> current criminal statutes and <strong>the</strong> development <strong>of</strong>recommendations that reorganize and reformulate for <strong>the</strong> District’s Criminal Code.The agency’s FY 2013 proposed budget is presented in <strong>the</strong> following tables:FY 2013 Proposed <strong>Budget</strong> and <strong>Financial</strong> PlanDistrict <strong>of</strong> Columbia Sentencing and Criminal Code Revision CommissionC-91
FY 2013 Proposed Gross Funds Operating <strong>Budget</strong>, by Revenue TypeTable FZ0-1 contains <strong>the</strong> proposed FY 2013 agency budget compared to <strong>the</strong> FY 2012 approved budget. It alsoprovides FY 2010 and FY 2011 actual expenditures.Table FZ0-1(dollars in thousands)ChangeActual Actual Approved Proposed from PercentAppropriated Fund FY 2010 FY 2011 FY 2012 FY 2013 FY 2012 Change*General FundLocal Funds 794 630 888 1,389 501 56.5Total for General Fund 794 630 888 1,389 501 56.5Gross Funds 794 630 888 1,389 501 56.5*Percent change is based on whole dollars.Note: If applicable, for a breakdown <strong>of</strong> each Grant (Federal and Private), Special Purpose Revenue type and Intra-District agreement,please refer to Schedule 80 <strong>Agency</strong> Summary by Revenue Source in <strong>the</strong> FY 2013 Operating Appendices located on <strong>the</strong> <strong>Office</strong> <strong>of</strong> <strong>the</strong><strong>Chief</strong> <strong>Financial</strong> <strong>Office</strong>r’s website.FY 2013 Proposed Full-Time Equivalents, by Revenue TypeTable FZ0-2 contains <strong>the</strong> proposed FY 2013 FTE level compared to <strong>the</strong> FY 2012 approved FTE level by revenuetype. It also provides FY 2010 and FY 2011 actual data.Table FZ0-2ChangeActual Actual Approved Proposed from PercentAppropriated Fund FY 2010 FY 2011 FY 2012 FY 2013 FY 2012 ChangeGeneral FundLocal Funds 6.4 6.8 8.0 10.0 2.0 25.0Total for General Fund 6.4 6.8 8.0 10.0 2.0 25.0Total Proposed FTEs 6.4 6.8 8.0 10.0 2.0 25.0District <strong>of</strong> Columbia Sentencing and Criminal Code Revision CommissionC-92FY 2013 Proposed <strong>Budget</strong> and <strong>Financial</strong> Plan
FY 2013 Proposed Operating <strong>Budget</strong>, by Comptroller Source GroupTable FZ0-3 contains <strong>the</strong> proposed FY 2013 budget at <strong>the</strong> Comptroller Source Group (object class) level comparedto <strong>the</strong> FY 2012 approved budget. It also provides FY 2010 and FY 2011 actual expenditures.Table FZ0-3(dollars in thousands)ChangeActual Actual Approved Proposed from PercentComptroller Source Group FY 2010 FY 2011 FY 2012 FY 2013 FY 2012 Change*11 - Regular Pay - Continuing Full Time 392 349 495 807 312 62.912 - Regular Pay - O<strong>the</strong>r 71 74 0 0 0 -100.013 - Additional Gross Pay 1 5 16 16 0 0.014 - Fringe Benefits - Current Personnel 70 80 127 231 104 81.915 - Overtime Pay 1 1 0 0 0 N/ASubtotal Personal Services (PS) 536 509 638 1,054 416 65.120 - Supplies and Materials 16 6 9 13 4 41.730 - Energy, Comm. and Building Rentals 12 0 0 0 0 N/A31 - Telephone, Telegraph, Telegram, Etc. 2 1 0 0 0 N/A34 - Security Services 3 0 0 0 0 N/A35 - Occupancy Fixed Costs 3 0 0 0 0 N/A40 - O<strong>the</strong>r Services and Charges 57 37 97 110 13 13.041 - Contractual Services - O<strong>the</strong>r 156 77 133 201 69 51.970 - Equipment and Equipment Rental 9 1 10 10 0 2.0Subtotal Nonpersonal Services (NPS) 258 121 249 335 86 34.3Gross Funds 794 630 888 1,389 501 56.5*Percent change is based on whole dollars.Program DescriptionThe District <strong>of</strong> Columbia Sentencing and Criminal Code Revision Commission operates through <strong>the</strong> following 2programs:Data Collection, Analysis, and Implementation – produces sentencing research for <strong>the</strong> Commission and <strong>the</strong>Council; monitors and evaluates sentencing practices in <strong>the</strong> District; and provides guideline manuals, a guidelinehotline, and training for criminal justice personnel to effectively and efficiently work within a structuredsentencing system.This program contains <strong>the</strong> following 5 activities:■ ACS Offense and Offender Database – transfers data electronically from <strong>the</strong> court to incorporate <strong>the</strong> data into<strong>the</strong> agency's database, which includes both historic and real-time sentencing information. The criminalhistory information is provided by Court Services and Offender Supervision <strong>Agency</strong> (CSOSA) and is integratedinto <strong>the</strong> agency’s database, also enabling sentencing trends, <strong>of</strong>fender and <strong>of</strong>fense based analysis <strong>of</strong> <strong>the</strong> application<strong>of</strong> <strong>the</strong> sentencing guidelines;■ Sentencing Guidelines Monitoring – monitors compliance with <strong>the</strong> recommended sentencing guidelines byusing <strong>the</strong> agency’s database. Departures from <strong>the</strong> sentencing guidelines are examined to determine if <strong>the</strong> guidelinesmay require modification or revision by <strong>the</strong> Commission to ensure <strong>the</strong>ir effectiveness;FY 2013 Proposed <strong>Budget</strong> and <strong>Financial</strong> PlanDistrict <strong>of</strong> Columbia Sentencing and Criminal Code Revision CommissionC-93
■■■Policy Reports and Proposals – prepares reports and recommendations to <strong>the</strong> Commission to improve andexpand criminal justice programs related to sentencing policy when requested or necessary;Sentencing Guidelines Training – provides training to criminal justice pr<strong>of</strong>essionals focusing on <strong>the</strong> calculation<strong>of</strong> criminal history, proper application <strong>of</strong> <strong>the</strong> guidelines, determination <strong>of</strong> <strong>the</strong> recommended guideline sentence,and recent revisions or modification to <strong>the</strong> sentencing guidelines. The Commission also monitors bothAppellate and Supreme Court sentencing-related decisions and provides training on <strong>the</strong> impact <strong>of</strong> <strong>the</strong>se rulingson <strong>the</strong> D.C. Sentencing Guidelines; andPrep Sentencing Guidelines Materials – develops and updates yearly <strong>the</strong> D.C. Sentencing Guideline manual,which contains <strong>of</strong>fense rankings, sentencing protocol, special sentencing provisions, and o<strong>the</strong>r guidelinerelatedinformation. The Guideline manual is used by practitioners on a daily basis when applying <strong>the</strong> guidelinesto felony convictions.<strong>Agency</strong> Management – provides for administrative support and <strong>the</strong> required tools to achieve operational andprogrammatic results. This program is standard for all agencies using performance-based budgeting.Program Structure ChangeThe District <strong>of</strong> Columbia Sentencing and Criminal Code Revision Commission has no program structure changesin <strong>the</strong> FY 2013 proposed budget.FY 2013 Proposed Operating <strong>Budget</strong> and FTEs, by Program and ActivityTable FZ0-4 contains <strong>the</strong> proposed FY 2013 budget by program and activity compared to <strong>the</strong> FY 2012 approved budget.It also provides <strong>the</strong> FY 2011 actual data.Table FZ0-4(dollars in thousands)Dollars in ThousandsFull-Time EquivalentsChangeChangeActual Approved Proposed from Actual Approved Proposed fromProgram/Activity FY 2011 FY 2012 FY 2013 FY 2012 FY 2011 FY 2012 FY 2013 FY 2012(1000) Management(1010) Personnel 64 68 74 5 0.8 1.0 1.0 0.0(1015) Training 0 10 11 0 0.0 0.0 0.0 0.0(1017) Labor Management Partnerships 0 10 10 0 0.0 0.0 0.0 0.0(1030) Property Management 1 3 3 0 0.0 0.0 0.0 0.0(1040) Information Technology 13 68 66 -2 0.0 0.0 0.0 0.0(1060) Legal Services 186 286 692 406 3.4 4.0 6.0 2.0No Activity Assigned 28 0 0 0 0.0 0.0 0.0 0.0Subtotal (1000) Management 292 445 855 409 4.2 5.0 7.0 2.0(2000) Data Collection (AIP)(2010) ACS Offense and Offender Database 59 75 79 4 0.8 1.0 1.0 0.0(2020) Sentencing Guidelines Monitoring 77 133 201 69 0.0 0.0 0.0 0.0(2040) Policy Reports and Proposals 146 163 181 19 0.8 1.0 1.0 0.0(2050) Sentencing Guidelines Training 0 9 9 0 0.0 0.0 0.0 0.0(2060) Prep Sentencing Guidelines Materials 57 63 64 1 0.8 1.0 1.0 0.0Subtotal (2000) Data Collection (AIP) 338 442 534 92 2.6 3.0 3.0 0.0Total Proposed Operating <strong>Budget</strong> 630 888 1,389 501 6.8 8.0 10.0 2.0(Change is calculated by whole numbers and numbers may not add up due to rounding)Note: For more detailed information regarding <strong>the</strong> proposed funding for <strong>the</strong> activities within this agency’s programs, please see Schedule 30-PBBProgram Summary by Activity in <strong>the</strong> FY 2013 Operating Appendices located on <strong>the</strong> <strong>Office</strong> <strong>of</strong> <strong>the</strong> <strong>Chief</strong> <strong>Financial</strong> <strong>Office</strong>r’s website.District <strong>of</strong> Columbia Sentencing and Criminal Code Revision CommissionC-94FY 2013 Proposed <strong>Budget</strong> and <strong>Financial</strong> Plan
FY 2013 Proposed <strong>Budget</strong> ChangesThe District <strong>of</strong> Columbia Sentencing and Criminal Code Revision Commission’s (SCCRC) proposed FY 2013gross budget is $1,388,813, which represents a 56.5 percent increase over its FY 2012 approved gross budget <strong>of</strong>$887,659. The budget is comprised entirely <strong>of</strong> Local funds.Current Services Funding LevelThe Current Services Funding Level (CSFL) is a Local funds ONLY representation <strong>of</strong> <strong>the</strong> true cost <strong>of</strong> operatingDistrict agencies, before consideration <strong>of</strong> policy decisions. The CSFL reflects changes from <strong>the</strong> FY 2012 approvedbudget across multiple programs, and it estimates how much it would cost an agency to continue its currentprograms and operations into <strong>the</strong> following fiscal year. The initial adjustments in <strong>the</strong> budget proposal representchanges that should be compared to <strong>the</strong> FY 2013 CSFL budget and not necessarily changes made to <strong>the</strong> FY 2012Local funds budget. The FY 2013 CSFL adjustments to <strong>the</strong> FY 2012 Local funds budget are described in table 5<strong>of</strong> this agency's budget chapter. Please see <strong>the</strong> CSFL Development section within Volume 1: Executive Summaryfor more information regarding <strong>the</strong> methodology used and components that comprise <strong>the</strong> CSFL.SCCRC’s FY 2013 CSFL budget is $904,015, which represents a $16,356, or 1.8 percent, increase over <strong>the</strong>FY 2012 approved Local funds budget <strong>of</strong> $887,659.Initial Adjusted <strong>Budget</strong>Cost Increase: $82,087 in Contractual Services to support <strong>the</strong> Data Collection program.Cost Decrease: $82,087 in personal services and 2.0 FTEs were reduced to <strong>of</strong>fset <strong>the</strong> increase in ContractualServices.Additional Adjusted <strong>Budget</strong>Technical Adjustment: Adjustment <strong>of</strong> Fringe Benefits to restore <strong>the</strong> District Government contribution foremployee health insurance from 72 percent, implemented in <strong>the</strong> FY 2011 budget, to 75 percent in FY 2013,resulting in an increase <strong>of</strong> $2,615.Policy InitiativeCost Increase: $482,183 and 4.0 FTEs to provide additional operational support.FY 2013 Proposed <strong>Budget</strong> and <strong>Financial</strong> PlanDistrict <strong>of</strong> Columbia Sentencing and Criminal Code Revision CommissionC-95
FY 2012 Approved <strong>Budget</strong> to FY 2013 Proposed <strong>Budget</strong>, by Revenue TypeTable FZ0-5 itemizes <strong>the</strong> changes by revenue type between <strong>the</strong> FY 2012 approved budget and <strong>the</strong> FY 2013 proposedbudget.Table FZ0-5(dollars in thousands)PROGRAM BUDGET FTELOCAL FUNDS: FY 2012 Approved <strong>Budget</strong> and FTE 888 8.0Fringe Benefit Rate Adjustment Multiple Programs 9 0.0Consumer Price Index Multiple Programs 5 0.0Personal Services Growth Factor Multiple Programs 2 0.0FY 2013 Current Services Funding Level <strong>Budget</strong> (CSFL) 904 8.0Cost Increase: In Contractual Services Data Collection (AIP) 82 0.0Cost Decrease: In personal services Management -82 -2.0FY 2013 Initial Adjusted <strong>Budget</strong> 904 6.0Technical Adjustment: Health insurance contribution Multiple Programs 3 0.0FY 2013 Additionally Adjusted <strong>Budget</strong> 907 6.0FY 2013 Policy InitiativeCost Increase: In personal services Management 482 4.0LOCAL FUNDS: FY 2013 Proposed <strong>Budget</strong> and FTE 1,389 10.0Gross for FZ0 - District <strong>of</strong> Columbia Sentencing and Criminal Code Revision Commission 1,389 10.0(Change is calculated by whole numbers and numbers may not add up due to rounding)District <strong>of</strong> Columbia Sentencing and Criminal Code Revision CommissionC-96FY 2013 Proposed <strong>Budget</strong> and <strong>Financial</strong> Plan
<strong>Agency</strong> Performance PlanThe agency’s performance plan has <strong>the</strong> following objectives for FY 2013:Objective 1: Promulgate <strong>the</strong> accurate, timely, and effective use <strong>of</strong> <strong>the</strong> sentencing guidelines in every felony case.Objective 2: Promulgate compliance with <strong>the</strong> guidelines in at least 85 percent <strong>of</strong> all felony cases.Objective 3: Analyze <strong>the</strong> District <strong>of</strong> Columbia’s current criminal code and propose reforms in <strong>the</strong> criminal codeto create a uniform and coherent body <strong>of</strong> criminal law in <strong>the</strong> District <strong>of</strong> Columbia.<strong>Agency</strong> Performance MeasuresFY 2010 FY 2011 FY 2011 FY 2012 FY 2013 FY 2014Measure Actual Target Actual Projection Projection ProjectionPercentage <strong>of</strong> Judicial Compliance with <strong>the</strong>D.C. Sentencing Guidelines 1 88% 86% 90% 90% 92% NotAvailableResponse Rate for Departure Reasons 20% 40% 52% 55% 60% NotAvailablePercentage <strong>of</strong> guidelines questions answered within24 hours 87% 80% 98% 95% 95% NotAvailableNumber <strong>of</strong> issue papers released 2 4 3 2 2 NotAvailablePerformance Plan Endnotes:1. Judicial Compliance is considered an Industry Standard measure among Sentencing Commissions and a measure <strong>of</strong> <strong>the</strong> extentto which judges follow <strong>the</strong> sentencing guidelines when imposing a felony sentence. Compliance is defined as a judge imposinga sentence that is within <strong>the</strong> range recommended by <strong>the</strong> sentencing guidelines given <strong>the</strong> defendant’s current <strong>of</strong>fense and priorcriminal history. The National Association <strong>of</strong> Sentencing Commissions identifies 80 percent compliance as standard, indicating<strong>the</strong> imposition <strong>of</strong> judicial discretion in 20 percent <strong>of</strong> cases.FY 2013 Proposed <strong>Budget</strong> and <strong>Financial</strong> PlanDistrict <strong>of</strong> Columbia Sentencing and Criminal Code Revision CommissionC-97
<strong>Office</strong> <strong>of</strong> <strong>the</strong><strong>Chief</strong> Medical Examiner(FX0)www.ocme.dc.govTelephone: 202-698-9000% ChangeFY 2011 FY 2012 FY 2013 fromDescription Actual Approved Proposed FY 2012Operating <strong>Budget</strong> $7,248,815 $7,659,313 $7,924,365 3.5FTEs 66.0 68.0 69.0 1.5The mission <strong>of</strong> <strong>the</strong> <strong>Office</strong> <strong>of</strong> <strong>Chief</strong> Medical Examiner (OCME) is toensure that justice is served and that <strong>the</strong> health and safety <strong>of</strong> <strong>the</strong> publicis improved by conducting quality death investigations and certification,and providing forensic services for government agencies, healthcare entities, and grieving families.Summary <strong>of</strong> ServicesOCME provides forensic services to local and federal government agencies, health care providers, institutions <strong>of</strong>higher learning, and citizens in <strong>the</strong> District and metropolitan area. Forensic services include: forensic investigation<strong>of</strong> certain deaths, those occurring as a result <strong>of</strong> violence (injury), as well as those that occur unexpectedly, withoutmedical attention, in custody, or pose a threat to public health; review <strong>of</strong> deaths <strong>of</strong> specific populations; grief counseling;performance <strong>of</strong> a full range <strong>of</strong> toxicological examinations; cremation approvals; and public disposition <strong>of</strong>unclaimed remains.The agency’s FY 2013 proposed budget is presented in <strong>the</strong> following tables:FY 2013 Proposed <strong>Budget</strong> and <strong>Financial</strong> Plan<strong>Office</strong> <strong>of</strong> <strong>the</strong> <strong>Chief</strong> Medical ExaminerC-99
FY 2013 Proposed Gross Funds Operating <strong>Budget</strong>, by Revenue TypeTable FX0-1 contains <strong>the</strong> proposed FY 2013 agency budget compared to <strong>the</strong> FY 2012 approved budget. It alsoprovides FY 2010 and FY 2011 actual expenditures.Table FX0-1(dollars in thousands)ChangeActual Actual Approved Proposed from PercentAppropriated Fund FY 2010 FY 2011 FY 2012 FY 2013 FY 2012 Change*General FundLocal Funds 8,074 6,923 7,569 7,834 265 3.5Special Purpose Revenue Funds 251 230 0 0 0 N/ATotal for General Fund 8,325 7,154 7,569 7,834 265 3.5Intra-District FundsIntra-District Funds 83 95 90 90 0 0.0Total for Intra-District Funds 83 95 90 90 0 0.0Gross Funds 8,407 7,249 7,659 7,924 265 3.5*Percent change is based on whole dollars.Note: If applicable, for a breakdown <strong>of</strong> each Grant (Federal and Private), Special Purpose Revenue type and Intra-District agreement, please refer toSchedule 80 <strong>Agency</strong> Summary by Revenue Source in <strong>the</strong> FY 2013 Operating Appendices located on <strong>the</strong> <strong>Office</strong> <strong>of</strong> <strong>the</strong> <strong>Chief</strong> <strong>Financial</strong> <strong>Office</strong>r’s website.FY 2013 Proposed Full-Time Equivalents, by Revenue TypeTable FX0-2 contains <strong>the</strong> proposed FY 2013 FTE level compared to <strong>the</strong> FY 2012 approved FTE level by revenuetype. It also provides FY 2010 and FY 2011 actual data.Table FX0-2ChangeActual Actual Approved Proposed from PercentAppropriated Fund FY 2010 FY 2011 FY 2012 FY 2013 FY 2012 ChangeGeneral FundLocal Funds 70.4 64.7 68.0 69.0 1.0 1.5Special Purpose Revenue Funds 1.8 1.2 0.0 0.0 0.0 N/ATotal for General Fund 72.2 66.0 68.0 69.0 1.0 1.5Total Proposed FTEs 72.2 66.0 68.0 69.0 1.0 1.5<strong>Office</strong> <strong>of</strong> <strong>the</strong> <strong>Chief</strong> Medical ExaminerC-100FY 2013 Proposed <strong>Budget</strong> and <strong>Financial</strong> Plan
FY 2013 Proposed Operating <strong>Budget</strong>, by Comptroller Source GroupTable FX0-3 contains <strong>the</strong> proposed FY 2013 budget at <strong>the</strong> Comptroller Source Group (object class) level comparedto <strong>the</strong> FY 2012 approved budget. It also provides FY 2010 and FY 2011 actual expenditures.Table FX0-3(dollars in thousands)ChangeActual Actual Approved Proposed from PercentComptroller Source Group FY 2010 FY 2011 FY 2012 FY 2013 FY 2012 Change*11 - Regular Pay - Continuing Full Time 4,814 4,813 5,092 5,373 281 5.512 - Regular Pay - O<strong>the</strong>r 311 210 185 185 0 0.013 - Additional Gross Pay 382 332 301 314 13 4.314 - Fringe Benefits - Current Personnel 1,066 997 1,119 1,403 284 25.415 - Overtime Pay 90 52 70 52 -18 -25.7Subtotal personal services (PS) 6,663 6,405 6,767 7,327 560 8.320 - Supplies and Materials 197 174 181 137 -45 -24.630 - Energy, Comm. and Building Rentals 195 0 0 0 0 N/A31 - Telephone, Telegraph, Telegram, Etc. 43 0 0 0 0 N/A33 - Janitorial Services 91 0 0 0 0 N/A34 - Security Services 25 0 0 0 0 N/A35 - Occupancy Fixed Costs 175 -5 0 0 0 N/A40 - O<strong>the</strong>r Services and Charges 566 519 514 392 -121 -23.641 - Contractual Services - O<strong>the</strong>r 376 143 69 69 0 0.070 - Equipment and Equipment Rental 76 13 129 0 -129 -100.0Subtotal Nonpersonal Services (NPS) 1,744 843 892 597 -295 -33.1Gross Funds 8,407 7,249 7,659 7,924 265 3.5*Percent change is based on whole dollars.Division DescriptionThe <strong>Office</strong> <strong>of</strong> <strong>the</strong> <strong>Chief</strong> Medical Examiner operates through <strong>the</strong> following 5 divisions:Death Investigations and Certification – is responsible for forensic pathology, forensic investigation, and forensicsupport services. Forensic pathology involves conducting decedent examination, determining <strong>the</strong> cause and manner<strong>of</strong> death and providing that information to next <strong>of</strong> kin, law enforcement, designated government entities, andinterested parties. Forensic investigation includes evidence-ga<strong>the</strong>ring, medical interpretation, and provision <strong>of</strong> informationto aid in <strong>the</strong> determination <strong>of</strong> <strong>the</strong> cause and manner <strong>of</strong> death. The purpose <strong>of</strong> forensic support services isto provide body disposition and autopsy support to forensic pathology staff and <strong>the</strong> funeral industry.This division contains <strong>the</strong> following 3 activities:■ Forensic Pathology – provides in a timely manner decedent external and/or internal examination, documentation(i.e., medical transcription), and analysis services to law enforcement, government agencies, interestedparties, and families to determine and understand <strong>the</strong> cause and manner <strong>of</strong> death;FY 2013 Proposed <strong>Budget</strong> and <strong>Financial</strong> Plan<strong>Office</strong> <strong>of</strong> <strong>the</strong> <strong>Chief</strong> Medical ExaminerC-101
■■Forensic Investigations – provides information, evidence ga<strong>the</strong>ring, and medical interpretation services toOCME, law enforcement agencies, legal counsel, and <strong>the</strong> community to identify decedents and determine <strong>the</strong>cause and manner <strong>of</strong> death; andForensic Support Services – provides body disposition and autopsy support services to OCME, <strong>the</strong> funeralindustry, and <strong>the</strong> public so that <strong>the</strong>y can have a body that is properly prepared for autopsy or disposition in atimely manner.Forensic Toxicology – maintains standards <strong>of</strong> practice for <strong>the</strong> detection, identification and quantization <strong>of</strong> alcohol,drugs, and o<strong>the</strong>r toxins in biological specimens. The laboratory provides scientific support services to OCME inorder that <strong>the</strong> agency may provide accurate death investigation information in a timely manner to <strong>the</strong> next <strong>of</strong> kin,law enforcement agencies, legal counsel, and <strong>the</strong> community when required. It also provides services to variousexternal government entities regarding specified types <strong>of</strong> testing.Fatality Review – responsible for reviewing <strong>the</strong> circumstances <strong>of</strong> <strong>the</strong> deaths <strong>of</strong> individuals within certain populations,including <strong>the</strong>ir interaction with District government services. The purpose <strong>of</strong> <strong>the</strong> reviews is to provideanalysis and recommendations to <strong>the</strong> public and District entities serving defined populations so that <strong>the</strong>y canaddress systemic problems and provide better services.Administrative/<strong>Agency</strong> Management – provides for administrative support and <strong>the</strong> required tools to achieve operationaland programmatic results. This division is standard for all agencies using performance-based budgeting.<strong>Agency</strong> <strong>Financial</strong> Operations – provides comprehensive and efficient financial management services to, and onbehalf <strong>of</strong>, <strong>the</strong> District agencies so that <strong>the</strong> financial integrity <strong>of</strong> <strong>the</strong> District <strong>of</strong> Columbia is maintained. This divisionis standard for all agencies using performance-based budgeting.Division Structure ChangeThe <strong>Office</strong> <strong>of</strong> <strong>the</strong> <strong>Chief</strong> Medical Examiner has no division structure changes in <strong>the</strong> FY 2013 proposed budget.<strong>Office</strong> <strong>of</strong> <strong>the</strong> <strong>Chief</strong> Medical ExaminerC-102FY 2013 Proposed <strong>Budget</strong> and <strong>Financial</strong> Plan
FY 2013 Proposed Operating <strong>Budget</strong> and FTEs, by Division and ActivityTable FX0-4 contains <strong>the</strong> proposed FY 2013 budget by division and activity compared to <strong>the</strong> FY 2012 approved budget.It also provides <strong>the</strong> FY 2011 actual data.Table FX0-4(dollars in thousands)Dollars in ThousandsFull-Time EquivalentsChangeChangeActual Approved Proposed from Actual Approved Proposed fromDivision/Activity FY 2011 FY 2012 FY 2013 FY 2012 FY 2011 FY 2012 FY 2013 FY 2012(1000) Administrative Management Program(1010) Personnel 154 173 189 16 1.9 2.0 2.0 0.0(1020) Training 278 298 251 -47 3.8 4.0 3.0 -1.0(1030) Property Management 7 6 0 -6 0.0 0.0 0.0 0.0(1040) Information Technology 385 461 387 -74 2.9 3.0 3.0 0.0(1050) <strong>Financial</strong> Management (2) 0 0 0 0.0 0.0 0.0 0.0(1070) Fleet Management 42 39 28 -11 0.0 0.0 0.0 0.0(1080) Communciations (4) 29 0 -29 0.0 0.0 0.0 0.0(1085) Customer Service 172 181 199 18 2.9 3.0 3.0 0.0(1090) Performance Management 697 725 704 -22 5.7 6.0 5.0 -1.0Subtotal (1000) Administrative Management Program 1,731 1,913 1,758 -155 17.1 18.0 16.0 -2.0(100F) <strong>Agency</strong> <strong>Financial</strong> Operation(110F) <strong>Budget</strong> Operations 118 121 126 5 1.0 1.0 1.0 0.0Subtotal (100F) <strong>Agency</strong> <strong>Financial</strong> Operation 118 121 126 5 1.0 1.0 1.0 0.0(2000) Death Investigations/ Certifications(2100) Forsenic Pathology 1,567 1,680 1,748 68 8.6 9.0 9.0 0.0(2200) Forsenic Investigations 1,482 1,669 1,759 89 15.2 16.0 17.0 1.0(2300) Mortuary Services 23 0 0 0 0.0 0.0 0.0 0.0(2301) Forensic Support Services 1,146 1,070 1,090 21 11.7 12.0 12.0 0.0(2400) Laboratory Services (10) 0 0 0 0.0 0.0 0.0 0.0Subtotal (2000) Death Investigations/ Certifications 4,209 4,420 4,597 178 35.5 37.0 38.0 1.0(3000) Fatality Review Committees(3100) Child Fatality Review Committee 294 295 316 21 2.9 3.0 3.0 0.0Subtotal (3000) Fatality Review Committees 294 295 316 21 2.9 3.0 3.0 0.0(4000) Forensic Toxicology(4100) Forensic Toxicology Lab 897 910 1,126 216 9.5 9.0 11.0 2.0Subtotal (4000) Forensic Toxicology 897 910 1,126 216 9.5 9.0 11.0 2.0Total Proposed Operating <strong>Budget</strong> 7,249 7,659 7,924 265 66.0 68.0 69.0 1.0(Change is calculated by whole numbers and numbers may not add up due to rounding)Note: For more detailed information regarding <strong>the</strong> proposed funding for <strong>the</strong> activities within this agency’s divisions, please see Schedule 30-PBBProgram Summary by Activity in <strong>the</strong> FY 2013 Operating Appendices located on <strong>the</strong> <strong>Office</strong> <strong>of</strong> <strong>the</strong> <strong>Chief</strong> <strong>Financial</strong> <strong>Office</strong>r’s website.FY 2013 Proposed <strong>Budget</strong> and <strong>Financial</strong> Plan<strong>Office</strong> <strong>of</strong> <strong>the</strong> <strong>Chief</strong> Medical ExaminerC-103
FY 2013 Proposed <strong>Budget</strong> ChangesThe <strong>Office</strong> <strong>of</strong> <strong>the</strong> <strong>Chief</strong> Medical Examiner’s (OCME) proposed FY 2013 gross budget is $7,924,365, which representsa 3.5 percent increase over its FY 2012 approved gross budget $7,659,313. The budget is comprised <strong>of</strong>$7,834,365 in Local funds and $90,000 in Intra-District funds.Current Services Funding LevelThe Current Services Funding Level (CSFL) is a Local funds ONLY representation <strong>of</strong> <strong>the</strong> true cost <strong>of</strong> operatingDistrict agencies, before consideration <strong>of</strong> policy decisions. The CSFL reflects changes from <strong>the</strong> FY 2012 approvedbudget across multiple programs, and it estimates how much it would cost an agency to continue its current programsand operations into <strong>the</strong> following fiscal year. The initial adjustments in <strong>the</strong> budget proposal representchanges that should be compared to <strong>the</strong> FY 2013 CSFL budget and not necessarily changes made to <strong>the</strong> FY 2012Local funds budget. The FY 2013 CSFL adjustments to <strong>the</strong> FY 2012 Local funds budget are described in table 5<strong>of</strong> this agency's budget chapter. Please see <strong>the</strong> CSFL Development section within Volume 1: Executive Summaryfor more information regarding <strong>the</strong> methodology used and components that comprise <strong>the</strong> CSFL.OCME’s FY 2013 CSFL budget is $7,591,304, which represents a $21,999 or 0.3 percent, increase over <strong>the</strong>FY 2012 approved Local funds budget <strong>of</strong> $7,569,313.Initial Adjusted <strong>Budget</strong>Cost Increase: $111,000 in <strong>the</strong> Forensic Toxicology program, $81,000 in <strong>the</strong> Death Investigations andCertification program, and $14,000 in <strong>the</strong> Child Fatality Review Committee program for projected step and FringeBenefit costs.Cost Decrease: $1,371 in Contractual Services - O<strong>the</strong>r, $26,491 in Equipment and Equipment Rental, $48,204in Supplies and Materials, and $129,934 in O<strong>the</strong>r Services and Charges to <strong>of</strong>fset cost increases in personal services.Initial Adjusted <strong>Budget</strong>Technical Adjustment: Adjustment <strong>of</strong> Fringe Benefits to restore a 72 percent District Government contributionfor employee health insurance from 72 percent implemented in <strong>the</strong> FY 2011 budget, to 75 percent in FY 2013,which resulted in an increase <strong>of</strong> $27,264 in Local funds.Policy InitiativesCost Increase: Local funds were increased by $215,795 in personal services, <strong>of</strong> which $112,500 is for <strong>the</strong> <strong>Chief</strong>Toxicologist position and $103,295 is for union pay differential.<strong>Office</strong> <strong>of</strong> <strong>the</strong> <strong>Chief</strong> Medical ExaminerC-104FY 2013 Proposed <strong>Budget</strong> and <strong>Financial</strong> Plan
FY 2012 Approved <strong>Budget</strong> to FY 2013 Proposed <strong>Budget</strong>, by Revenue TypeTable FX0-5 itemizes <strong>the</strong> changes by revenue type between <strong>the</strong> FY 2012 approved budget and <strong>the</strong> FY 2013 proposedbudget.Table FX0-5(dollars in thousands)PROGRAM BUDGET FTELOCAL FUNDS: FY 2012 Approved <strong>Budget</strong> and FTE 7,569 68.0Removal <strong>of</strong> One-time Funding Multiple Programs -129 0.0Recurring <strong>Budget</strong> Items Multiple Programs 33 0.0Fringe Benefit Rate Adjustment Multiple Programs 78 0.0Consumer Price Index Multiple Programs 13 0.0Personal Services Growth Factor Multiple Programs 26 0.0FY 2013 Current Services Funding Level <strong>Budget</strong> (CSFL) 7,591 68.0Cost Increase: In personal services for steps and Fringe Benefits Forensic Toxicology 111 0.0Cost Increase: In personal services for steps and Fringe Benefits Death Investigations/ Certifications 81 0.0Cost Increase: In personal services for steps and Fringe Benefits Fatality Review Committees 14 0.0Cost Decrease: In Contractual Services Multiple Programs -1 0.0Cost Decrease: In Equipment and Equipment Rental Multiple Programs -26 0.0Cost Decrease: In Supplies and Materials Multiple Programs -48 0.0Cost Decrease: In O<strong>the</strong>r Services and Charges Multiple Programs -130 0.0FY 2013 Initial Adjusted <strong>Budget</strong> 7,591 68.0Technical Adjustment: Health insurance contribution Multiple Programs 27 0.FY 2013 Additionally Adjusted <strong>Budget</strong> 7,619 68.0FY 2013 Policy InitiativesCost Increase: <strong>Chief</strong> Toxicologist position Forensic Toxicology 112 1.0Technical Adjustments: In personal services for union pay differential Multiple Programs 103 0.0LOCAL FUNDS: FY 2013 Proposed <strong>Budget</strong> and FTE 7,834 69.0INTRA-DISTRICT FUNDS: FY 2012 Approved <strong>Budget</strong> and FTE 90 0.0No Changes 0 0.0FY 2013 Initial Adjusted <strong>Budget</strong> 90 0.0INTRA-DISTRICT FUNDS: FY 2013 Proposed <strong>Budget</strong> and FTE 90 0.0Gross for FX0 - <strong>Office</strong> <strong>of</strong> <strong>the</strong> <strong>Chief</strong> Medical Examiner 7,924 69.0(Change is calculated by whole numbers and numbers may not add up due to rounding)FY 2013 Proposed <strong>Budget</strong> and <strong>Financial</strong> Plan<strong>Office</strong> <strong>of</strong> <strong>the</strong> <strong>Chief</strong> Medical ExaminerC-105
<strong>Agency</strong> Performance PlanThe agency’s performance plans has <strong>the</strong> following objectives for FY 2013:1. <strong>Agency</strong> ManagementObjective 1: Maintain high quality <strong>of</strong>fice and system operations to support effective medicolegal deathinvestigation, efficient and quality autopsy reporting, and accurate certification <strong>of</strong> deaths.2. Death Investigation and CertificationObjective 1: Provide efficient, timely, and accurate death investigation and certification <strong>of</strong> cases within<strong>the</strong> jurisdiction <strong>of</strong> <strong>the</strong> agency as statutorily mandated.Death Investigation and CertificationFY 2010 FY 2011 FY 2011 FY 2012 FY 2013 FY 2014Measure Actual Target Actual Projection Projection ProjectionPercentage <strong>of</strong> reports <strong>of</strong> all postmortem examinationscompleted within 60 calendar days from time <strong>of</strong>autopsy * TO BE ELIMINATED AND REPLACED WITHTHE TWO INDICATORS BELOW. 88.74% 90% 88.31%NotAvailableNotAvailableNotAvailablePercentage <strong>of</strong> reports <strong>of</strong> all postmortem examinationscompleted within 90 calendar days from <strong>the</strong> time <strong>of</strong>autopsy in homicide cases ** NotAvailable ** NotAvailableNotAvailable ** 90% 90% 90%Percentage <strong>of</strong> reports <strong>of</strong> all postmortem examinationscompleted within 60 calendar days from <strong>the</strong> time <strong>of</strong>autopsy in all cases (homicides excluded) ** NotAvailable ** NotAvailableNotAvailable ** 90% 90% 90%Percentage <strong>of</strong> positively identified bodies ready for releasewithin 48 hours 95.3% 95% 93.04% 95% 95% 95%Percentage <strong>of</strong> primary contacts (case decision for jurisdiction)made within 8 hours <strong>of</strong> case assignment to investigator.TO BE ELIMINATED AND REPLACED WITH THEINDICATOR BELOW. 9.131% 95% 92.29%NotAvailableNotAvailableNotAvailablePercentage <strong>of</strong> preliminary investigative reports complete forutilization in <strong>the</strong> daily case review morning meetingsNotAvailableNotAvailableNotAvailable 95% 95% 95%Percentage <strong>of</strong> mortuary scene response within one hour <strong>of</strong>transport notification by an investigator or medicalexaminer <strong>of</strong> an accepted case 92.66% 95% 91.50% 95% 95% 95%*This measure is an industry standard, adopted in September 2009, by <strong>the</strong> National Association <strong>of</strong> Medical Examiners (NAME) within its accreditation guidelines The previous standard, which set forth a differentpercentage for completion <strong>of</strong> cases and varied deadlines for homicide and non-homicide cases, was used by <strong>the</strong> agency as a measure for FY 2009 and previous fiscal years. The agency is currently provisionallyaccredited and continues to work toward meeting <strong>the</strong> newly adopted measure.**This measure is an industry standard adopted by NAME after <strong>the</strong> September 2009 revision in <strong>the</strong> recent year. The agency will work toward meeting this adopted measure.<strong>Office</strong> <strong>of</strong> <strong>the</strong> <strong>Chief</strong> Medical ExaminerC-106FY 2013 Proposed <strong>Budget</strong> and <strong>Financial</strong> Plan
3. Forensic ToxicologyObjective 1: Implementation <strong>of</strong> a Breath Alcohol Instrument Service for <strong>the</strong> District.Objective 2: Provision <strong>of</strong> Statistical Reporting <strong>of</strong> Interest to Various District Agencies .Forensic ToxicologyFY 2010 FY 2011 FY 2011 FY 2012 FY 2013 FY 2014Measure Actual Target Actual Projection Projection ProjectionPercentage <strong>of</strong> toxicology examinations completed within 90calendar days <strong>of</strong> case submission * TO BE ELIMINATED Not Not NotAND REPLACED BY THE TWO INDICATORS BELOW. 99.79% 90% 99.62% Available Available AvailablePercentage <strong>of</strong> negative toxicology examinations completed Not Not Notwithin 30 calendar days <strong>of</strong> case submission ** Available ** Available Available ** 90% 90% 90%Percentage <strong>of</strong> positive toxicology examinations completed Not Not Notwithin 60 calendar days <strong>of</strong> case submission ** Available ** Available Available ** 90% 90% 90%*This measure is an industry standard, adopted in September 2009, by <strong>the</strong> National Association <strong>of</strong> Medical Examiners (NAME) within its accreditation guidelines The previous standard, which set forth a differentpercentage for completion <strong>of</strong> cases and varied deadlines for homicide and non-homicide cases, was used by <strong>the</strong> agency as a measure for FY 2009 and previous fiscal years. The agency is currently provisionallyaccredited and continues to work toward meeting <strong>the</strong> newly adopted measure.**This measure is an industry standard adopted by NAME after <strong>the</strong> September 2009 revision in <strong>the</strong> recent year. The agency will work toward meeting this adopted measure.4. Fatality Review *Objective 1: Provide analysis and make recommendations that result in improved services and outcomes for thosepopulations served by <strong>the</strong> Fatality Review Unit.Fatality ReviewFY 2010 FY 2011 FY 2011 FY 2012 FY 2013 FY 2014Measure Actual Target Actual Projection Projection ProjectionPercentage <strong>of</strong> CFRC fatality reviews held within sixmonths <strong>of</strong> notification <strong>of</strong> <strong>the</strong> death 85.53% 90% 88% 75% 75% 75%Percentage <strong>of</strong> MRDD fatality reviews held within threemonths <strong>of</strong> receipt <strong>of</strong> <strong>the</strong> investigative report fromDHS/DDS and determination <strong>of</strong> <strong>the</strong> cause and manner<strong>of</strong> death 100% 90% 78% 75% 75% 75%CFRC: Child Fatality Review CommitteeMRDD: Mental Retardation and Developmental DisabilitiesDHS: Department <strong>of</strong> Human ServicesDDS: Department on Disability Services*Due to <strong>the</strong> lack <strong>of</strong> dedicated supervisory staff for <strong>the</strong> Fatality Review Division, <strong>the</strong> measures herein related to <strong>the</strong> Division have been reduced for FY 2012.FY 2013 Proposed <strong>Budget</strong> and <strong>Financial</strong> Plan<strong>Office</strong> <strong>of</strong> <strong>the</strong> <strong>Chief</strong> Medical ExaminerC-107
<strong>Office</strong> <strong>of</strong> Administrative Hearings(FS0)www.oah.dc.govTelephone: 202-442-9094% ChangeFY 2011 FY 2012 FY 2013 fromDescription Actual Approved Proposed FY 2012Operating <strong>Budget</strong> $7,783,083 $8,864,885 $9,234,726 4.2FTEs 63.9 74.6 75.6 1.3The mission <strong>of</strong> <strong>the</strong> <strong>Office</strong> <strong>of</strong> Administrative Hearings (OAH) is toprovide District <strong>of</strong> Columbia’s citizens and government agencies a fair,efficient, and effective forum to manage and resolve administrative disputes.OAH is an impartial, independent agency that adjudicates cases for more than 40 District <strong>of</strong> Columbia agencies,boards, and commissions. OAH holds hearings, conducts mediations, and provides o<strong>the</strong>r adjudication services toresolve disputes arising under <strong>the</strong> District’s laws and regulations.The agency’s FY 2013 proposed budget is presented in <strong>the</strong> following tables:FY 2013 Proposed <strong>Budget</strong> and <strong>Financial</strong> Plan<strong>Office</strong> <strong>of</strong> Administrative HearingsC-109
FY 2013 Proposed Gross Funds Operating <strong>Budget</strong>, by Revenue TypeTable FS0-1 contains <strong>the</strong> proposed FY 2013 agency budget compared to <strong>the</strong> FY 2012 approved budget. It alsoprovides FY 2010 and FY 2011 actual expenditures.Table FS0-1(dollars in thousands)ChangeActual Actual Approved Proposed from PercentAppropriated Fund FY 2010 FY 2011 FY 2012 FY 2013 FY 2012 Change*General FundLocal Funds 7,003 6,706 7,637 7,962 325 4.3Special Purpose Revenue Funds 0 4 0 0 0 N/ATotal for General Fund 7,003 6,710 7,637 7,962 325 4.3Intra-District FundsIntra-District Funds 1,045 1,073 1,228 1,273 45 3.6Total for Intra-District Funds 1,045 1,073 1,228 1,273 45 3.6Gross Funds 8,048 7,783 8,865 9,235 370 4.2*Percent change is based on whole dollars.Note: If applicable, for a breakdown <strong>of</strong> each Grant (Federal and Private), Special Purpose Revenue type and Intra-District agreement,please refer to Schedule 80 <strong>Agency</strong> Summary by Revenue Source in <strong>the</strong> FY 2013 Operating Appendices located on <strong>the</strong> <strong>Office</strong> <strong>of</strong> <strong>the</strong><strong>Chief</strong> <strong>Financial</strong> <strong>Office</strong>r’s website.FY 2013 Proposed Full-Time Equivalents, by Revenue TypeTable FS0-2 contains <strong>the</strong> proposed FY 2013 FTE level compared to <strong>the</strong> FY 2012 approved FTE level by revenuetype. It also provides FY 2010 and FY 2011 actual data.Table FS0-2ChangeActual Actual Approved Proposed from PercentAppropriated Fund FY 2010 FY 2011 FY 2012 FY 2013 FY 2012 ChangeGeneral FundLocal Funds 55.0 55.8 66.6 67.6 1.0 1.4Special Purpose Revenue Funds 0.0 0.1 0.0 N/ATotal for General Fund 55.0 55.9 66.6 67.6 1.0 1.4Intra-District FundsIntra-District Funds 8.3 8.0 8.0 8.0 0.0 0.0Total for Intra-District Funds 8.3 8.0 8.0 8.0 0.0 0.0Total Proposed FTEs 63.3 63.9 74.6 75.6 1.0 1.3*Numbers may not add due to rounding.<strong>Office</strong> <strong>of</strong> Administrative HearingsC-110FY 2013 Proposed <strong>Budget</strong> and <strong>Financial</strong> Plan
FY 2013 Proposed Operating <strong>Budget</strong>, by Comptroller Source GroupTable FS0-3 contains <strong>the</strong> proposed FY 2013 budget at <strong>the</strong> Comptroller Source Group (object class) level comparedto <strong>the</strong> FY 2012 approved budget. It also provides FY 2010 and FY 2011 actual expenditures.Table FS0-3(dollars in thousands)ChangeActual Actual Approved Proposed from PercentComptroller Source Group FY 2010 FY 2011 FY 2012 FY 2013 FY 2012 Change*11 - Regular Pay - Continuing Full Time 5,889 5,662 6,309 6,356 -47 -0.712 - Regular Pay - O<strong>the</strong>r 4 138 194 490 296 152.413 - Additional Gross Pay 92 60 10 54 44 440.414 - Fringe Benefits - Current Personnel 1,010 1,007 1,330 1,508 178 13.415 - Overtime Pay 1 0 1 0 -1 -100.0Subtotal Personal Services (PS) 6,996 6,867 7,844 8,409 564 7.220 - Supplies and Materials 85 163 149 169 20 13.630 - Energy, Comm. and Building Rentals 20 0 0 0 0 N/A31 - Telephone, Telegraph, Telegram, Etc. -50 10 0 0 0 N/A32 - Rentals - Land and Structures -201 0 0 0 0 N/A33 - Janitorial Services 44 0 0 0 0 N/A34 - Security Services 599 0 0 0 0 N/A35 - Occupancy Fixed Costs 108 0 0 0 0 N/A40 - O<strong>the</strong>r Services and Charges 172 277 304 223 -80 -26.441 - Contractual Services - O<strong>the</strong>r 199 395 468 397 -71 -15.270 - Equipment and Equipment Rental 76 71 100 36 -63 -63.6Subtotal Nonpersonal Services (NPS) 1,052 916 1020 826 -194 -19.1Gross Funds 8,048 7,783 8,865 9,325 370 4.2*Percent change is based on whole dollars.FY 2013 Proposed <strong>Budget</strong> and <strong>Financial</strong> Plan<strong>Office</strong> <strong>of</strong> Administrative HearingsC-111
Program DescriptionThe <strong>Office</strong> <strong>of</strong> Administrative Hearings operates through <strong>the</strong> following 6 programs:Judicial – ensures due process while working to improve <strong>the</strong> quality, efficiency, and efficacy <strong>of</strong> justice management.This program provides pre-trial management, hearings, appeals, and mediations.Court Counsel – supports <strong>the</strong> administrative court's judicial function by assisting judges in legal analysis, research,and drafting orders and notices; ensures agency compliance with applicable laws; assists with <strong>the</strong> tracking <strong>of</strong> legislativeand regulatory initiatives; and maintains <strong>the</strong> law library.Clerk <strong>of</strong> Court – provides an efficient intake <strong>of</strong> cases and supports <strong>the</strong> agency’s case management system and caseloadreporting; maintains forms and documentation; and serves as <strong>the</strong> primary customer service interface.Executive – provides agency direction and performance oversight, including administering <strong>the</strong> agency's infrastructureand related support services and functions.<strong>Agency</strong> Management – provides for administrative support and <strong>the</strong> required tools to achieve operational and programmaticresults. This program is standard for all agencies using performance-based budgeting.<strong>Agency</strong> <strong>Financial</strong> Operations – provides comprehensive and efficient financial management services to, and onbehalf <strong>of</strong>, District agencies so that <strong>the</strong> financial integrity <strong>of</strong> <strong>the</strong> District <strong>of</strong> Columbia is maintained. This programis standard for all agencies using performance-based budgeting.Program Structure ChangeThe <strong>Office</strong> <strong>of</strong> Administrative Hearings adds <strong>the</strong> <strong>Agency</strong> <strong>Financial</strong> Operations program in <strong>the</strong> FY 2013 proposedbudget.<strong>Office</strong> <strong>of</strong> Administrative HearingsC-112FY 2013 Proposed <strong>Budget</strong> and <strong>Financial</strong> Plan
FY 2013 Proposed Operating <strong>Budget</strong> and FTEs, by Program and ActivityTable FS0-4 contains <strong>the</strong> proposed FY 2013 budget by program and activity compared to <strong>the</strong> FY 2012 approved budget.It also provides <strong>the</strong> FY 2011 actual data.Table FS0-4(dollars in thousands)Dollars in ThousandsFull-Time EquivalentsChangeChangeActual Approved Proposed from Actual Approved Proposed fromProgram/Activity FY 2011 FY 2012 FY 2013 FY 2012 FY 2011 FY 2012 FY 2013 FY 2012(100A) <strong>Agency</strong> Management Program(1010) Personnel-Master 98 107 113 6 1.2 1.2 1.3 0.0(1040) Information Technology 180 264 278 14 1.0 1.0 1.0 0.0(1050) <strong>Financial</strong> Services 120 119 0 -119 1.0 1.0 0.0 -1.0Subtotal (100A) <strong>Agency</strong> Management Program 3 9 8 490 391 -99 3.2 3.2 2.3 -1.0(100F) <strong>Agency</strong> <strong>Financial</strong> Operation(110F) <strong>Budget</strong> Operations 0 0 122 122 0.0 0.0 1.0 1.0Subtotal (100F) <strong>Agency</strong> <strong>Financial</strong> Operation 0 0 122 122 0.0 0.0 1.0 1.0(200A) Judicial(020A) Trials/Appeals and Justice Management 5,371 5,546 5,378 -169 33.4 34.0 34.0 0.0Subtotal (200A) Judicial 5,371 5,546 5,378 -169 33.4 34.0 34.0 0.0(300A) Court Counsel(030A) Judicial Assistance and Legal Counsel 446 1,316 1,677 361 4.8 16.5 17.2 0.8Subtotal (300A) Court Counsel 446 1,316 1,677 361 4.8 16.5 17.2 0.8(400A) Clerk <strong>of</strong> Court(040A) Case Management and Judicial Support Services 1,101 1,011 1,115 104 18.6 16.8 17.0 0.1Subtotal (400A) Clerk <strong>of</strong> Court 1,101 1,011 1,115 104 18.6 16.8 17.0 0.1(500A) Executive(050A) Program Direction and Oversight 467 502 553 50 3.9 4.0 4.0 0.0Subtotal (500A) Executive 467 502 553 50 3.9 4.0 4.0 0.0Total Proposed Operating <strong>Budget</strong> 7,783 8,865 9,235 370 63.9 74.6 75.6 1.0(Change is calculated by whole numbers and numbers may not add up due to rounding)Note: For more detailed information regarding <strong>the</strong> proposed funding for <strong>the</strong> activities within this agency’s programs, please see Schedule 30-PBBProgram Summary by Activity in <strong>the</strong> FY 2013 Operating Appendices located on <strong>the</strong> <strong>Office</strong> <strong>of</strong> <strong>the</strong> <strong>Chief</strong> <strong>Financial</strong> <strong>Office</strong>r’s website.FY 2013 Proposed <strong>Budget</strong> and <strong>Financial</strong> Plan<strong>Office</strong> <strong>of</strong> Administrative HearingsC-113
FY 2013 Proposed <strong>Budget</strong> ChangesThe <strong>Office</strong> <strong>of</strong> Administrative Hearings’ (OAH) proposed FY 2013 gross budget is $9,234,726, which represents a4.2 percent increase over its FY 2012 approved gross budget <strong>of</strong> $8,864,885. The budget is comprised <strong>of</strong> $7,962,081in Local funds and $1,272,637 in Intra-District funds.Current Services Funding LevelThe Current Services Funding Level (CSFL) is a Local funds ONLY representation <strong>of</strong> <strong>the</strong> true cost <strong>of</strong> operatingDistrict agencies, before consideration <strong>of</strong> policy decisions. The CSFL reflects changes from <strong>the</strong> FY 2012 approvedbudget across multiple programs, and it estimates how much it would cost an agency to continue its current programsand operations into <strong>the</strong> following fiscal year. The initial adjustments in <strong>the</strong> budget proposal representchanges that should be compared to <strong>the</strong> FY 2013 CSFL budget and not necessarily changes made to <strong>the</strong> FY 2012Local funds budget. The FY 2013 CSFL adjustments to <strong>the</strong> FY 2012 Local funds budget are described in table 5<strong>of</strong> this agency's budget chapter. Please see <strong>the</strong> CSFL Development section within Volume 1: Executive Summaryfor more information regarding <strong>the</strong> methodology used and components that comprise <strong>the</strong> CSFL.OAH’s FY 2013 CSFL budget is $7,799,781, which represents a $162,976, or 2.1 percent, increase over <strong>the</strong>FY 2012 approved Local funds budget <strong>of</strong> $7,636,805.Initial Adjusted <strong>Budget</strong>Cost Increase: $116,000 <strong>of</strong> Local funds in O<strong>the</strong>r Services and Charges to support new Information Technologyservices.Cost Decrease: $116,000 <strong>of</strong> Local funds from personal services to <strong>of</strong>fset <strong>the</strong> increase in O<strong>the</strong>r Services and Charges.Additionally Adjusted <strong>Budget</strong>Technical Adjustment: Adjustment <strong>of</strong> Fringe Benefits to restore a 72 percent District Government contributionfor employee health insurance, implemented in <strong>the</strong> FY 2011 budget, to 75 percent in FY 2013. These technicaladjustments include increases <strong>of</strong> $28,067 in Local funds and $1,573 in Intra-District funds.Policy InitiativesCost Increase: $109,818 and 1.0 FTE <strong>of</strong> Local funds to personal services cost to hire a Supervisory Clerk <strong>of</strong> <strong>the</strong>Court and $67,413 in Intra-District funds to properly align <strong>the</strong> budget with expected revenues.Shift: $24,000 was shifted from Intra-District funds to Local funds in personal services.<strong>Office</strong> <strong>of</strong> Administrative HearingsC-114FY 2013 Proposed <strong>Budget</strong> and <strong>Financial</strong> Plan
FY 2012 Approved <strong>Budget</strong> to FY 2013 Proposed <strong>Budget</strong>, by Revenue TypeTable FS0-5 itemizes <strong>the</strong> changes by revenue type between <strong>the</strong> FY 2012 approved budget and <strong>the</strong> FY 2013 proposedbudget.Table FS0-5(dollars in thousands)PROGRAM BUDGET FTELOCAL FUNDS: FY 2012 Approved <strong>Budget</strong> and FTE 7,637 66.6Recurring <strong>Budget</strong> Items Multiple Programs 39 0.0Fringe Benefit Rate Adjustment Multiple Programs 85 0.0Consumer Price Index Multiple Programs 10 0.0Personal Services Growth Factor Multiple Programs 30 0.0FY 2013 Current Services Funding Level <strong>Budget</strong> (CSFL): 7,800 66.6Cost Increase: In O<strong>the</strong>r Services and Charges to Multiple Programs 116 0.0cover information technology costCost Decrease: In personal services to <strong>of</strong>fset O<strong>the</strong>r Services and Charges Multiple Programs -116 0.0FY 2013 Initial Adjusted <strong>Budget</strong>: 7,800 66.6Technical Adjustment: Health insurance contribution Multiple Programs 28 0.0FY 2013 Additionally Adjusted <strong>Budget</strong>: 7,828 66.6FY 2013 Policy InitiativesCost Increase: In personal services Court Counsel 110 1.0Shift: From Intra-District funds for personal services costs Multiple Programs 24 0.0LOCAL FUNDS: FY 2013 Proposed <strong>Budget</strong> and FTE 7,962 67.6INTRADISTRICT FUNDS: FY 2012 Approved <strong>Budget</strong> and FTE 1,228 8.0Technical Adjustment: Health insurance contribution Multiple Programs 2 0.0FY 2013 Additionally Adjusted <strong>Budget</strong>: 1,230 8.0FY 2013 Policy InitiativesCost Increase: To properly align <strong>the</strong> budget Multiple Programs 67 0.0Shift: To Local funds to support personal services costs Multiple Programs -24 0.0INTRA-DISTRICT FUNDS: FY 2013 Proposed <strong>Budget</strong> and FTE 1,273 8.0Gross for FS0 - <strong>Office</strong> <strong>of</strong> Administrative Hearings 9,235 75.6(Change is calculated by whole numbers and numbers may not add up due to rounding)FY 2013 Proposed <strong>Budget</strong> and <strong>Financial</strong> Plan<strong>Office</strong> <strong>of</strong> Administrative HearingsC-115
<strong>Agency</strong> Performance PlanThe agency’s performance plan has <strong>the</strong> following objectives for FY 2013:Objective 1: Reduce <strong>the</strong> time for reaching final disposition.Objective 2: Improve <strong>the</strong> experience <strong>of</strong> participants in administrative hearings through quality customer service.<strong>Agency</strong> Performance MeasuresFY 2010 FY 2011 FY 2012 FY 2013 FY 2014Measure Actual Actual Projection Projection ProjectionPercentage <strong>of</strong> unemployment insurance cases resolvedwithin 90 days <strong>of</strong> filing 1 93% 98.20% 95% 95% 95%Percentage <strong>of</strong> hearings reduced due to mediation 2.0% 4.21% 2.5% 3.5% 5%Percentage <strong>of</strong> non-unemployment insurance casesresolved within 120 days <strong>of</strong> filing 61.28% 40.09% 2 50% 55% 60%Percentage <strong>of</strong> consumer satisfaction surveys with arating <strong>of</strong> at least “Agree” regarding <strong>the</strong> level <strong>of</strong> quality<strong>of</strong> OAH’s service 92% 96.10% 93% 95% 97%Performance Plan Endnotes:1. The U.S. Department <strong>of</strong> Labor industry standard is 95 percent <strong>of</strong> cases resolved within 90 days <strong>of</strong> filing.2. Reflects OAH’s highly successful efforts to clear backlogged cases (greater than 120 days old) through <strong>the</strong> FY 2010 - FY 2011 Operation Clean Slate initiative.<strong>Office</strong> <strong>of</strong> Administrative HearingsC-116FY 2013 Proposed <strong>Budget</strong> and <strong>Financial</strong> Plan
Criminal Justice Coordinating Councilwww.cjcc.dc.govTelephone: 202-442-9283(FJ0)% ChangeFY 2011 FY 2012 FY 2013 fromDescription Actual Approved Proposed FY 2012Operating <strong>Budget</strong> $2,828,277 $2,105,176 $2,358,161 12.0FTEs 9.8 15.0 16.0 6.7The mission <strong>of</strong> <strong>the</strong> Criminal Justice Coordinating Council (CJCC) isto serve as <strong>the</strong> forum for identifying issues and <strong>the</strong>ir solutions, proposingactions, and facilitating cooperation that will improve public safetyand <strong>the</strong> criminal and juvenile justice system <strong>of</strong> <strong>the</strong> District <strong>of</strong>Columbia for its residents, visitors, victims, and <strong>of</strong>fenders.Summary <strong>of</strong> ServiceCJCC carries out its mission by striving to:■ Provide a forum for effective collaboration and problem solving among criminal and juvenile justiceagencies.■ Identify, develop and coordinate innovative inter-agency solutions to address District <strong>of</strong> Columbiapublic safety challenges.■ Research and analyze critical issues identified by <strong>the</strong> criminal and juvenile justice system.■ Facilitate and provide long-term performance monitoring <strong>of</strong> collaborative solutions to public safetyand criminal justice challenges.The agency’s FY 2013 proposed budget is presented in <strong>the</strong> following tables:FY 2013 Proposed <strong>Budget</strong> and <strong>Financial</strong> PlanCriminal Justice Coordinating CouncilC-117
FY 2013 Proposed Gross Funds Operating <strong>Budget</strong>, by Revenue TypeTable FJ0-1 contains <strong>the</strong> proposed FY 2013 agency budget compared to <strong>the</strong> FY 2012 approved budget. It also providesFY 2010 and FY 2011 actual expenditures.Table FJ0-1(dollars in thousands)ChangeActual Actual Approved Proposed from PercentAppropriated Fund FY 2010 FY 2011 FY 2012 FY 2013 FY 2012 Change*General FundLocal Funds 298 173 195 449 253 129.7Total for General Fund 298 173 195 449 253 129.7Federal ResourcesFederal Payments 1,350 1,963 1,800 1,800 0 0.0Federal Grant Funds 33 35 0 0 0 N/ATotal for Federal Resources 1,383 1,998 1,800 1,800 0 0.0Private FundsPrivate Grant Funds 38 16 0 0 0 N/ATotal for Private Funds 38 16 0 0 0 N/AIntra-District FundsIntra-District Funds 721 642 110 109 -1 -0.5Total for Intra-District Funds 721 642 110 109 -1 -0.5Gross Funds 2,440 2,828 2,105 2,358 253 12.0*Percent change is based on whole dollars.Note: If applicable, for a breakdown <strong>of</strong> each Grant (Federal and Private), Special Purpose Revenue type and Intra-District agreement,please refer to Schedule 80 <strong>Agency</strong> Summary by Revenue Source in <strong>the</strong> FY 2013 Operating Appendices located on <strong>the</strong> <strong>Office</strong> <strong>of</strong> <strong>the</strong><strong>Chief</strong> <strong>Financial</strong> <strong>Office</strong>r’s website.Criminal Justice Coordinating CouncilC-118FY 2013 Proposed <strong>Budget</strong> and <strong>Financial</strong> Plan
FY 2013 Proposed Full-Time Equivalents, by Revenue TypeTable FJ0-2 contains <strong>the</strong> proposed FY 2013 FTE level compared to <strong>the</strong> FY 2012 approved FTE level by revenuetype. It also provides FY 2010 and FY 2011 actual data.Table FJ0-2ChangeActual Actual Approved Proposed from PercentAppropriated Fund FY 2010 FY 2011 FY 2012 FY 2013 FY 2012 ChangeGeneral FundLocal Funds 1.7 1.3 1.3 1.3 0.0 0.0Total for General Fund 1.7 1.3 1.3 1.3 0.0 0.0Federal ResourcesFederal Payments 11.0 8.5 12.7 13.7 1.0 7.9Total for Federal Resources 11.0 8.5 12.7 13.7 1.0 7.9Intra-District FundsIntra-District Funds 0.0 0.0 1.0 1.0 0.0 0.0Total for Intra-District Funds 0.0 0.0 1.0 1.0 0.0 0.0Total Proposed FTEs 12.7 9.8 15.0 16.0 1.0 6.7FY 2013 Proposed <strong>Budget</strong> and <strong>Financial</strong> PlanCriminal Justice Coordinating CouncilC-119
FY 2013 Proposed Operating <strong>Budget</strong>, by Comptroller Source GroupTable FJ0-3 contains <strong>the</strong> proposed FY 2013 budget at <strong>the</strong> Comptroller Source Group (object class) level comparedto <strong>the</strong> FY 2012 approved budget. It also provides FY 2010 and FY 2011 actual expenditures.Table FJ0-3(dollars in thousands)ChangeActual Actual Approved Proposed from PercentComptroller Source Group FY 2010 FY 2011 FY 2012 FY 2013 FY 2012 Change*11 - Regular Pay - Continuing Full Time 883 784 1,206 1,350 144 11.912 - Regular Pay - O<strong>the</strong>r 121 144 130 86 -45 -34.213 - Additional Gross Pay 25 23 0 20 20 N/A14 - Fringe Benefits - Current Personnel 161 170 228 266 38 16.9Subtotal Personal Services (PS) 1,191 1,121 1,564 1,723 158 10.120 - Supplies and Materials 193 46 28 26 -2 -6.730 - Energy, Comm. and Building Rentals 15 0 0 0 0 N/A31 - Telephone, Telegraph, Telegram, Etc. 18 0 0 0 0 N/A33 - Janitorial Services 8 0 0 0 0 N/A34 - Security Services 5 0 0 0 0 N/A35 - Occupancy Fixed Costs 11 0 0 0 0 N/A40 - O<strong>the</strong>r Services and Charges -94 153 268 227 -41 -15.241 - Contractual Services - O<strong>the</strong>r 993 1,259 245 382 137 56.070 - Equipment and Equipment Rental 100 250 0 0 0 N/ASubtotal Nonpersonal Services (NPS) 1,249 1,708 541 636 95 17.5Gross Funds 2,440 2,828 2,105 2,358 253 12.0*Percent change is based on whole dollars.Criminal Justice Coordinating CouncilC-120FY 2013 Proposed <strong>Budget</strong> and <strong>Financial</strong> Plan
Program DescriptionThe Criminal Justice Coordinating Council (CJCC) operates through <strong>the</strong> following 4 programs:Research, Analysis and Evaluation – enhances <strong>the</strong> knowledge base <strong>of</strong> <strong>the</strong> justice community in <strong>the</strong> city so thatinformed decisions and strategic planning occur based on factual information and evaluation <strong>of</strong> initiatives to determine<strong>the</strong>ir value.This program contains <strong>the</strong> following activity:■ Research, Analysis and Evaluation (Fed and ID) – This function enables CJCC agencies with sound approachesto emerging or chronic challenges within <strong>the</strong> District’s criminal justice system to plan effectively and measure<strong>the</strong> effectiveness <strong>of</strong> key CJCC initiatives and committee progress for <strong>the</strong> year to determine success and torecommend initiatives for replication.Collaboration and Planning Across Justice Agencies – provides a structure for joint work by District, federal, andjudicial criminal justice and juvenile justice stakeholders toward a stronger and more responsive justice system.This program contains <strong>the</strong> following 4 activities:■ Operational Infrastructure for Problem Solving (Local and Fed) – provides an operational infrastructure forcriminal justice agencies across <strong>the</strong> city to identify public safety priorities and to plan and solve problems;■ Topical Work Groups – examines emerging and chronic trends and issues that impact multiple agencies in <strong>the</strong>District <strong>of</strong> Columbia’s criminal justice system, and provides recommendations that enable <strong>the</strong> CJCC to planappropriate responses;■ CJCC Meetings – provides member agencies a regular forum to collectively review and consider <strong>the</strong> implementation<strong>of</strong> recommendations from committees, subcommittees, and workgroup, and provides research andtraining to address barriers and execute necessary action items; and■ Technical Assistance and Training – provides CJCC members with opportunities to network with o<strong>the</strong>r jurisdictionson criminal justice approaches and to provide member agencies access to state-<strong>of</strong>-<strong>the</strong>-art knowledgeand field-tested approaches to multi-agency criminal justice issues.Integrated Information Sharing System – connects criminal and juvenile justice agencies through technology toshare public safety information and to mobilize effectively when responding to issues that extend beyond any oneagency, by providing authorized criminal justice users an integrated criminal and juvenile justice information-sharingsystem called JUSTIS for effective tracking and monitoring <strong>of</strong> criminal activities across agencies and jurisdictions.<strong>Agency</strong> Management (ASMP) – provides for administrative support and <strong>the</strong> required tools to achieve operationaland programmatic results. This program is standard for all agencies using performance-based budgeting.Program Structure ChangeThe Criminal Justice Coordinating Council has no program structure changes in <strong>the</strong> FY 2013 proposed budget.FY 2013 Proposed <strong>Budget</strong> and <strong>Financial</strong> PlanCriminal Justice Coordinating CouncilC-121
FY 2013 Proposed Operating <strong>Budget</strong> and FTEs, by Program and ActivityTable FJ0-4 contains <strong>the</strong> proposed FY 2013 budget by program and activity compared to <strong>the</strong> FY 2012 approved budget.It also provides <strong>the</strong> FY 2011 actual data.Table FJ0-4(dollars in thousands)Dollars in ThousandsFull-Time EquivalentsChangeChangeActual Approved Proposed from Actual Approved Proposed fromProgram/Activity FY 2011 FY 2012 FY 2013 FY 2012 FY 2011 FY 2012 FY 2013 FY 2012(1000) Research Analysis and Evaluation(1010) Research and Analysis 6 0 0 0 0.0 0.0 0.0 0.0(1110) Research and Analysis (Fed) 252 202 265 62 0.7 1.0 2.0 1.0(1117) Research and Analysis (ID) 0 0 109 109 0.0 0.0 1.0 1.0(1120) Evaluation (Fed) 253 218 0 -218 0.7 2.0 0.0 -2.0Subtotal (1000) Research Analysis and Evaluation 511 420 374 -47 1.4 3.0 3.0 0.0(2000) Collaboration and Planning Across Agencies(2010) Operational Infrustructure 173 195 199 3 1.3 1.3 1.3 0.0(2110) Operational Infrustructure (Fed) 214 164 214 50 1.0 1.7 1.7 0.0(2120) Topical Work Groups (Fed) 246 381 409 28 2.0 3.0 4.0 1.0(2130) CJCC Meetings (Fed) 0 14 16 2 0.0 0.0 0.0 0.0(2140) Technical Assistance and Training (Fed) 53 65 21 -44 0.0 0.0 0.0 0.0(2153) Operational Infrastructure-Private Grant 1 0 0 0 0.0 0.0 0.0 0.0Subtotal (2000) Collaboration and Planning Across Agencies 688 819 859 40 4.4 6.0 7.0 1.0(3000) Integrated Information System(3010) JUSTIS 532 0 0 0 0.0 0.0 0.0 0.0(3110) JUSTIS (Fed) 1,087 852 1,109 257 4.1 6.0 6.0 0.0Subtotal (3000) Integrated Information System 1,619 852 1,109 257 4.1 6.0 6.0 0.0(4000) ASMP(4030) Property Management 11 14 0 -14 0.0 0.0 0.0 0.0(4140) Information Technology (Fed) 0 0 16 16 0.0 0.0 0.0 0.0Subtotal (4000) ASMP 11 14 16 2 0.0 0.0 0.0 0.0Total Proposed Operating <strong>Budget</strong> 2,828 2,105 2,358 253 9.8 15.0 16.0 1.0(Change is calculated by whole numbers and numbers may not add up due to rounding)Note: For more detailed information regarding <strong>the</strong> proposed funding for <strong>the</strong> activities within this agency’s programs, please see Schedule 30-PBBProgram Summary by Activity in <strong>the</strong> FY 2013 Operating Appendices located on <strong>the</strong> <strong>Office</strong> <strong>of</strong> <strong>the</strong> <strong>Chief</strong> <strong>Financial</strong> <strong>Office</strong>r’s website.Criminal Justice Coordinating CouncilC-122FY 2013 Proposed <strong>Budget</strong> and <strong>Financial</strong> Plan
FY 2013 Proposed <strong>Budget</strong> ChangesThe Criminal Justice Coordinating Council (CJCC) proposed FY 2013 gross budget is $2,358,161, which representsa 12.0 percent increase over its FY 2012 approved gross budget <strong>of</strong> $2,105,176. The budget is comprised <strong>of</strong>$448,969 in Local funds, $1,800,000 in Federal Payments, and $109,192 in Intra-District funds.Current Services Funding LevelThe Current Services Funding Level (CSFL) is a Local funds ONLY representation <strong>of</strong> <strong>the</strong> true cost <strong>of</strong> operatingDistrict agencies, before consideration <strong>of</strong> policy decisions. The CSFL reflects changes from <strong>the</strong> FY 2012 approvedbudget across multiple programs, and it estimates how much it would cost an agency to continue its current programsand operations into <strong>the</strong> following fiscal year. The initial adjustment in <strong>the</strong> budget proposal represents changesthat should be compared to <strong>the</strong> FY 2013 CSFL budget and not necessarily changes made to <strong>the</strong> FY 2012 Localfunds budget. The FY 2013 CSFL adjustments to <strong>the</strong> FY 2012 Local funds budget are described in table 5 <strong>of</strong> thisagency's budget chapter. Please see <strong>the</strong> CSFL Development section within Volume 1: Executive Summary for moreinformation regarding <strong>the</strong> methodology used and components that comprise <strong>the</strong> CSFL.CJCC’s FY 2013 CSFL budget is $198,304, which represents a $2,828, or 1.4 percent, increase over <strong>the</strong> FY2012 approved Local funds budget <strong>of</strong> $195,476.Initial Adjusted <strong>Budget</strong>Cost Increase: CJCC proposes adjustments in Local funds for an increase <strong>of</strong> $11,635 to support projected salarystep increases and a net increase <strong>of</strong> $1,432 for Additional Gross Pay and Fringe Benefits. Similarly, <strong>the</strong> budget proposalfor Intra-District funds includes increases <strong>of</strong> $2,705 to cover salary step cost projections and $1,404 for FringeBenefits.Cost Decrease: The budget proposal for Local funds includes a reduction <strong>of</strong> $13,067 in Regular Pay - O<strong>the</strong>r to<strong>of</strong>fset increased costs in Regular Pay - Continuing Full Time. The agency reallocated NPS resources to support additionalpersonnel. In Intra-District funds, CJCC proposes reductions <strong>of</strong> $4,108 for Contractual Services and $700for O<strong>the</strong>r Services and Charges.Additionally Adjusted <strong>Budget</strong>Technical Adjustments: Adjustment <strong>of</strong> Fringe Benefits to restore <strong>the</strong> District Government contribution foremployee health insurance from 72 percent, implemented in <strong>the</strong> FY 2011 budget, to 75 percent in FY 2013, resultingin increases <strong>of</strong> $665 in Local funds, $4,891 in Federal Payments, and $192 in Intra-District funds.Additional Adjustments: CJCC is adjusting Federal Payments by a reduction <strong>of</strong> $4,891 to <strong>of</strong>fset <strong>the</strong> impact <strong>of</strong> <strong>the</strong>policy that reverses <strong>the</strong> District’s health insurance contribution from 72 percent to 75 percent.Policy InitiativesCost Increase: The Local funds budget was increased by $250,000 to support <strong>the</strong> integrated criminal and JuvenileJustice Information-Sharing System. CJCC increased <strong>the</strong> Federal Payments budget by $154,310 and 1.0 FTE toalign it with <strong>the</strong> President’s FY 2013 budget request sent to Congress.Cost Decrease: Federal Payments includes a reduction <strong>of</strong> $150,000 in order to reallocate nonpersonal servicesresources to support additional personnel.FY 2013 Proposed <strong>Budget</strong> and <strong>Financial</strong> PlanCriminal Justice Coordinating CouncilC-123
FY 2012 Approved <strong>Budget</strong> to FY 2013 Proposed <strong>Budget</strong>, by Revenue TypeTable FJ0-5 itemizes <strong>the</strong> changes by revenue type between <strong>the</strong> FY 2012 approved budget and <strong>the</strong> FY 2013 proposedbudget.Table FJ0-5(dollars in thousands)PROGRAM BUDGET FTELOCAL FUNDS: FY 2012 Approved <strong>Budget</strong> and FTE 195 1.3Fringe Benefit Rate Adjustment Multiple Programs 2 0.0Personal Services Growth Factor Multiple Programs 1 0.0FY 2013 Current Services Funding Level <strong>Budget</strong> (CSFL) 198 1.3Cost Increase: To adjust salaries for projected step increases Collaboration and Planning Across Agencies 12 0.0Cost Increase: Net adjustments to Additional Gross Collaboration and Planning Across Agencies 1 0.0Pay and Fringe BenefitsCost Decrease: To reallocate funding from Regular Pay - Collaboration and Planning Across Agencies -13 0.0O<strong>the</strong>r to Regular Pay - Continuing Full TimeFY 2013 Initial Adjusted <strong>Budget</strong> 198 1.3Technical Adjustment: Health insurance contribution Multiple Programs 1 0.0FY 2013 Additionally Adjusted <strong>Budget</strong> 199 1.3FY 2013 Policy InitiativesCost Increase: To support <strong>the</strong> JUSTIS data sharing program Integrated Information System 250 0.0LOCAL FUNDS: FY 2013 Proposed <strong>Budget</strong> and FTE 449 1.3FEDERAL PAYMENTS: FY 2012 Approved <strong>Budget</strong> and FTE 1,800 12.7Cost Decrease: To align <strong>the</strong> budget with FY 2013 projections Multiple Programs -4 0.0FY 2013 Initial Adjusted <strong>Budget</strong> 1,796 12.7Additional Adjustments: To adjust <strong>the</strong> budget to <strong>of</strong>fset Multiple Programs -5 0.0<strong>the</strong> impact <strong>of</strong> health insuranceTechnical Adjustment: Health insurance contribution Multiple Programs 5 0.0FY 2013 Additionally Adjusted <strong>Budget</strong> 1,796 12.7FY 2013 Policy InitiativesCost Increase: Adjust <strong>the</strong> budget to support additional Multiple Programs 154 1.0positionCost Decrease: Reallocate nonpersonal resources to support Multiple Programs -150 0.0additional personnelFEDERAL PAYMENTS: FY 2013 Proposed <strong>Budget</strong> and FTE 1,800 13.7INTRA-DISTRICT FUNDS: FY 2012 Approved <strong>Budget</strong> and FTE 110 1.0Cost Increase: To adjust salary for step increase projection Research Analysis and Evaluation 3 0.0Cost Increase: To align Fringe Benefits with projections Research Analysis and Evaluation 1 0.0Cost Decrease: In Contractual Services - O<strong>the</strong>r Research Analysis and Evaluation -4 0.0Cost Decrease: In O<strong>the</strong>r Services and Charges Research Analysis and Evaluation -1 0.0FY 2013 Initial Adjusted <strong>Budget</strong> 109 1.0Technical Adjustment: Health insurance contribution Multiple Programs 0 0.0FY 2013 Additionally Adjusted <strong>Budget</strong> 109 1.0INTRA-DISTRICT FUNDS: FY 2013 Proposed <strong>Budget</strong> and FTE 109 1.0Gross for FJ0 - Criminal Justice Coordinating Council 2,358 16.0(Change is calculated by whole numbers and numbers may not add up due to rounding)Criminal Justice Coordinating CouncilC-124FY 2013 Proposed <strong>Budget</strong> and <strong>Financial</strong> Plan
<strong>Agency</strong> Performance PlanThe agency’s performance plan has <strong>the</strong> following objectives for FY 2013:Objective 1: Improve multi-agency collaboration and planning and encourage data-driven decision making by providingCJCC members with updated information and analysis.Objective 2: Provide a multi-agency structure to facilitate strategic planning, tracking priorities, evaluating progress,generating reports, and implementing pilot projects.Objective 3: Assist member agencies with information sharing across <strong>the</strong> federal and local criminal justice system.<strong>Agency</strong> Performance MeasuresFY 2010 FY 2011 FY 2011 FY 2012 FY 2013 FY 2014Measure Actual Target Actual Projection Projection ProjectionIssue research reports within <strong>the</strong> agreedupontimeframe 100% 100% 100% 100% 100% 100%Release <strong>of</strong> Policy guidance reports in a timely manner 100% 100% 100% 100% 100% 100%Surveyed users “very satisfied” with JUSTIS experience 95% 95% 97.16% 95% 95% 95%Surveyed users respond that JUSTIS is easy tonavigate, user-friendly ”Agreed” or “Strongly Agreed” 95% 95% 94.14% 95% 95% 95%Periodic Reports on GUNSTAT sessions produced timely 100% 100% 100% 100% 100% 100%Analytical reports produced timely to supportJuvenile Stat 100% 100% 100% 100% 100% 100%JDAI Reports and Evaluations Produced timely 100% 100% 100% 100% 100% 100%FY 2013 Proposed <strong>Budget</strong> and <strong>Financial</strong> PlanCriminal Justice Coordinating CouncilC-125
(FV0)Forensic Laboratory Technician TrainingProgramwww.mpdc.dc.govTelephone: 202-727-9099% ChangeFY 2011 FY 2012 FY 2013 fromDescription Actual Approved Proposed FY 2012Operating <strong>Budget</strong> $1,791,854 $1,550,554 $0 -100.0FTEs 12.5 17.0 0.0 -100.0The Forensic Laboratory Technician Training will be absorbed into <strong>the</strong>Department <strong>of</strong> Forensic Sciences. Its mission, funding, and allfull time equivalents (FTEs) will be transferred. The total fundingamount and FTEs transferred, based on <strong>the</strong> FY 2012 Approved<strong>Budget</strong>, is $1,550,554 and 17.0 FTEs, respectively. The proposedprograms and projects for FY 2013 are shown in <strong>the</strong> Department <strong>of</strong>Forensic Sciences budget chapter within <strong>the</strong> Public Safety and JusticeAppropriation Title.The agency’s FY 2013 proposed budget is presented in <strong>the</strong> following tables:FY 2013 Proposed <strong>Budget</strong> and <strong>Financial</strong> PlanForensic Laboratory Technician Training ProgramC-127
FY 2013 Proposed Gross Funds Operating <strong>Budget</strong>, by Revenue TypeTable FV0-1 contains <strong>the</strong> proposed FY 2013 agency budget compared to <strong>the</strong> FY 2012 approved budget. It alsoprovides FY 2010 and FY 2011 actual expenditures.Table FV0-1(dollars in thousands)ChangeActual Actual Approved Proposed from PercentAppropriated Fund FY 2010 FY 2011 FY 2012 FY 2013 FY 2012 Change*General FundLocal Funds 1,293 1,191 1,551 0 -1,551 -100.0Total for General Fund 1,293 1,191 1,551 0 -1,551 -100.0Federal ResourcesFederal Payments 0 601 0 0 0 N/ATotal for Federal Resources 0 601 0 0 0 N/AGross Funds 1,293 1,792 1,551 0 -1,551 -100.0*Percent change is based on whole dollars.Note: If applicable, for a breakdown <strong>of</strong> each Grant (Federal and Private), Special Purpose Revenue type and Intra-District agreement,please refer to Schedule 80 <strong>Agency</strong> Summary by Revenue Source in <strong>the</strong> FY 2013 Operating Appendices located on <strong>the</strong> <strong>Office</strong> <strong>of</strong> <strong>the</strong><strong>Chief</strong> <strong>Financial</strong> <strong>Office</strong>r’s website.FY 2013 Proposed Full-Time Equivalents, by Revenue TypeTable FV0-2 contains <strong>the</strong> proposed FY 2013 FTE level compared to <strong>the</strong> FY 2012 approved FTE level by revenuetype. It also provides FY 2010 and FY 2011 actual data.Table FV0-2ChangeActual Actual Approved Proposed from PercentAppropriated Fund FY 2010 FY 2011 FY 2012 FY 2013 FY 2012 ChangeGeneral FundLocal Funds 14.9 12.5 17.0 0.0 -17.0 -100.0Total for General Fund 14.9 12.5 17.0 0.0 -17.0 -100.0Total Proposed FTEs 14.9 12.5 17.0 0.0 -17.0 -100.0Forensic Laboratory Technician Training ProgramC-128FY 2013 Proposed <strong>Budget</strong> and <strong>Financial</strong> Plan
FY 2013 Proposed Operating <strong>Budget</strong>, by Comptroller Source GroupTable FV0-3 contains <strong>the</strong> proposed FY 2013 budget at <strong>the</strong> Comptroller Source Group (object class) level comparedto <strong>the</strong> FY 2012 approved budget. It also provides FY 2010 and FY 2011 actual expenditures.Table FV0-3(dollars in thousands)ChangeActual Actual Approved Proposed from PercentComptroller Source Group FY 2010 FY 2011 FY 2012 FY 2013 FY 2012 Change*11 - Regular Pay - Continuing Full Time 1,007 953 1,238 0 -1,238 -100.012 - Regular Pay - O<strong>the</strong>r 7 0 0 0 0 N/A13 - Additional Gross Pay 9 17 0 0 0 N/A14 - Fringe Benefits - Current Personnel 224 190 265 0 -265 -100.015 - Overtime Pay 3 7 8 0 -8 -100.0Subtotal Personal Services (PS) 1,251 1,168 1,511 0 -1,511 -100.020 - Supplies and Materials 17 7 15 0 -15 -100.040 - O<strong>the</strong>r Services and Charges 25 5 5 0 -5 -100.041 - Contractual Services - O<strong>the</strong>r 0 601 0 0 0 N/A70 - Equipment and Equipment Rental 0 11 19 0 -19 -100.0Subtotal Nonpersonal Services (NPS) 42 624 40 0 -40 -100.0Gross Funds 1,293 1,792 1,551 0 -1,551 -100.0*Percent change is based on whole dollars.Program DescriptionPlease see <strong>the</strong> Department <strong>of</strong> Forensic Sciences (DFS) budget chapter for a description <strong>of</strong> programs related to <strong>the</strong>prior functions <strong>of</strong> <strong>the</strong> Forensic Laboratory Technician Training Program.FY 2013 Proposed <strong>Budget</strong> and <strong>Financial</strong> PlanForensic Laboratory Technician Training ProgramC-129
FY 2013 Proposed Operating <strong>Budget</strong> and FTEs, by Program and ActivityTable FV0-4 contains <strong>the</strong> proposed FY 2013 budget by program and activity compared to <strong>the</strong> FY 2012 approved budget.It also provides <strong>the</strong> FY 2011 actual data.Table FV0-4(dollars in thousands)Dollars in ThousandsFull-Time EquivalentsChangeChangeActual Approved Proposed from Actual Approved Proposed fromProgram/Activity FY 2011 FY 2012 FY 2013 FY 2012 FY 2011 FY 2012 FY 2013 FY 2012(1000) Forensic Health and Science Laboratory(1100) Forensic Health and Science Laboratory 1,191 1,551 0 -1,551 12.5 17.0 0.0 -17.0(1102) Federal Payment for FBI 601 0 0 0 0.0 0.0 0.0 0.0Subtotal (1000) Forensic Health and Science Laboratory 1,792 1,551 0 -1,551 12.5 17.0 0.0 -17.0Total Proposed Operating <strong>Budget</strong> 1,792 1,551 0 -1,551 12.5 17.0 0.0 -17.0(Change is calculated by whole numbers and numbers may not add up due to rounding)Note: For more detailed information regarding <strong>the</strong> proposed funding for <strong>the</strong> activities within this agency’s programs, please see Schedule 30-PBBProgram Summary by Activity in <strong>the</strong> FY 2013 Operating Appendices located on <strong>the</strong> <strong>Office</strong> <strong>of</strong> <strong>the</strong> <strong>Chief</strong> <strong>Financial</strong> <strong>Office</strong>r’s website.FY 2013 Proposed <strong>Budget</strong> ChangesThe Current Services Funding Level (CSFL) is a Local funds ONLY representation <strong>of</strong> <strong>the</strong> true cost <strong>of</strong> operatingDistrict agencies, before consideration <strong>of</strong> policy decisions. The CSFL reflects changes from <strong>the</strong> FY 2012 approvedbudget across multiple programs, and it estimates how much it would cost an agency to continue its current programsand operations into <strong>the</strong> following fiscal year. The initial adjustments in <strong>the</strong> budget proposal representchanges that should be compared to <strong>the</strong> FY 2013 CSFL budget and not necessarily changes made to <strong>the</strong> FY 2012Local funds budget. The FY 2013 CSFL adjustments to <strong>the</strong> FY 2012 Local funds budget are described in table 5<strong>of</strong> this agency's budget chapter. Please see <strong>the</strong> CSFL Development section within Volume 1: Executive Summaryfor more information regarding <strong>the</strong> methodology used and components that comprise <strong>the</strong> CSFL.Policy InitiativesTransfer Out: In FY 2013, <strong>the</strong> Forensic Laboratory Technician Training Program will transfer out its entire budgetand FTEs to DFS. All functions and responsibilities that currently exist in <strong>the</strong> Forensic Laboratory TechnicianTraining Program will now reside within DFS. The program description, structure, and o<strong>the</strong>r information about<strong>the</strong> consolidation are presented in DFS’ budget chapter.Forensic Laboratory Technician Training ProgramC-130FY 2013 Proposed <strong>Budget</strong> and <strong>Financial</strong> Plan
FY 2012 Approved <strong>Budget</strong> to FY 2013 Proposed <strong>Budget</strong>, by Revenue TypeTable FV0-5 itemizes <strong>the</strong> changes by revenue type between <strong>the</strong> FY 2012 approved budget and <strong>the</strong> FY 2013 proposedbudget.Table FV0-5(dollars in thousands)PROGRAM BUDGET FTELOCAL FUNDS: FY 2012 Approved <strong>Budget</strong> and FTE 1,551 17.0Fringe Benefit Rate Adjustment Forensic Health and Science Laboratory 19 0.0Consumer Price Index Forensic Health and Science Laboratory 1 0.0Personal Services Growth Factor Forensic Health and Science Laboratory 6 0.0FY 2013 Current Services Funding Level <strong>Budget</strong> (CSFL) 1,576 17.0FY 2013 Policy InitiativesTransfer Out: To <strong>the</strong> Department <strong>of</strong> Forensic Sciences Multiple Programs -1,576 -17.0LOCAL FUNDS: FY 2013 Proposed <strong>Budget</strong> and FTE 0 0.0Gross for FV0 - Forensic Laboratory Technician Training Program 0 0.0(Change is calculated by whole numbers and numbers may not add up due to rounding)FY 2013 Proposed <strong>Budget</strong> and <strong>Financial</strong> PlanForensic Laboratory Technician Training ProgramC-131
<strong>Office</strong> <strong>of</strong> UnifiedCommunications(UC0)www.ouc.dc.govTelephone: 202-730-0524% ChangeFY 2011 FY 2012 FY 2013 fromDescription Actual Approved Proposed FY 2012Operating <strong>Budget</strong> $41,783,057 $40,090,134 $44,086,790 10.0FTEs 336.9 345.0 326.8 -5.3The mission <strong>of</strong> <strong>the</strong> <strong>Office</strong> <strong>of</strong> Unified Communications (OUC) is toprovide a fast, pr<strong>of</strong>essional, and cost-effective response to emergency(911) and non-emergency (311) calls in <strong>the</strong> District. The OUC alsoprovides centralized, District-wide coordination and management <strong>of</strong>public safety voice radio technology and o<strong>the</strong>r public safety wirelessand data communication systems and resources.Summary <strong>of</strong> ServicesOUC serves as <strong>the</strong> answering point for emergency (911) and non-emergency (311) calls. OUC develops andenforces policy directives and standards regarding public safety and non-public safety communications. It handlestelephone reporting, provides audio transcribing, processes city service requests, and operates and maintains publicsafety and non-public safety voice radio technology. It also oversees all land and mobile radio systems tied to <strong>the</strong>response network, in addition to managing building facilities that support call center and public safety voice radiotechnology.The agency’s FY 2013 proposed budget is presented in <strong>the</strong> following tables:FY 2013 Proposed <strong>Budget</strong> and <strong>Financial</strong> Plan<strong>Office</strong> <strong>of</strong> Unified CommunicationsC-133
FY 2013 Proposed Gross Funds Operating <strong>Budget</strong>, by Revenue TypeTable UC0-1 contains <strong>the</strong> proposed FY 2013 agency budget compared to <strong>the</strong> FY 2012 approved budget. It alsoprovides FY 2010 and FY 2011 actual expenditures.Table UC0-1(dollars in thousands)ChangeActual Actual Approved Proposed from PercentAppropriated Fund FY 2010 FY 2011 FY 2012 FY 2013 FY 2012 Change*General FundLocal Funds 31,003 26,685 26,536 26,715 178 0.7Special Purpose Revenue Funds 15,777 13,787 12,028 16,826 4,798 39.9Total for General Fund 46,780 40,472 38,564 43,540 4,976 12.9Private FundsPrivate Grant Funds 0 0 1,280 300 -980 -76.6Total for Private Funds 0 0 1,280 300 -980 -76.6Intra-District FundsIntra-District Funds 962 1,311 246 247 0 0.1Total for Intra-District Funds 962 1,311 246 247 0 0.1Gross Funds 47,742 41,783 40,090 44,087 3,997 10.0*Percent change is based on whole dollars.Note: If applicable, for a breakdown <strong>of</strong> each Grant (Federal and Private), Special Purpose Revenue type and Intra-District agreement,please refer to Schedule 80 <strong>Agency</strong> Summary by Revenue Source in <strong>the</strong> FY 2013 Operating Appendices located on <strong>the</strong> <strong>Office</strong> <strong>of</strong> <strong>the</strong><strong>Chief</strong> <strong>Financial</strong> <strong>Office</strong>r’s website.FY 2013 Proposed Full-Time Equivalents, by Revenue TypeTable UC0-2 contains <strong>the</strong> proposed FY 2013 FTE level compared to <strong>the</strong> FY 2012 approved FTE level by revenuetype. It also provides FY 2010 and FY 2011 actual data.Table UC0-2ChangeActual Actual Approved Proposed from PercentAppropriated Fund FY 2010 FY 2011 FY 2012 FY 2013 FY 2012 ChangeGeneral FundLocal Funds 358.0 335.8 343.0 324.8 -18.2 -5.3Total for General Fund 358.0 335.8 343.0 324.8 -18.2 -5.3Intra-District FundsIntra-District Funds 0.6 1.1 2.0 2.0 0.0 0.0Total for Intra-District Funds 0.6 1.1 2.0 2.0 0.0 0.0Total Proposed FTEs 358.6 336.9 345.0 326.8 -18.2 -5.3<strong>Office</strong> <strong>of</strong> Unified CommunicationsC-134FY 2013 Proposed <strong>Budget</strong> and <strong>Financial</strong> Plan
FY 2013 Proposed Operating <strong>Budget</strong>, by Comptroller Source GroupTable UC0-3 contains <strong>the</strong> proposed FY 2013 budget at <strong>the</strong> Comptroller Source Group (object class) level comparedto <strong>the</strong> FY 2012 approved budget. It also provides FY 2010 and FY 2011 actual expenditures.Table UC0-3(dollars in thousands)ChangeActual Actual Approved Proposed from PercentComptroller Source Group FY 2010 FY 2011 FY 2012 FY 2013 FY 2012 Change*11 - Regular Pay - Continuing Full Time 16,821 15,662 17,662 17,656 -7 0.012 - Regular Pay - O<strong>the</strong>r 2,548 2,104 2,058 1,341 -716 -34.813 - Additional Gross Pay 2,015 2,086 1,556 1,789 234 15.014 - Fringe Benefits - Current Personnel 4,854 4,750 4,295 5,175 880 20.515 - Overtime Pay 1,575 1,208 833 833 0 0.0Subtotal Personal Services (PS) 27,813 25,810 26,403 26,794 390 1.520 - Supplies and Materials 150 20 177 177 0 0.030 - Energy, Comm. and Building Rentals 1,164 0 0 0 0 N/A31 - Telephone, Telegraph, Telegram, Etc. 1,743 64 1,613 1,191 -422 -26.232 - Rentals - Land and Structures 840 128 131 0 -131 -100.033 - Janitorial Services 0 39 78 0 -78 -100.034 - Security Services 962 1,613 0 0 0 N/A35 - Occupancy Fixed Costs 71 -2 0 0 0 N/A40 - O<strong>the</strong>r Services and Charges 7,960 6,456 6,912 9,277 2,365 34.241 - Contractual Services - O<strong>the</strong>r 1,729 516 3,826 1,975 -1,851 -48.470 - Equipment and Equipment Rental 5,310 7,139 951 4,674 3,723 391.6Subtotal Nonpersonal Services (NPS) 19,929 15,973 13,687 17,293 3,606 26.3Gross Funds 47,742 41,783 40,090 44,087 3,997 10.0*Percent change is based on whole dollars.Division DescriptionThe <strong>Office</strong> <strong>of</strong> Unified Communications operates through <strong>the</strong> following 6 divisions:Emergency (911) Operations – receives and processes 911 calls accurately and efficiently. Police and fire incidentsare created through Computer-Aided Dispatch (CAD) and transferred to <strong>the</strong> Fire and Emergency Medical ServicesDepartment (FEMS) and/or <strong>the</strong> Metropolitan Police Department (MPD), as well as additional agencies in <strong>the</strong>National Capital Region (NCR), by voice transmission and computer-to-computer dispatch. EmergencyOperations personnel receive ongoing training and updates through <strong>the</strong> training unit. The policy unit is also part<strong>of</strong> <strong>the</strong> division.This division contains <strong>the</strong> following 4 activities:■ 911 Call Taking – process calls for emergency response;■ 911 Dispatching – dispatches calls for emergency services to first responders <strong>of</strong> MPD and FEMS;FY 2013 Proposed <strong>Budget</strong> and <strong>Financial</strong> Plan<strong>Office</strong> <strong>of</strong> Unified CommunicationsC-135
■■911 Training – provides training to emergency call takers and dispatchers to accurately and expeditiously handlecalls for emergency service; andQuality Assurance – maintains and monitors performance.Non-Emergency (311) Operations – serves as <strong>the</strong> access point for customers seeking assistance in situations thatare not life-threatening, not serious, or not currently in progress. It is <strong>the</strong> single access number for constituents, residents,and visitors in search <strong>of</strong> District government services and information.This division contains <strong>the</strong> following 2 activities:■ Customer Service – provides customer services policies and directives and administers related quality assuranceactivities; and■ 311 Call Taking – processes calls for non-emergency city services.Technology Operations – provides centralized, District-wide coordination and management <strong>of</strong> public safety ando<strong>the</strong>r city services communication technology including voice radio, 911/311 telephony, CAD systems, customerinteraction relationship management (CIRM) systems, mobile data computing systems (MDC), and o<strong>the</strong>r technologiesincluding wireless and data communication systems and resources.This division contains <strong>the</strong> following 3 activities:■ 911 and 311 Telephone Operations – responsible for <strong>the</strong> maintenance and upkeep <strong>of</strong> all voice and datatelecommunications equipment located in two separate locations. The infrastructure consists <strong>of</strong> mission-criticalvoice, video, and data equipment staffed by engineering and technical personnel 24 hours per day, 365 daysa year;■ Radio Engineering – responsible for all radio engineering planning, coordination, implementation, and operation<strong>of</strong> <strong>the</strong> District’s Public Safety Radio Networks in order to ensure adequate support to <strong>the</strong> city’s first responders.This includes maintaining, upgrading, and supporting all radio communications for FEMS and MPD;and■ Information Technology (IT) Management – responsible for enhancing <strong>the</strong> overall operations <strong>of</strong> <strong>the</strong> OUCIT group by managing, coordinating, and updating <strong>the</strong> different processes within <strong>the</strong> IT group. ITManagement maintains all procurement and documentation for <strong>the</strong> OUC IT group and supports <strong>the</strong> agencythrough IT help desk support and application management.Transcription and Quality – provides audio transcriptions <strong>of</strong> conversations between field providers, call takers, dispatchers,and callers requesting emergency and non-emergency service to members <strong>of</strong> MPD and FEMS and o<strong>the</strong>rpublic safety and governmental organizations.<strong>Agency</strong> Management Program – provides for administrative support and <strong>the</strong> required tools to achieve operationaland programmatic results. This division is standard for all agencies using performance-based budgeting.<strong>Agency</strong> <strong>Financial</strong> Operations – provides comprehensive and efficient financial management services to, and onbehalf <strong>of</strong>, District agencies so that <strong>the</strong> financial integrity <strong>of</strong> <strong>the</strong> District <strong>of</strong> Columbia is maintained. This division isstandard for all agencies using performance-based budgeting.<strong>Office</strong> <strong>of</strong> Unified CommunicationsC-136FY 2013 Proposed <strong>Budget</strong> and <strong>Financial</strong> Plan
Division Structure ChangeThe <strong>Office</strong> <strong>of</strong> Unified Communications has no division structure changes in <strong>the</strong> FY 2013 proposed budget.FY 2013 Proposed Operating <strong>Budget</strong> and FTEs, by Division and ActivityTable UC0-4 contains <strong>the</strong> proposed FY 2013 budget by division and activity compared to <strong>the</strong> FY 2012 approved budget.It also provides <strong>the</strong> FY 2011 actual data.Table UC0-4(dollars in thousands)Dollars in ThousandsFull-Time EquivalentsChangeChangeActual Approved Proposed from Actual Approved Proposed fromDivision/Activity FY 2011 FY 2012 FY 2013 FY 2012 FY 2011 FY 2012 FY 2013 FY 2012(1000) <strong>Agency</strong> Management Program(1010) Personnel 340 269 300 31 2.9 3.0 3.0 0.0(1030) Property Management 1,763 1,893 1,207 -686 0.0 0.0 0.0 0.0(1040) Information Technology 2,001 1,057 1,763 705 0.0 0.0 0.0 0.0(1050) <strong>Financial</strong> Services 0 0 10 10 0.0 0.0 0.0 0.0(1087) Language Access 923 959 850 -110 12.7 15.0 13.0 -2.0(1090) Performance Management 687 970 943 -27 4.9 6.0 7.0 1.0No Activity Assigned 481 0 0 0 0.0 0.0 0.0 0.0Subtotal (1000) <strong>Agency</strong> Management Program 6,196 5,148 5,072 -76 20.6 24.0 23.0 -1.0(100F) <strong>Agency</strong> <strong>Financial</strong> Operations(110F) <strong>Budget</strong> Operations 126 129 140 10 1.0 1.0 1.0 0.0(120F) Accounting Operations 66 50 50 0 0.0 0.0 0.0 0.0Subtotal (100F) <strong>Agency</strong> <strong>Financial</strong> Operations 192 179 190 10 1.0 1.0 1.0 0.0(2000) Emergency Operations (911) Division(2010) 911 Call Taking Activity 6,212 8,600 8,748 147 97.9 95.0 90.8 -4.2(2020) 911 Dispatching Activity 10,464 10,295 10,001 -294 117.5 118.0 114.0 -4.0(2030) 911 Training Activity 614 327 107 -220 1.0 0.0 0.0 0.0(2040) Quality Assurance -11 90 90 0 0.0 0.0 0.0 0.0Subtotal (2000) Emergency Operations (911) Division 17,279 19,313 18,946 -367 216.4 213.0 204.8 -8.2(3000) Non-Emergency Operations (311) Division(3010) Customer Service Activity 763 617 699 82 14.8 3.0 2.0 -1.0(3020) 311 Call Taking Activity 4,186 3,415 4,158 743 38.2 65.0 69.0 4.0(3030) Telephone Reporting Activity 253 81 0 -81 15.7 1.0 0.0 -1.0Subtotal (3000) Non-Emergency Operations (311) Division 5,203 4,114 4,858 744 68.7 69.0 71.0 2.0(4000) Technology Operations Division(4010) 911 and 311 Telephone Operation Activity 1,490 5,204 2,146 -3,058 2.9 0.0 0.0 0.0(4020) Radio Engineering Activity 9,420 3,975 11,053 7,078 12.7 14.0 10.0 -4.0(4030) Information Technology Management Activity 1,153 1,422 1,525 103 7.8 12.0 11.0 -1.0No Activity Assigned 74 0 0 0 0.0 0.0 0.0 0.0Subtotal (4000) Technology Operations Division 12,136 10,601 14,724 4,123 23.5 26.0 21.0 -5.0(Continued on next page)FY 2013 Proposed <strong>Budget</strong> and <strong>Financial</strong> Plan<strong>Office</strong> <strong>of</strong> Unified CommunicationsC-137
Table UC0-4 (Continued)(dollars in thousands)Dollars in ThousandsFull-Time EquivalentsChangeChangeActual Approved Proposed from Actual Approved Proposed fromDivison/Activity FY 2011 FY 2012 FY 2013 FY 2012 FY 2011 FY 2012 FY 2013 FY 2012(5000) Transcription and Quality Division(5010) Transcription and Quality Division 776 735 298 -437 6.8 12.0 6.0 -6.0Subtotal (5000) Transcription and Quality Division 776 735 298 -437 6.8 12.0 6.0 -6.0Total Proposed Operating <strong>Budget</strong> 41,783 40,090 44,087 3,997 336.9 345.0 326.8 -18.2(Change is calculated by whole numbers and numbers may not add up due to rounding)Note: For more detailed information regarding <strong>the</strong> proposed funding for <strong>the</strong> activities within this agency’s divisions, please refer to Schedule 30-PBB Program Summary by Activity in <strong>the</strong> FY 2013 Operating Appendices located on <strong>the</strong> <strong>Office</strong> <strong>of</strong> <strong>the</strong> <strong>Chief</strong> <strong>Financial</strong> <strong>Office</strong>r’s website.FY 2013 Proposed <strong>Budget</strong> ChangesThe <strong>Office</strong> <strong>of</strong> Unified Communications’ (OUC) proposed FY 2013 gross budget is $44,086,790, which representsa 10.0 percent increase over its FY 2012 approved gross budget <strong>of</strong> $40,090,134. The budget is comprised <strong>of</strong>$26,714,501 in Local funds, $300,000 in Private Grant funds, $16,825,757 in Special Purpose Revenue funds,and $246,532 in Intra-District funds.Current Services Funding LevelThe Current Services Funding Level (CSFL) is a Local funds ONLY representation <strong>of</strong> <strong>the</strong> true cost <strong>of</strong> operatingDistrict agencies, before consideration <strong>of</strong> policy decisions. The CSFL reflects changes from <strong>the</strong> FY 2012 approvedbudget across multiple programs, and it estimates how much it would cost an agency to continue its current programsand operations into <strong>the</strong> following fiscal year. The initial adjustments in <strong>the</strong> budget proposal representchanges that should be compared to <strong>the</strong> FY 2013 CSFL budget and not necessarily changes made to <strong>the</strong> FY 2012Local funds budget. The FY 2013 CSFL adjustments to <strong>the</strong> FY 2012 Local funds budget are described in table 5<strong>of</strong> this agency's budget chapter. Please see <strong>the</strong> CSFL Development section within Volume 1: Executive Summaryfor more information regarding <strong>the</strong> methodology used and components that comprise <strong>the</strong> CSFL.OUC’s FY 2013 CSFL Local budget is $27,168,847, which represents a $632,709, or 2.4 percent, increaseover <strong>the</strong> FY 2012 approved Local funds budget <strong>of</strong> $26,536,138.Initial Adjusted <strong>Budget</strong>Cost Increase: OUC increased O<strong>the</strong>r Services and Charges in Local funds by $362. OUC continues to worktowards completing <strong>the</strong> upgrade <strong>of</strong> <strong>the</strong> P25 radio system. In support <strong>of</strong> <strong>the</strong> project, in Special Purpose Revenue(SPR) funds, Equipment has been increased by $3,723,143 and O<strong>the</strong>r Services and Charges by $2,367,438. Intra-District funds were increased by $3,381 for higher Fringe Benefits costs.<strong>Office</strong> <strong>of</strong> Unified CommunicationsC-138FY 2013 Proposed <strong>Budget</strong> and <strong>Financial</strong> Plan
Cost Decrease: In Local funds, OUC reduced Local funds personal services by $151,080 and eliminated 18.2vacant full-time equivalent (FTE) positions. The agency transferred $131,262 for Rentals and $77,521 forJanitorial Services to <strong>the</strong> Department <strong>of</strong> General Services (DGS). Private Grant funds were reduced by $979,687.In Special Purpose Revenue funds, <strong>the</strong> agency reduced Contractual Services by $871,051 to reflect <strong>the</strong> conversion<strong>of</strong> contractors to open FTE positions and decreased Telecom fixed costs by $421,774. The agency reduced $3,381in Intra-District O<strong>the</strong>r Services and Charges to compensate for <strong>the</strong> increase in Fringe Benefits.Additionally Adjusted <strong>Budget</strong>Technical Adjustments: Adjustment <strong>of</strong> Fringe Benefits to restore <strong>the</strong> District Government contribution foremployee health insurance from 72 percent, implemented in <strong>the</strong> FY 2011 budget, to 75 percent in FY 2013, resultingin an increase <strong>of</strong> $111,155 in Local funds and $223 in Intra-District funds.Policy InitiativesCost Decrease: Local funds were decreased in Overtime by $206,000 in <strong>the</strong> Emergency Operations (911) division.FY 2013 Proposed <strong>Budget</strong> and <strong>Financial</strong> Plan<strong>Office</strong> <strong>of</strong> Unified CommunicationsC-139
FY 2012 Approved <strong>Budget</strong> to FY 2013 Proposed <strong>Budget</strong>, by Revenue TypeTable UC0-5 itemizes <strong>the</strong> changes by revenue type between <strong>the</strong> FY 2012 approved budget and <strong>the</strong> FY 2013 proposedbudget.Table UC0-5(dollars in thousands)PROGRAM BUDGET FTELOCAL FUNDS: FY 2012 Approved <strong>Budget</strong> and FTE 26,536 343.0Recurring <strong>Budget</strong> Items Multiple Programs 235 0.0Consumer Price Index Multiple Programs 0 0.0Fringe Benefit Rate Adjustment Multiple Programs 300 0.0Personal Services Growth Factor Multiple Programs 98 0.0FY 2013 Current Services Funding Level <strong>Budget</strong> (CSFL) 27,169 343.0Cost Decrease: Adjustment to O<strong>the</strong>r Services and Charges (less than $500) Technology Operations Division 0 0.0Cost Decrease: Adjustments to salary, steps, Fringe Benefits Multiple Programs -151 -18.2and <strong>the</strong> elimination <strong>of</strong> vacant FTE positionsTransfer Out: Transfer <strong>of</strong> Rentals costs to DGS <strong>Agency</strong> Management Program -131 0.0Transfer Out: Transfer <strong>of</strong> Janatorial Services to DGS <strong>Agency</strong> Management Program -78 0.0FY 2013 Initial Adjusted <strong>Budget</strong> 26,809 324.8Technical Adjustment: Health insurance contribution Multiple Programs 111 0.0FY 2013 Additionally Adjusted <strong>Budget</strong> 26,921 324.8FY 2013 Policy InitiativesCost Decrease: Reduction in Overtime Emergency Operations (911) Division -206 0.0LOCAL FUNDS: FY 2013 Proposed <strong>Budget</strong> and FTE 26,715 324.8PRIVATE GRANT FUNDS: FY 2012 Approved <strong>Budget</strong> and FTE 1,280 0.0Cost Decrease: Adjustment to remaining grant funds Technology Operations Division -980 0.0FY 2013 Initial Adjusted <strong>Budget</strong> 300 0.0PRIVATE GRANT FUNDS: FY 2013 Proposed <strong>Budget</strong> and FTE 300 0.0SPECIAL PURPOSE REVENUE FUNDS: FY 2012 Approved <strong>Budget</strong> and FTE 12,028 0.0Cost Increase: Adjustment to Equipment for <strong>the</strong> purchase Multiple Programs 3,723 0.0<strong>of</strong> P25 radio upgradesCost Increase: Adjustment in O<strong>the</strong>r Services and Charges Multiple Programs 2,367 0.0to support <strong>the</strong> P25 radio system upgrade projectCost Decrease: Adjustment to Contractual Services Multiple Programs -871 0.0for <strong>the</strong> conversion <strong>of</strong> contractors to FTEsCost Decrease: Adjustment to Telephone Fixed Costs <strong>Agency</strong> Management Program -422 0.0FY 2013 Initial Adjusted <strong>Budget</strong> 16,826 0.0SPECIAL PURPOSE REVENUE FUNDS: FY 2013 Proposed <strong>Budget</strong> and FTE 16,826 0.0(Continued on next page)<strong>Office</strong> <strong>of</strong> Unified CommunicationsC-140FY 2013 Proposed <strong>Budget</strong> and <strong>Financial</strong> Plan
Table UC0-5(dollars in thousands)PROGRAM BUDGET FTEINTRA-DISTRICT FUNDS: FY 2012 Approved <strong>Budget</strong> and FTE 246 2.0Cost Increase: Adjustment to Fringe Benefits Non-Emergency Operations (311) Division 3 0.0Cost Decrease: Adjustment to O<strong>the</strong>r Services and Charges Non-Emergency Operations (311) Division -3 0.0to compensate for increases in Fringe BenefitsFY 2013 Initial Adjusted <strong>Budget</strong> 246 2.0Technical Adjustment: Health insurance contribution (less than $500) Multiple Programs 0 0.0FY 2013 Additionally Adjusted <strong>Budget</strong> 247 2.0INTRA-DISTRICT FUNDS: FY 2013 Proposed <strong>Budget</strong> and FTE 247 2.0Gross for UC0 - <strong>Office</strong> <strong>of</strong> Unified Communications 44,087 326.8(Change is calculated by whole numbers and numbers may not add up due to rounding)FY 2013 Proposed <strong>Budget</strong> and <strong>Financial</strong> Plan<strong>Office</strong> <strong>of</strong> Unified CommunicationsC-141
Homeland Security Grants(FT0)% ChangeFY 2011 FY 2012 FY 2013 fromDescription Actual Approved Proposed FY 2012Operating <strong>Budget</strong> $21,579,891 $0 $0 N/AHomeland Security Grants records Intra-District budget authorityprovided from multi-year grants from <strong>the</strong> Department <strong>of</strong> HomelandSecurity. These grants are under <strong>the</strong> purview <strong>of</strong> <strong>the</strong> Director <strong>of</strong> <strong>the</strong>District’s Homeland Security and Emergency Management <strong>Agency</strong>.Prior to FY 2005, Intra-District authority was provided within individual agency budgets. Presently, <strong>the</strong> Intra-District budget authority for homeland security is provided at <strong>the</strong> request <strong>of</strong> <strong>the</strong> Director <strong>of</strong> <strong>the</strong> Homeland Securityand Emergency Management <strong>Agency</strong> and is reflected as revised budget.This agency does not have an FY 2013 proposed budget. The agency’s FY 2010 and FY 2011 actual expendituresare presented in <strong>the</strong> following tables:FY 2013 Proposed Gross Funds Operating <strong>Budget</strong>, by Revenue TypeTable FT0-1 contains <strong>the</strong> proposed FY 2013 agency budget compared to <strong>the</strong> FY 2012 approved budget. It alsoprovides FY 2010 and FY 2011 actual expenditures.Table FT0-1(dollars in thousands)ChangeActual Actual Approved Proposed from PercentAppropriated Fund FY 2010 FY 2011 FY 2012 FY 2013 FY 2012 Change*Intra-District FundsIntra-District Funds 16,221 21,580 0 0 0 N/ATotal for Intra-District Funds 16,221 21,580 0 0 0 N/AGross Funds 16,221 21,580 0 0 0 N/A*Percent change is based on whole dollars.Note: If applicable, for a breakdown <strong>of</strong> each Grant (Federal and Private), Special Purpose Revenue type and Intra-District agreement,please refer to Schedule 80 <strong>Agency</strong> Summary by Revenue Source in <strong>the</strong> FY 2013 Operating Appendices located on <strong>the</strong> <strong>Office</strong> <strong>of</strong> <strong>the</strong><strong>Chief</strong> <strong>Financial</strong> <strong>Office</strong>r’s website.FY 2013 Proposed <strong>Budget</strong> and <strong>Financial</strong> PlanHomeland Security GrantsC-143
FY 2013 Proposed Operating <strong>Budget</strong>, by Comptroller Source GroupTable FT0-2 contains <strong>the</strong> proposed FY 2013 budget at <strong>the</strong> Comptroller Source Group (object class) level comparedto <strong>the</strong> FY 2012 approved budget. It also provides FY 2010 and FY 2011 actual expenditures.Table FT0-2(dollars in thousands)ChangeActual Actual Approved Proposed from PercentComptroller Source Group FY 2010 FY 2011 FY 2012 FY 2013 FY 2012 Change*15 - Overtime Pay 69 57 0 0 0 N/ASubtotal Personal Services (PS) 69 57 0 0 0 N/A20 - Supplies and Materials 1,082 429 0 0 0 N/A40 - O<strong>the</strong>r Services and Charges 419 460 0 0 0 N/A41 - Contractual Services - O<strong>the</strong>r 5,009 2,976 0 0 0 N/A50 - Subsidies and Transfers 5,610 -4,689 0 0 0 N/A70 - Equipment and Equipment Rental 4,032 22,346 0 0 0 N/ASubtotal Nonpersonal Services (NPS) 16,152 21,523 0 0 0 N/AGross Funds 16,221 21,580 0 0 0 N/A*Percent change is based on whole dollars.Program DescriptionHomeland Security Grants operates through <strong>the</strong> following 4 programs:Homeland Security Grants (Public Safety) – homeland security grants given to agencies that are in <strong>the</strong> PublicSafety and Justice appropriation title.Homeland Security Grants (Human Support) – homeland security grants given to agencies that are in <strong>the</strong> HumanSupport Services appropriation title.Homeland Security Grants (Government Direction) – homeland security grants given to agencies that are in <strong>the</strong>Governmental Direction and Support appropriation title.Homeland Security Grants (Public Works) – homeland security grants given to agencies that are in <strong>the</strong> PublicWorks appropriation title.Program Structure ChangeHomeland Security Grants has no program structure changes in <strong>the</strong> FY 2013 proposed budget.Homeland Security GrantsC-144FY 2013 Proposed <strong>Budget</strong> and <strong>Financial</strong> Plan
FY 2013 Proposed Operating <strong>Budget</strong> and FTEs, by Program and ActivityTable FT0-3 contains <strong>the</strong> proposed FY 2013 budget by program and activity compared to <strong>the</strong> FY 2012 approved budget.It also provides <strong>the</strong> FY 2011 actual data.Table FT0-3(dollars in thousands)Dollars in ThousandsFull-Time EquivalentsChangeChangeActual Approved Proposed from Actual Approved Proposed fromProgram/Activity FY 2011 FY 2012 FY 2013 FY 2012 FY 2011 FY 2012 FY 2013 FY 2012(2000) Homeland Security Grants (Public Safety)(FAFA) Homeland Security Grants (Police) 4,032 0 0 0 0.0 0.0 0.0 0.0(FBFB) Homeland Security Grants (Fire) 4,388 0 0 0 0.0 0.0 0.0 0.0(UCUC) Homeland Security Grants (OUC) 11,759 0 0 0 0.0 0.0 0.0 0.0Subtotal (2000) Homeland Security Grants (Public Safety) 20,178 0 0 0 0.0 0.0 0.0 0.0(3000) Homeland Security Grants (Human Support)(HCHC) Homeland Security Grants (Health) 525 0 0 0 0.0 0.0 0.0 0.0Subtotal (3000) Homeland Security Grants (Human Support) 525 0 0 0 0.0 0.0 0.0 0.0(4000) Homeland Security Grants (Government Direction)(AAAA) Homeland Security Grants (Mayor) 6 0 0 0 0.0 0.0 0.0 0.0(RSRS) Homeland Security Grants (Serve DC) 777 0 0 0 0.0 0.0 0.0 0.0Subtotal (4000) Homeland Security Grants (Gov’t Direction) 782 0 0 0 0.0 0.0 0.0 0.0(5000) Homeland Security Grants (Public Works)(KTKT) Homeland Security Grants (DPW) 94 0 0 0 0.0 0.0 0.0 0.0Subtotal (5000) Homeland Security Grants (Public Works) 94 0 0 0 0.0 0.0 0.0 0.0Total Proposed Operating <strong>Budget</strong> 21,580 0 0 0 0.0 0.0 0.0 0.0(Change is calculated by whole numbers and numbers may not add up due to rounding)Note: For more detailed information regarding <strong>the</strong> proposed funding for <strong>the</strong> activities within this agency’s programs, please see Schedule 30-PBBProgram Summary by Activity in <strong>the</strong> FY 2013 Operating Appendices located on <strong>the</strong> <strong>Office</strong> <strong>of</strong> <strong>the</strong> <strong>Chief</strong> <strong>Financial</strong> <strong>Office</strong>r’s website.FY 2013 Proposed <strong>Budget</strong> ChangesHomeland Security Grants has no changes from <strong>the</strong> FY 2012 approved budget to <strong>the</strong> FY 2013 proposed budget.FY 2013 Proposed <strong>Budget</strong> and <strong>Financial</strong> PlanHomeland Security GrantsC-145
Deputy Mayor for Public Safetyand Justice(FQ0)http://mayor.dc.govTelephone: 202-724-7173% ChangeFY 2011 FY 2012 FY 2013 fromDescription Actual Approved Proposed FY 2012Operating <strong>Budget</strong> $368,256 $22,715,649 $18,607,739 -18.1FTEs 2.8 19.0 18.3 -3.6The mission <strong>of</strong> <strong>the</strong> Deputy Mayor for Public Safety and Justice is toprovide direction, guidance, support, and coordination to <strong>the</strong>District’s public safety agencies to develop and lead interagency publicsafety initiatives that improve <strong>the</strong> quality <strong>of</strong> life in <strong>the</strong> District’s neighborhoods.Summary <strong>of</strong> ServicesThe Deputy Mayor for Public Safety and Justice was created in January 2011 to provide guidance, support, andcoordination <strong>of</strong> public safety and justice agencies <strong>of</strong> <strong>the</strong> District. For FY 2013, <strong>the</strong> role <strong>of</strong> <strong>the</strong> agency has beenexpanded to include oversight <strong>of</strong> service programs that previously had operated as independent agencies. This newstructure will enhance <strong>the</strong> oversight function and improve service delivery.The agency’s FY 2013 proposed budget is presented in <strong>the</strong> following tables:FY 2013 Proposed <strong>Budget</strong> and <strong>Financial</strong> PlanDeputy Mayor for Public Safety and JusticeC-147
FY 2013 Proposed Gross Funds Operating <strong>Budget</strong>, by Revenue TypeTable FQ0-1 contains <strong>the</strong> proposed FY 2013 agency budget compared to <strong>the</strong> FY 2012 approved budget. It alsoprovides <strong>the</strong> FY 2010 and FY 2011 actual expenditures.Table FQ0-1(dollars in thousands)ChangeActual Actual Approved Proposed from PercentAppropriated Fund FY 2010 FY 2011 FY 2012 FY 2013 FY 2012 Change*General FundLocal Funds 0 296 8,161 11,144 2,983 36.6Special Purpose Revenue Funds 0 0 3,883 1,954 -1,928 -49.7Total for General Fund 0 296 12,044 13,099 1,055 8.8Federal ResourcesFederal Grant Funds 0 0 10,462 5,317 -5,145 -49.2Total for Federal Resources 0 0 10,462 5,317 -5,145 -49.2Intra-District FundsIntra-District Funds 0 72 210 192 -18 -8.5Total for Intra-District Funds 0 72 210 192 -18 -8.5Gross Funds 0 368 22,716 18,608 -4,108 -18.1*Percent change is based on whole dollars.Note: If applicable, for a breakdown <strong>of</strong> each Grant (Federal and Private), Special Purpose Revenue type and Intra-District agreement,please refer to Schedule 80 <strong>Agency</strong> Summary by Revenue Source in <strong>the</strong> FY 2013 Operating Appendices located on <strong>the</strong> <strong>Office</strong> <strong>of</strong> <strong>the</strong><strong>Chief</strong> <strong>Financial</strong> <strong>Office</strong>r’s website.Deputy Mayor for Public Safety and JusticeC-148FY 2013 Proposed <strong>Budget</strong> and <strong>Financial</strong> Plan
FY 2013 Proposed Full-Time Equivalents, by Revenue TypeTable FQ0-2 contains <strong>the</strong> proposed FY 2013 FTE level compared to <strong>the</strong> FY 2012 approved FTE level by revenuetype. It also provides FY 2010 and FY 2011 actual data.Table FQ0-2(dollars in thousands)ChangeActual Actual Approved Proposed from PercentAppropriated Fund FY 2010 FY 2011 FY 2012 FY 2013 FY 2012 Change*General FundLocal Funds 0.0 2.8 9.4 9.2 -0.2 -2.1Total for General Fund 0.0 2.8 9.4 9.2 -0.2 -2.1Federal ResourcesFederal Grant Funds 0.0 0.0 7.6 7.3 -0.3 -3.8Total for Federal Resources 0.0 0.0 7.6 7.3 -0.3 -3.8Intra-District FundsIntra-District Funds 0.0 0.0 2.0 1.8 -0.2 -10.0Total for Intra-District Funds 0.0 0.0 2.0 1.8 -0.2 -10.0Total Proposed FTEs 0.0 2.8 19.0 18.3 -0.7 -3.6.FY 2013 Proposed <strong>Budget</strong> and <strong>Financial</strong> PlanDeputy Mayor for Public Safety and JusticeC-149
FY 2013 Proposed Operating <strong>Budget</strong>, by Comptroller Source GroupTable FQ0-3 contains <strong>the</strong> proposed FY 2013 budget at <strong>the</strong> Comptroller Source Group (object class) level comparedto <strong>the</strong> FY 2012 approved budget. It also provides FY 2010 and FY 2011 actual expenditures.Table FQ0-3(dollars in thousands)ChangeActual Actual Approved Proposed from PercentComptroller Source Group FY 2010 FY 2011 FY 2012 FY 2013 FY 2012 Change*11 - Regular Pay - Continuing Full Time 0 247 816 833 17 2.112 - Regular Pay - O<strong>the</strong>r 0 68 823 986 163 19.814 - Fringe Benefits - Current Personnel 0 39 279 291 12 4.215 - Overtime Pay 0 0 11 0 -11 -100.0Subtotal Personal Services (PS) 0 354 1,929 2,110 181 9.420 - Supplies and Materials 0 6 44 58 13 29.731 - Telephone, Telegraph, Telegram, Etc. 0 0 2 7 5 231.840 - O<strong>the</strong>r Services and Charges 0 4 168 256 88 52.641 - Contractual Services - O<strong>the</strong>r 0 0 3,350 3,150 -200 -6.050 - Subsidies and Transfers 0 0 17,214 13,026 -4,188 -24.370 - Equipment and Equipment Rental 0 5 9 2 -7 -83.0Subtotal Nonpersonal Services (NPS) 0 14 20,787 16,498 -4,289 -20.6Gross Funds 0 368 22,716 18,608 -4,108 -18.1*Percent change is based on whole dollars.Program DescriptionThe Deputy Mayor for Public Safety and Justice operates through <strong>the</strong> following 7 programs:Access to Justice - provides financial assistance to organizations and individuals who provide direct civil legal servicesto low-income and underserved District residents.This program contains <strong>the</strong> following 2 activities:■ Access to Justice – provides financial assistance to organizations and individuals who provide direct civil legalservices to low-income and under served District residents; and■ Poverty Lawyer Loan Repayment Assistance Program – provides educational loan repayment assistance tolawyers who live and work in <strong>the</strong> District <strong>of</strong> Columbia and are employed in areas <strong>of</strong> legal practice that servelow-income residents.Homeland Security/Continuity <strong>of</strong> Operation Plan (COOP) – provides direction, planning and coordination tolocal and regional partners to ensure that <strong>the</strong> Public Safety and Justice cluster is ready to respond to an emergency<strong>of</strong> any size, and implements a comprehensive COOP framework that allows Public Safety and Justice cluster agenciesto continue essential criminal justice functions during an emergency affecting normal operations.Deputy Mayor for Public Safety and JusticeC-150FY 2013 Proposed <strong>Budget</strong> and <strong>Financial</strong> Plan
<strong>Office</strong> <strong>of</strong> Victim Services – provides Federal grants and administers <strong>the</strong> District Crime Victims Assistance fund andLocal funds that support victims <strong>of</strong> domestic violence, sexual assault, homicide, child abuse, assault, and neglect byproviding safe temporary transitional housing for victims <strong>of</strong> domestic violence; coordinates with area hospitals toimprove <strong>the</strong>ir rape-trauma services and counseling; maintains outreach programs to area teens and residents regardingdynamics and impact <strong>of</strong> victimization from violent crime; and provides direction to <strong>the</strong> Executive <strong>Office</strong> <strong>of</strong> <strong>the</strong>Mayor on law and policies that enhance victims’ rights to justice, care, and safety in <strong>the</strong> aftermath <strong>of</strong> a crime.Justice Grants Administration (JGA) – receives and accounts for United States Department <strong>of</strong> Justice grants awardedto <strong>the</strong> District <strong>of</strong> Columbia and provides resources to governmental and non-governmental organizations withan emphasis on improving District public safety and justice issues. The JGA manages <strong>the</strong> life-cycle <strong>of</strong> Federal andLocal grants, sub-grants, and pass-through funds to o<strong>the</strong>r non-pr<strong>of</strong>it and government agencies in compliance withfederal and local grant guidelines. JGA is responsible for ga<strong>the</strong>ring stakeholder input and identifying cross-cuttingfunding priorities each year; identifying sub-grantees that are well-positioned to advance <strong>the</strong>se funding priorities;and providing financial, administrative, and programmatic oversight, training, and technical assistance to ensureprogram outcomes are achieved.Corrections Information Council (CIC) – provides comprehensive inspections <strong>of</strong> District prisoners and represents<strong>the</strong>ir interests and well-being in <strong>the</strong> Federal Bureau <strong>of</strong> Prisons facilities. The CIC consist <strong>of</strong> three members, twoappointed by <strong>the</strong> Mayor and one appointed by <strong>the</strong> Council <strong>of</strong> <strong>the</strong> District <strong>of</strong> Columbia.<strong>Agency</strong> Oversight – provides administrative support to <strong>the</strong> Deputy Mayor <strong>of</strong> Public Safety and Justice whileenhancing <strong>the</strong> <strong>Office</strong>’s ability to coordinate all <strong>of</strong> <strong>the</strong> agencies that report to <strong>the</strong> Deputy Mayor.Administrative Management – provides for administrative support and <strong>the</strong> required tools to achieve operationaland programmatic results. This program is standard for all agencies using performance-based budgeting.Program Structure ChangeThe Deputy Mayor for Public Safety and Justice eliminates <strong>the</strong> Motor Vehicle Theft Prevention Commissionprogram in <strong>the</strong> FY 2013 proposed budget.FY 2013 Proposed <strong>Budget</strong> and <strong>Financial</strong> PlanDeputy Mayor for Public Safety and JusticeC-151
FY 2013 Proposed Operating <strong>Budget</strong> and FTEs, by Program and ActivityTable FQ0-4 contains <strong>the</strong> proposed FY 2013 budget by program and activity compared to <strong>the</strong> FY 2012 approved budget.It also provides <strong>the</strong> FY 2011 actual data.Table FQ0-4(dollars in thousands)Dollars in ThousandsFull-Time EquivalentsChangeChangeActual Approved Proposed from Actual Approved Proposed fromProgram/Activity FY 2011 FY 2012 FY 2013 FY 2012 FY 2011 FY 2012 FY 2013 FY 2012(1000) Administrative Management Program(1070) Fleet Management 0 3 3 0 0.0 0.0 0.0 0.0(1090) Performance Management 295 649 494 -155 1.8 3.0 3.0 0.0Subtotal (1000) Administrative Management Program 295 652 497 -155 1.8 3.0 3.0 0.0(2000) <strong>Agency</strong> Oversight(2100) <strong>Agency</strong> Evaluation 1 0 0 0 0.9 0.0 0.0 0.0(FQFQ) Homeland Security Grants (DMPSJ) 72 210 212 2 0.0 2.0 2.0 0.0Subtotal (2000) <strong>Agency</strong> Oversight 73 210 212 2 0.9 2.0 2.0 0.0(2200) Access to Justice(2201) Access to Justice 0 2,951 3,002 51 0.0 0.0 0.0 0.0(2202) Loan Repayment Assistance Program 0 299 498 199 0.0 0.0 0.0 0.0Subtotal (2200) Access to Justice 0 3,250 3,500 250 0.0 0.0 0.0 0.0(3000) Homeland Security/Continuity <strong>of</strong> Operations Plan(3100) Continuity <strong>of</strong> Operation Plan 0 12 17 5 0.0 0.0 0.0 0.0Subtotal (3000) Homeland Security/Continuity <strong>of</strong> Ops. Plan 0 12 17 5 0.0 0.0 0.0 0.0(4200) <strong>Office</strong> <strong>of</strong> Victim Services(4201) Victim Services Grants 0 10,118 9,955 -163 0.0 6.0 5.6 -0.4Subtotal (4200) <strong>Office</strong> <strong>of</strong> Victim Services 0 10,118 9,955 -163 0.0 6.0 5.6 -0.4(5300) Justice Grants Administration(5301) Grants Management 0 8,094 4,298 -3,795 0.0 7.0 6.7 -0.3Subtotal (5300) Justice Grants Administration 0 8,094 4,298 -3,795 0.0 7.0 6.7 -0.3(6000) Corrections Information Council(6100) Comprehensive Inspection <strong>of</strong> D.C. Prisoners 0 130 128 -2 0.0 1.0 1.0 0.0Subtotal (6000) Corrections Information Council 0 130 128 -2 0.0 1.0 1.0 0.0(7000) Motor Vehicle Theft Prevention Commission(7100) Motor Vehicle Theft Prevention 0 250 0 -250 0.0 0.0 0.0 0.0Subtotal (7000) Motor Vehicle Theft Prevention Commission 0 250 0 -250 0.0 0.0 0.0 0.0Total Proposed Operating <strong>Budget</strong> 368 22,716 18,608 -4,108 2.8 19.0 18.3 -0.7(Change is calculated by whole numbers and numbers may not add due to rounding.)Note: If applicable, for a breakdown <strong>of</strong> each Grant (Federal and Private), Special Purpose Revenue type and Intra-District agreement,please refer to Schedule 80 <strong>Agency</strong> Summary by Revenue Source in <strong>the</strong> FY 2013 Operating Appendices located on <strong>the</strong> <strong>Office</strong> <strong>of</strong> <strong>the</strong><strong>Chief</strong> <strong>Financial</strong> <strong>Office</strong>r’s website.Deputy Mayor for Public Safety and JusticeC-152FY 2013 Proposed <strong>Budget</strong> and <strong>Financial</strong> Plan
FY 2013 Proposed <strong>Budget</strong> ChangesThe <strong>Office</strong> <strong>of</strong> Deputy Mayor For Public Safety and Justice’s (DMPSJ) proposed FY 2013 gross budget is$18,607,739, which represents a 18.1 percent decrease from its FY 2012 approved gross budget <strong>of</strong> $22,715,649.The budget is comprised <strong>of</strong> $11,144,403 in Local funds, $5,316,841 in Federal Grants funds, $1,954,352 inSpecial Purpose Revenue funds, and $192,143 Intra-District funds.Current Services Funding LevelThe Current Services Funding Level (CSFL) is a Local funds ONLY representation <strong>of</strong> <strong>the</strong> true cost <strong>of</strong> operatingDistrict agencies, before consideration <strong>of</strong> policy decisions. The CSFL reflects changes from <strong>the</strong> FY 2012 approvedbudget across multiple programs, and it estimates how much it would cost an agency to continue its current programsand operations into <strong>the</strong> following fiscal year. The initial adjustments in <strong>the</strong> budget proposal representchanges that should be compared to <strong>the</strong> FY 2013 CSFL budget and not necessarily changes made to <strong>the</strong> FY 2012Local funds budget. The FY 2013 CSFL adjustments to <strong>the</strong> FY 2012 Local funds budget are described in table 5<strong>of</strong> this agency's budget chapter. Please see <strong>the</strong> CSFL Development section within Volume 1: Executive Summaryfor more information regarding <strong>the</strong> methodology used and components that comprise <strong>the</strong> CSFL.DMPSJ’s FY 2013 CSFL budget is $8,040,893, which represents a $120,298, or 1.5 percent, decrease from<strong>the</strong> FY 2012 approved Local funds budget <strong>of</strong> $8,161,191.Initial Adjusted <strong>Budget</strong>Cost Increase: Local funds reflects increases <strong>of</strong> $55,676 to cover training costs, $5,237 for Telecom, $2,084 for projectedpersonal services and 0.2 reduction in FTEs. In Federal Grant funds, DMPSJ has increases <strong>of</strong> $18,401 forSupplies and Materials and $11,679 and 0.4 FTE in personal services.Cost Decrease: DMPSJ has a reduction <strong>of</strong> $62,997 in Local funds for Contractual Services. Federal Grant fundsinclude reductions <strong>of</strong> $3,089,377 due to <strong>the</strong> expiration <strong>of</strong> various grants awards, $9,701 for Overtime, $7,550 forEquipment, and $50 for Travel and Training. In Special Purpose Revenue, <strong>the</strong>re is a decrease <strong>of</strong> $842,317 to align<strong>the</strong> budget with revenue estimates for <strong>the</strong> Crime Victim Assistance fund. In Intra-District funds, <strong>the</strong> budgetincludes a reduction <strong>of</strong> $18,200 and 0.2 FTEs for personal services costs.Additionally Adjusted <strong>Budget</strong>Technical Adjustments: Adjustments <strong>of</strong> Fringe Benefits to restore <strong>the</strong> District Government contribution foremployee health insurance from 72 percent, implemented in <strong>the</strong> FY 2011 budget, to 75 percent in FY 2013, resultingin an increase <strong>of</strong> $3,510 in Local funds, $1,915 in Federal Grants funds, and $343 in Intra-District funds.Policy InitiativeEliminate: In Local funds, <strong>the</strong> agency will eliminate $250,000 for Motor Vehicle Theft Prevention funding. InFederal Grants funds, <strong>the</strong> D.C. Enforcing Underage Drinking grant in <strong>the</strong> amount <strong>of</strong> $299,030 and 0.1 FTE willbe eliminated in FY 2013 due to <strong>the</strong> unavailability <strong>of</strong> funds.Cost Increase: In Local funds, <strong>the</strong>re are One-Time increases <strong>of</strong> $1,100,000 for <strong>the</strong> Victim Services grants, and$1,000,000 for Domestic Violence grants. There are also increases <strong>of</strong> $900,000 for <strong>the</strong> Truancy grant funding,$250,000 to cover <strong>the</strong> Access to Justice-Loan Repayment Assistance program, and $100,000 to support <strong>the</strong>Truancy Task Force program. In Federal Grants, DMPSJ includes increases <strong>of</strong> $200,043 to cover personnel servicescost to align with FY 2013 grant awards, $31,667 in O<strong>the</strong>r Services and Charges due to grant changes, $11,855and 0.1 FTE adjustment to personal services, $11,400 to cover Subsidies and Transfers, and $8,888 for SexualAssault Services.FY 2013 Proposed <strong>Budget</strong> and <strong>Financial</strong> PlanDeputy Mayor for Public Safety and JusticeC-153
Cost Decrease: Federal Grants reflects decreases <strong>of</strong> $1,991,312 to adjust <strong>the</strong> cost <strong>of</strong> Subsidies and Transfers due toFY 2013 grant changes, $25,398 and 0.6 FTE reduction in <strong>the</strong> Justice Grant Administration program (JGA),$11,855 to adjust increases in personal services in JGA, $2,000 in Subsidies and Transfers, and $5,000 in Suppliesand Materials. The FY 2013 Special Purpose Revenue budget includes decreases <strong>of</strong> $1,086,000 to align <strong>the</strong> budget<strong>of</strong> Victim Services with expected costs.FY 2012 Approved <strong>Budget</strong> to FY 2013 Proposed <strong>Budget</strong>, by Revenue TypeTable FQ0-5 itemizes <strong>the</strong> changes by revenue type between <strong>the</strong> FY 2012 approved budget and <strong>the</strong> FY 2013 proposedbudget.Table FQ0-5(dollars in thousands)PROGRAM BUDGET FTELOCAL FUNDS: FY 2012 Approved <strong>Budget</strong> and FTE 8,161 9.4Removal <strong>of</strong> One-Time Funding Administrative -200 0.0Fringe Benefit Rate Adjustment Multiple Programs 10 0.0Consumer Price Index Multiple Programs 65 0.0Personal Services Growth Factor Multiple Programs 4 0.0FY 2013 Current Services Funding Level <strong>Budget</strong> (CSFL): 8,041 9.4Cost Increase: Training expenses Multiple Programs 56 0.0Cost Increase: Align personal services with historical spending Multiple Programs 2 -0.2Cost Increase: Telecommunication Services Multiple Programs 5 0.0Cost Decrease: Contractual Services Access to Justice -63 0.0FY 2013 Initial Adjusted <strong>Budget</strong>: 8,041 9.2Technical Adjustment: Health insurance contribution Multiple Programs 4 0.0FY 2013 Additionally Adjusted <strong>Budget</strong>: 8,044 9.2FY 2013 Policy InitiativesEliminate: To eliminate Motor Vehicle Theft Prevention funding Motor Vehicle Theft -250 0.0Prevention CommCost Increase: To increase funding for Victim Services grants <strong>Office</strong> <strong>of</strong> Victim Services 1,100 0.0- One-Time costsCost Increase: To provide additional funding for Domestic <strong>Office</strong> <strong>of</strong> Victim Services 1,000 0.0Violence grant - One-Time costsCost Increase: To provide additional funding for Truancy grants <strong>Office</strong> <strong>of</strong> Victim Services 900 0.0Cost Increase: To cover additional cost <strong>of</strong> <strong>the</strong> Access Access to Justice 250 0.0to Justice - Loan Repayment Assistance ProgramCost Increase: Additional funding for Truancy Task Force Justice Grants Administration 100 0.0LOCAL FUNDS: FY 2013 Proposed <strong>Budget</strong> and FTE 11,144 9.2FEDERAL GRANT FUNDS: FY 2012 Approved <strong>Budget</strong> and FTE 10,462 7.6Cost Increase: Supplies and Materials Multiple Programs 18 0.0Cost Increase: Align personal services with projected expenses Multiple Programs 12 0.4Cost Decrease: Various grant awards due to expire in FY 2012 Multiple Programs -3,089 0.0Cost Decrease: Less Overtime pay Justice Grants Administration -10 0.0Cost Decrease: Equipment purchases Justice Grants Administration -8 0.0Cost Decrease: Travel and Training costs (Less than $500) Multiple Programs 0 0.0FY 2013 Initial Adjusted <strong>Budget</strong> 7,385 8.0Technical Adjustment: Health insurance contribution Multiple Programs 2 0.0FY 2013 Additionally Adjusted <strong>Budget</strong>: 7,387 8.0(Continued on next page)Deputy Mayor for Public Safety and JusticeC-154FY 2013 Proposed <strong>Budget</strong> and <strong>Financial</strong> Plan
Table FQ0-5 (Continued)(dollars in thousands)PROGRAM BUDGET FTEFEDERAL GRANT FUNDS: FY 2012 Approved <strong>Budget</strong> and FTE (continued)FY 2013 Policy InitiativesEliminate: Eliminate funding for <strong>the</strong> D.C. Enforcing Underage Drinking grant Research, Analysis, and Evaluation -299 -0.1Cost Increase: Additional funding <strong>of</strong> personal services Justice Grants Administration 200 0.0to align with FY 2013 grant awardsCost Increase: To provide additional funding Justice Grants Administration 32 0.0for O<strong>the</strong>r Services and Charges due to grant changesCost Increase: To adjust personal services Justice Grants Administration 12 0.1Cost Increase: Adjustment to Subsidies and transfers Justice Grants Administration 11 0.0Cost Increase: Additional funding for Sexual Assault Services Program <strong>Office</strong> <strong>of</strong> Victim Services 9 0.0Cost Decrease: To adjust <strong>the</strong> cost <strong>of</strong> Subsidies Justice Grants Administration -1,991 0.0and Transfers due to FY 2013 grant changesCost Decrease: To reconcile with Victim Services grant Justice Grants Administration -25 -0.6Cost Decrease: To <strong>of</strong>fset increase in personal services Justice Grants Administration -12 0.0Cost Decrease: Subsidies and Transfers <strong>Office</strong> <strong>of</strong> Victim Services -2 0.0Cost Decrease: To reduce funding for supplies Justice Grants Administration -5 0.0and materialFEDERAL GRANT FUNDS: FY 2013 Proposed <strong>Budget</strong> and FTE 5,317 7.3SPECIAL PURPOSE REVENUE FUNDS: FY 2012 Approved <strong>Budget</strong> and FTE 3,883 0.0Cost Decrease: Crime Victim Assistance fund <strong>Office</strong> <strong>of</strong> Victim Services -842 0.0FY 2013 Initial Adjusted <strong>Budget</strong> 3,040 0.0FY 2013 Policy InitiativesCost Decrease: To adjust <strong>the</strong> budget <strong>of</strong> victim <strong>Office</strong> <strong>of</strong> Victim Services -1,086 0.0services due to contract cost reductionSPECIAL PURPOSE REVENUE FUNDS: FY 2013 Proposed <strong>Budget</strong> and FTE 1,954 0.0INTRA-DISTRICT FUNDS: FY 2012 Approved <strong>Budget</strong> and FTE 210 2.0Cost Decrease: Align personal services with historical <strong>Agency</strong> Oversight -18 -0.2expenditureFY 2013 Initial Adjusted <strong>Budget</strong> 192 1.8Technical Adjustment: Health insurance contribution (less than $500) Multiple Programs 0 0.0FY 2013 Additionally Adjusted <strong>Budget</strong> 192 1.8INTRA-DISTRICT FUNDS: FY 2013 Proposed <strong>Budget</strong> and FTE 192 1.8Gross for FQ0 - Deputy Mayor for Public Safety and Justic 18,608 18.3(Change is calculated by whole numbers and numbers may not add up due to rounding)FY 2013 Proposed <strong>Budget</strong> and <strong>Financial</strong> PlanDeputy Mayor for Public Safety and JusticeC-155
<strong>Agency</strong> Performance PlanThe agency’s performance plan has <strong>the</strong> following objectives for FY 2013:Objective 1: Coordinate with all <strong>the</strong> public safety and justice agencies to make sure <strong>the</strong>y stay within budget.Objective 2: Assist public safety and justice agencies in achieving <strong>the</strong>ir operational goals through monthlymeetings and reports.Objective 3: Foster a collaborative relationship with all District government agencies that allows for public safetygoals to be achieved.Objective 4: Homeland Security/ Continuity <strong>of</strong> Operation Plan (COOP) – Provide direction, planning andcoordination to local and regional partners to ensure that <strong>the</strong> Public Safety and Justice cluster is ready to respondto an emergency <strong>of</strong> any size.Objective 5: Provide financial assistance to low-income, under-deserving residents in <strong>the</strong> District.Objective 6: <strong>Office</strong> <strong>of</strong> Victim Services - administers federal and District funding to organizations that servecrime victims.Objective 7: Justice Grants Administration (JGA)- Receives and accounts for United States Department <strong>of</strong>Justice grants awarded to <strong>the</strong> District <strong>of</strong> Columbia to improve District public safety and justice issues.Objective 8: Corrections Information Council – Provides comprehensive support to <strong>the</strong> CorrectionsInformation Council.Proposed Key Performance IndicatorsFY 2010 FY 2011 FY 2011 FY 2012 FY 2013 FY 2014Measure Actual Target Actual Projection Projection ProjectionNumber <strong>of</strong> cluster agencies within budget NotAvailableNotAvailableNotAvailable 5 7 8Number <strong>of</strong> interagency initiatives implemented NotAvailableNotAvailableNotAvailable 5 6 7Number <strong>of</strong> cluster agencies that fully achieved75 percent <strong>of</strong> fiscal year performance targetsNotAvailableNotAvailableNotAvailable 5 7 8Number <strong>of</strong> cluster agencies fully achieved75 percent fiscal year initiativesNotAvailableNotAvailableNotAvailable 5 7 8Percentage <strong>of</strong> scheduled monitoring reportscompleted by cluster agenciesNotAvailableNotAvailableNotAvailable 90% 95% 100%Deputy Mayor for Public Safety and JusticeC-156FY 2013 Proposed <strong>Budget</strong> and <strong>Financial</strong> Plan
(FR0)Department <strong>of</strong> Forensic Scienceswww. mpdc.dc.govTelephone: 202-727-9099% ChangeFY 2012 FY 2013 fromDescription Approved Proposed FY 2012Operating <strong>Budget</strong> $0 $9,675,609 N/AFTEs 0.0 72.2 N/AThe Department <strong>of</strong> Forensic Services was created in January 2012 to provide guidance and support to <strong>the</strong> Metropolitan Police Department, UnitedStates Capitol Police, United States Park Police, and many <strong>of</strong> <strong>the</strong> o<strong>the</strong>r specialized law enforcement units located in <strong>the</strong> District <strong>of</strong> Columbia. The agencywas created by consolidating funding from three District agencies: <strong>the</strong> Forensic Laboratory Technician Training, <strong>the</strong> Metropolitan Police Department,and <strong>the</strong> Department <strong>of</strong> Health.The mission <strong>of</strong> <strong>the</strong> Department <strong>of</strong> Forensic Sciences (DFS) is to producehigh quality, timely, accurate, and reliable forensic science with<strong>the</strong> use <strong>of</strong> <strong>the</strong> best available technology and practices. The departmentwill focus on unbiased science and transparency with <strong>the</strong> overall goal<strong>of</strong> enhancing public health and safety.Summary <strong>of</strong> ServicesDFS provides independent analysis <strong>of</strong> evidence found at crime scenes within <strong>the</strong> District <strong>of</strong> Columbia.The independent analysis <strong>of</strong> biological pathogens, chemical, radiological, firearms, fingerprinting, DNA and traceevidence is provided by DFS to <strong>the</strong> Metropolitan Police Department, U.S. Capitol Police, U.S. Park Police, andmany <strong>of</strong> <strong>the</strong> o<strong>the</strong>r specialized law enforcement units located in <strong>the</strong> District <strong>of</strong> Columbia.DFS also provides expert witness testimony in defense <strong>of</strong> <strong>the</strong>ir analytical reports in <strong>the</strong> District’s courts <strong>of</strong> law.DFS also provides services for public health. The public health laboratory will operate within DFS, while providingdiagnostic and analytical testing for biological pathogens, chemical and radiological agents from clinical or environmentalsources.The public health lab within DFS will also provide emergency response testing. The Advisory Board will provideguidance to <strong>the</strong> development <strong>of</strong> <strong>the</strong> DFS by providing peer review to ensure that strict scientifically valid protocolsare followed and new technologies are incorporated timely.The Department <strong>of</strong> Forensic Sciences’ FY 2013 budget is presented in <strong>the</strong> following tables:FY 2013 Proposed <strong>Budget</strong> and <strong>Financial</strong> PlanDepartment <strong>of</strong> Forensic SciencesC-157
FY 2013 Proposed Gross Funds Operating <strong>Budget</strong>, by Revenue TypeTable FR0-1 contains <strong>the</strong> proposed FY 2013 agency budget compared to <strong>the</strong> FY 2012 approved budget.Table FR0-1(dollars in thousands)ChangeApproved Proposed from PercentAppropriated Fund FY 2012 FY 2013 FY 2012 Change*General FundLocal Funds 0 8,505 8,505 N/ATotal for General Fund 0 8,505 8,505 N/AFederal ResourcesFederal Grant Funds 0 431 431 N/ATotal for Federal Resources 0 431 431 N/AIntra-District FundsIntra-District Funds 0 740 740 N/ATotal for Intra-District Funds 0 740 740 N/AGross Funds 0 9,676 9,676 N/A*Percent change is based on whole dollars.Note: If applicable, for a breakdown <strong>of</strong> each Grant (Federal and Private), Special Purpose Revenue type and Intra-District agreement,please refer to Schedule 80 <strong>Agency</strong> Summary by Revenue Source in <strong>the</strong> FY 2013 Operating Appendices located on <strong>the</strong> <strong>Office</strong> <strong>of</strong> <strong>the</strong><strong>Chief</strong> <strong>Financial</strong> <strong>Office</strong>r’s website.FY 2013 Proposed Full-Time Equivalents, by Revenue TypeTable FR0-2 contains <strong>the</strong> proposed FY 2013 FTE level compared to <strong>the</strong> FY 2012 approved FTE level by revenuetype.Table FR0-2ChangeApproved Proposed from PercentAppropriated Fund FY 2012 FY 2013 FY 2012 Change*General FundLocal Funds 0.0 68.2 68.2 N/ATotal for General Fund 0.0 68.2 68.2 N/AIntra-District FundsIntra-District Funds 0.0 4.0 4.0 N/ATotal for Intra-District Funds 0.0 4.0 4.0 N/ATotal Proposed FTEs 0.0 72.2 72.2 N/A.Department <strong>of</strong> Forensic SciencesC-158FY 2013 Proposed <strong>Budget</strong> and <strong>Financial</strong> Plan
FY 2013 Proposed Operating <strong>Budget</strong>, by Comptroller Source GroupTable FR0-3 contains <strong>the</strong> proposed FY 2013 budget at <strong>the</strong> Comptroller Source Group (object class) level comparedto <strong>the</strong> FY 2012 approved budget.Table FR0-3(dollars in thousands)ChangeApproved Proposed from PercentComptroller Source Group FY 2012 FY 2013 FY 2012 Change*11 - Regular Pay - Continuing Full Time 0 5,273 5,273 N/A12 - Regular Pay - O<strong>the</strong>r 0 619 619 N/A14 - Fringe Benefits - Current Personnel 0 1,329 1,329 N/A15 - Overtime Pay 0 8 8 N/ASubtotal Personal Services (PS) 0 7,229 7,229 N/A20 - Supplies and Materials 0 789 789 N/A40 - O<strong>the</strong>r Services and Charges 0 655 655 N/A41 - Contractual Services - O<strong>the</strong>r 0 516 516 N/A50 - Subsidies and Transfers 0 172 172 N/A70 - Equipment and Equipment Rental 0 315 315 N/ASubtotal Nonpersonal Services (NPS) 0 2,446 2,446 N/AGross Funds 0 9,676 9,676 N/A*Percent change is based on whole dollars.Program DescriptionThe Department <strong>of</strong> Forensic Sciences operates through <strong>the</strong> following 4 programs:Advisory Board – comprised <strong>of</strong> nine scientists. Five published scholars, to include <strong>the</strong> fields <strong>of</strong> quality assuranceand statistics, and four forensic scientists who do not serve <strong>the</strong> District.Investigative Forensic Services – supports <strong>the</strong> evidence analysis that is typically needed by law enforcemententities within <strong>the</strong> District <strong>of</strong> Columbia.This program contains <strong>the</strong> following 5 activities:■ Administrative and Support Services – provides administrative support for <strong>the</strong> needs <strong>of</strong> <strong>the</strong> InvestigativeForensic Lab;■ Forensic Biology Unit – provides support for DNA, blood and o<strong>the</strong>r biological evidence examination forhuman identification;■ Trace Evidence Analysis – provides support for hair, fiber and o<strong>the</strong>r materials evidence identification;■ Fingerprinting Analysis – provides support for fingerprint identification; and■ Firearms and Tool Mark Examination – conducts ballistics and unique mark identification analysis oncriminal firearms evidence.FY 2013 Proposed <strong>Budget</strong> and <strong>Financial</strong> PlanDepartment <strong>of</strong> Forensic SciencesC-159
Public Health Laboratory Services – provides analytical and diagnostic support services within <strong>the</strong> District <strong>of</strong>Columbia government, as well as free and nonpr<strong>of</strong>it clinics.This program contains <strong>the</strong> following 3 activities:■ Administrative and Support Services – provides administrative and ancillary support services for <strong>the</strong> PublicHealth Laboratory;■ Biological Science Services – provides testing for naturally occurring or man-made infectious agentsresponsible for human illness or mortality; and■ Chemical Science Services – provides testing for chemical agents in clinical or environmental specimens thatnegatively impact human health.<strong>Agency</strong> Management – provides for administrative support and <strong>the</strong> required tools to achieve operational andprogrammatic results. This program is standard for all agencies using performance-based budgeting.Program Structure ChangeThe Department <strong>of</strong> Forensic Sciences is a new agency in <strong>the</strong> FY 2013 proposed budget.Department <strong>of</strong> Forensic SciencesC-160FY 2013 Proposed <strong>Budget</strong> and <strong>Financial</strong> Plan
FY 2013 Proposed Operating <strong>Budget</strong> and FTEs, by Program and ActivityTable FR0-4 contains <strong>the</strong> proposed FY 2013 budget by program and activity compared to <strong>the</strong> FY 2012 approvedbudget.Table FR0-4(dollars in thousands)Dollars in ThousandsFull-Time EquivalentsChangeChangeApproved Proposed from Approved Proposed fromProgram/Activity FY 2012 FY 2013 FY 2012 FY 2012 FY 2013 FY 2012(1000) <strong>Agency</strong> Management Program(100F) AFO 0 32 32 0.0 0.0 0.0(1010) Personnel 0 198 198 0.0 2.0 2.0(1040) Information Technology 0 96 96 0.0 1.0 1.0(1060) Legal 0 50 50 0.0 0.0 0.0(1085) Customer Service 0 350 350 0.0 1.0 1.0(1090) Performance Management 0 398 398 0.0 2.0 2.0Subtotal (1000) <strong>Agency</strong> Management Program 0 1,125 1,125 0.0 6.0 6.0(1100) Advisory Board(1110) Administrative and Support Services 0 22 22 0.0 1.0 1.0Subtotal (1100) Advisory Board 0 22 22 0.0 1.0 1.0(2000) Investigative Forensic Services(2010) Administrative and Support Services 0 1,406 1,406 0.0 8.0 8.0(2020) Forensic Biology Unit 0 1,789 1,789 0.0 11.0 11.0(2030) Trace Evidence Analysis 0 677 677 0.0 8.0 8.0(2040) Fingerprinting Analysis 0 1,182 1,182 0.0 9.0 9.0(2050) Firearms and Tool Mark Examination 0 1,382 1,382 0.0 9.0 9.0Subtotal (2000) Investigative Forensic Services 0 6,436 6,436 0.0 45.0 45.0(3000) Public Health Laboratory Services(3010) Administrative and Support Services 0 514 514 0.0 9.0 9.0(3020) Biological Science Services 0 1,363 1,363 0.0 11.2 11.2(3030) Chemical Science Services 0 215 215 0.0 0.0 0.0Subtotal (3000) Public Health Laboratory Services 0 2,093 2,093 0.0 20.2 20.2Total Proposed Operating <strong>Budget</strong> 0 9,676 9,676 0.0 72.2 72.2(Change is calculated by whole numbers and numbers may not add due to rounding)Note: For more detailed information regarding <strong>the</strong> proposed funding for <strong>the</strong> activities within this agency’s programs, please see Schedule 30-PBBProgram Summary by Activity in <strong>the</strong> FY 2013 Operating Appendices located on <strong>the</strong> <strong>Office</strong> <strong>of</strong> <strong>the</strong> <strong>Chief</strong> <strong>Financial</strong> <strong>Office</strong>r’s website.FY 2013 Proposed <strong>Budget</strong> and <strong>Financial</strong> PlanDepartment <strong>of</strong> Forensic SciencesC-161
FY 2013 Proposed <strong>Budget</strong> ChangesThe Department <strong>of</strong> Forensic Sciences’ (DFS) proposed FY 2013 gross budget is $9,675,609. The budget is comprised<strong>of</strong> $8,504,835 in Local funds, $430,520 in Federal Grant funds, and $740,253 in Intra-District funds.Policy InitiativesCreate: The following adjustments were made in Local funds: $2,584,000 to establish personal services budget and$622,293 to establish nonpersonal services budget.Cost Increase: Federal Grant funds <strong>of</strong> $430,520 were provided for DNA backlog reduction.Transfer In: Funding was transferred from several agencies, with <strong>the</strong> following breakdown: $2,796,661 from <strong>the</strong>Metropolitan Police Department; $1,582,000 from <strong>the</strong> Forensic Laboratory Technician Training Program, whichwas abolished as a result <strong>of</strong> creating this agency; and $920,000 from <strong>the</strong> Department <strong>of</strong> Health. In Intra-Districtfunds, <strong>the</strong> personal services budget was increased by $335,315, while <strong>the</strong> nonpersonal services budget was increasedby $404,938. Federal Grant funds <strong>of</strong> $430,520 were transferred from MPD to support nonpersonal servicesbudget.FY 2012 Approved <strong>Budget</strong> to FY 2013 Proposed <strong>Budget</strong>, by Revenue TypeTable FR0-5 itemizes <strong>the</strong> changes by revenue type between <strong>the</strong> FY 2012 approved budget and <strong>the</strong> FY 2013 proposedbudget.Table FR0-5(dollars in thousands)PROGRAM BUDGET FTELOCAL FUNDS: FY 2012 Approved <strong>Budget</strong> and FTE 0 0.0FY 2013 Policy InitiativesCreate: Establish personal services budget for new Multiple Programs 2,584 12.2agency - Department <strong>of</strong> Forensic SciencesCreate: Establish new agency Department <strong>of</strong> Forensic Multiple Programs 622 0.0Sciences-Nonpersonal servicesTransfer In: From Metropolitan Police Department Investigative Forensic Services 2,797 27.0Transfer In: From Forensic Laboratory Technician Training Program Investigative Forensic Services 1,582 17.0Transfer In: From Department <strong>of</strong> Health Public Health Laboratory Services 920 9.0Adjust: Align personal Services with <strong>the</strong> agency's <strong>Agency</strong> Management 0 3.0budgetary needsProgramLOCAL FUNDS: FY 2013 Proposed <strong>Budget</strong> and FTE 8,505 68.2FEDERAL GRANT FUNDS: FY 2012 Approved <strong>Budget</strong> and FTE 0 0.0FY 2013 Policy InitiativesCost Increase: DNA backlog reduction Federal Grant Investigative Forensic Services 431 0.0FEDERAL GRANT FUNDS: FY 2013 Proposed <strong>Budget</strong> and FTE 431 0.0INTRA-DISTRICT FUNDS: FY 2012 Approved <strong>Budget</strong> and FTE 0 0.0FY 2013 Policy InitiativesTransfer In: Align FTEs and budget with personal services costs Multiple Programs 335 0.0Transfer In: Nonpersonal services budget Multiple Programs 405 4.0INTRA-DISTRICT FUNDS: FY 2013 Proposed <strong>Budget</strong> and FTE 740 4.0Gross for FR0 - Department Of Forensic Sciences 9,676 72.3(Change is calculated by whole numbers and numbers may not add up due to rounding)<strong>Agency</strong> Performance PlanThe Department <strong>of</strong> Forensic Sciences is a new agency, and <strong>the</strong> agency’s performance plan is under development.Once <strong>the</strong> plan is developed, it will be posted to <strong>the</strong> <strong>Office</strong> <strong>of</strong> <strong>the</strong> City Administrator’s webpage.Department <strong>of</strong> Forensic SciencesC-162FY 2013 Proposed <strong>Budget</strong> and <strong>Financial</strong> Plan
THE GOVERNMENT OF THEDISTRICT OF COLUMBIA<strong>Office</strong> <strong>of</strong> <strong>the</strong> <strong>Chief</strong> <strong>Financial</strong> <strong>Office</strong>r | <strong>Office</strong> <strong>of</strong> <strong>Budget</strong> and Planning1350 Pennsylvania Avenue, Suite 229 | Washington, DC 20004 | 202.727.6234 | Fax 202.727.1400www.cfo.dc.gov | www.dc.gov