High-Pressure Volumetric Analyzer - Particulate Systems
High-Pressure Volumetric Analyzer - Particulate Systems
High-Pressure Volumetric Analyzer - Particulate Systems

Create successful ePaper yourself
Turn your PDF publications into a flip-book with our unique Google optimized e-Paper software.
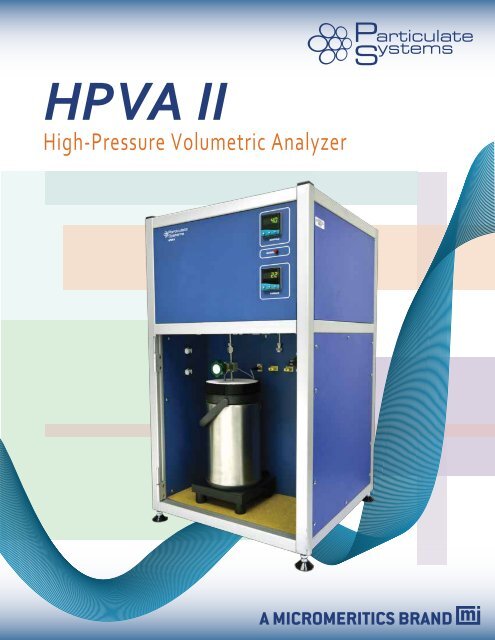
<strong>High</strong>-<strong>Pressure</strong> <strong>Volumetric</strong> <strong>Analyzer</strong>
<strong>High</strong>-<strong>Pressure</strong> <strong>Volumetric</strong> AnalysisHPVA II Benefits・Dual free-space measurement for accurateisotherm data・Free space can be measured or entered・Correction for non-ideality of analysis gas usingNIST REFPROP compressibility factors calculatedfrom multiple equations of state・Reports provided as interactive spreadsheets・Isotherm and weight percentage plots createdautomatically・Tables of raw data used for report calculations・Real-time charts for <strong>Pressure</strong> vs. Time andTemperature vs. Time・Gas mixtures with up to three components can beused・Kinetic data provided for rate of adsorpotioncalculations・Langmuir equation used to model Type I isotherms・<strong>High</strong>-precision, solid-state design high-pressuretransducer provides a reading accuracy of±0.04% full scale with a stablility of ±0.1%<strong>High</strong>-<strong>Pressure</strong>Speciality ApplicationsThe HPVA II Series of adsorption analyzers from <strong>Particulate</strong> <strong>Systems</strong>uses the static volumetric method to obtain high-pressure adsorptionand desorption isotherms utilizing gases such as hydrogen, methane,and carbon dioxide.The volumetric technique consists of introducing [dosing] a knownamount of gas [adsorptive] into the chamber containing the sampleto be analyzed. When the sample reaches equilibrium with theadsorbate gas, the final equilibrium pressure is recorded. These dataare then used to calculate the quantity of gas adsorbed by the sample.This process is repeated at given pressure intervals until themaximum preselected pressure is reached. Then the pressure can bedecreased to provide a desorption isotherm. Each of the resultingequilibrium points [volume adsorbed and equilibrium pressure] is plottedto provide an isotherm.Excellent reproducibility and accuracy are obtained by using separatetransducers for monitoring low and high pressures.・Low-pressure pressure transducer provides areading accuracy of ±0.15% of value・System can attain a maximum pressure of 200 bar・Hydrogen gas sensor automatically shuts downthe system should a hydrogen leak occur・BET surface area, Langmuir surface area, and totalpore volume calculations included
Typical HPVA II ApplicationsCarbon DioxideSequestrationEvaluating the quantity of carbon dioxidethat can be adsorbed by carbons andother materials is important in theongoing study of carbon dioxidesequestration. <strong>High</strong> pressures obtainedwith the HPVA II can simulate theunderground conditions of sites whereCO2 is to be injected. Configuring theHPVA II with a chiller/heater bath allowsthe user to evaluate the CO2 uptake at arange of stable temperatures, providingdata that can be used to calculate heatsof adsorption. These isotherms aretypically analyzed up to approximately50 bar at near ambient temperaturesdue to CO2 condensation at higherpressures.Shale Gas<strong>High</strong>-pressure methane can be dosedonto shale samples to generateadsorption and desorption isotherms.This provides the methane capacity ofthe shale at specific pressures andtemperatures. The adsorption isothermcan be used to calculate the Langmuirsurface area and volume of the shale.The Langmuir surface area is thesurface area of the shale assumingthat the adsorbate gas forms a singlelayer of molecules. The Langmuirvolume is the uptake of methane atinfinite pressure − the maximumpossible volume of methane that canbe adsorbed to the surface of thesample.Coal-Bed MethanePorous coal samples from undergroundbeds can be analyzed with the HPVA II todetermine their methane capacity at highpressures. This allows the user to find themethane adsorption and desorptionproperities of the underground coal beds,which is useful in determiningapproximate amounts of hydrocarbonsavailable in coal-bed reserves. Kinetic datafrom the experiments can also show therate of metane adsorption and desorptionon these porous carbon samples atspecific pressures and temperatures.Hydrogen StorageDetermining the hydrogen storagecapacity of materials such as porouscarbons and metal organic frameworks(MOFs) is pivotal in the modern demandfor clean energy sources. These materialsare ideally suited for storage becausethey allow you to safely adsorb anddesorb the hydrogen. Stored adsorbedhydrogen in MOFs has a higher energydensity by volume than a gaseoushydrogen and does not require thecryogenic temperatures needed tomaintain hydrogen in a liquid state. TheHPVA II software provides a weightpercentage plot that illustrates theamount of gas adsorbed at a givenpressure as a function of the samplemass − the standard method for reviewinga sample’s hydrogen storage capacity.HPVA II Features・Wide Operating <strong>Pressure</strong> range:<strong>High</strong> Vacuum to 100 or 200 bar・Broad Temperature Capability:From cryogenic to 500 °C・Excellent control of sampletemperature by means of arecirculating temperature bath,cryogen dewar, or furnace・Manifold temperature controlledwith heater for stability andaccuracy・Fully automated analysis usinginteractive software・Excellent data reproducibility・Handles typical adsorbates suchas nitrogen, hydrogen, methane,argon, oxygen, and carbondioxide・Comprehensive Data Analysispackage using Microsoft® Excel®macros for data processing andgraphing・Softwareincludes NIST REFPROP
HPVA II SystemFour Methods ofSample Temperature Control・Refrigerated/heated recirculation vessel [customer provides temperature control bath]・Four-liter, stainless-steel dewar for liquid cryogen・Furnance allows for experiments ranging up to 500 °C・Cryostat can precisely control sample temperatures from ambient conditions to 30 KManifoldAll the valves in the manifold arepneumatically operated, high-pressurevalves with Kel-F® seats. Valve tubing isconstructed with heavy wall, 316Lstainless steel and is attached via a VCRconnection or welded. The temperatureof the insulated manifold region isstabilized using a heater controlled byan adjustable PID controller.<strong>Pressure</strong> TransducersTwo transducers are used to preciselymeasure the system pressure. A 1000-torr transducer is used to accuratelymonitor pressures below 1 atmosphereand is protected from high pressurewith an isolation valve and a crackingvalve that relieves to the vent.HIGH PRESSURETRANSDUCERLOW PRESSURETRANSDUCERSYSTEM SCHEMATICVACUUMGAUGEDEGASFURNACE<strong>Pressure</strong> (bar)Servo ValvesThe servo valves are used toautomatically regulate flowof the gas in the manifold tothe vent and vacuum.Vacuum SystemConsists of a mechanicalpump and internal Piranivacuum gauge. User canprovide their own pump orpurchase the high-vacuumturbo pump package.
Supplemental HPVA II Reporting30.0025.00H2 Uptake on Cu(BTC) at 100K, Kinetic Data<strong>Pressure</strong> (bar)20.0015.0010.00<strong>Pressure</strong> (bar)15.40015.35015.30015.2505.000.00200.0 220.0 240.0 260.0 280.0 300.0 320.0 340.0Time (min)H2 Uptake on Cu(BTC) at 100 K, Kinetic Data1.415.20015.150317.80 318.00 318.20 318.40 318.60 318.80 319.00Time (min)H2 Uptake on Cu(BTC) at 100 K, Kinetic DataThe decrease in pressure indicates the adsorption of the gas.Vol Ads/g (cc STP)Vol Ads as Weight Percentage1.210.80.60.40.200 20 40 60 80 100 120 140 160 180 200<strong>Pressure</strong> (Bar)Weight Percentage Uptake of H2 on MOF (CuBTC)450400Data ReductionThe HPVA II software uses a NationalInstruments data acquisition interface tocommunicate with the analyzer. The dataacquired during analyses are written tofiles that are read by a macro written inMicrosoft Excel.The macro uses the temperature andpressure data to obtain the correspondingcompressibility factors from NISTREFPROP software to correct for thenon-ideality of the high-pressure gases.Data reduction using the Excel macroprovides reports as interactive spreadsheetswhich list the temperature andpressure data used for volume adsorbedcalculations as well as excess isotherm,weight percentage, Langmuir theory,kinetic data plots, BET surface area, andtotal pore volume.Vol Ads/g (cc STP)3503002502001501005000.0 0.1 0.2 0.3 0.4 0.5 0.6 0.7 0.8 0.9 1.0<strong>Pressure</strong> (Bar)<strong>Pressure</strong> (Bar)Nitrogen on Silica Alumina1/[Q(Po/P - 1)]0.160.140.120.100.080.060.040.020.000.00 0.05 0.10 0.15 0.20 0.25 0.30Relative <strong>Pressure</strong> (P/Po)BET Surface Area Plot, SiAl
HPVA II ReportingCO28018070160Vol Ads/g (cc STP)605040302025C 50C Ads Des50C DesVol Ads/g (cc STP)14012010080604030C Ads50C Ads70C Ads102000 5 10 15 20 25 30 35 40 45<strong>Pressure</strong> (Bar)<strong>Pressure</strong> (Bar)Two Molecular Sieves at 25 °C00 5 10 15 20 25 30 35 40 45<strong>Pressure</strong> (Bar)<strong>Pressure</strong> (Bar)Microporous Carbon at Various Temperatures140120Vol Ads/g (cc STP)100806040200C25C50C00 5 10 15 20 25 30 35 40 45<strong>Pressure</strong> (Bar)Zeolite 5A at Various Temperatures140120CH4Vol Ads/g (cc STP)1008060402030C40C50C60C00 20 40 60 80 100 120<strong>Pressure</strong> (Bar)S-III Microporous Carbon at Various Temperatures256Vol Ads/g (cc STP)2015105030C40C50C<strong>Pressure</strong> (Bar)0 10 20 30 40 50 60Six Different Coal Bed Samples at 30 °CCBM1CBM2CBM3CBM4CBM5CBM6Vol Ads/g (cc STP)Vol Ads/g (cc STP)5432100 20 40 60 80 100<strong>Pressure</strong> (Bar)Four Different Shales at 25 °CShale1Shale2Shale3Shale 4
Additional HPVA II ReportingH2700900700600Vol Ads/g (cc STP)800700600500400300200Zeolite 5AMOF (CuBTC)Microporous CarbonVol Ads/g (cc (cc STP) STP)600500500400400300300200200100AC1 AdsAC2 Ads10010000 1 2 3 4 5 6 7 8 9 10<strong>Pressure</strong> (Bar)H2 Uptake at 30KVarious Materials at 30 K00 0 20 40 60 80 100 120 140 160 180 200<strong>Pressure</strong> (Bar)0 20 40 60 80 100 120 140 160 180 200<strong>Pressure</strong> (Bar)Two Activated Carbons at 77 K140120Vol Ads/g (cc STP)10080604020CryostatFor extensive hydrogen storage studies at high pressures andlow temperatures, the HPVA II can be interfaced with a cryostatto control analysis temperatures down to 30 K with a stabilityof ±0.003 K. The cryostat does not require liquid cryogens foroperation; instead, it utilizes the Gifford-McMahon refrigerationcycle where pressurized helium is supplied from a compressorto produce cold temperatures. The HPVA II software communicatesdirectly with the cryostat temperature controller allowingfor precise temperature measurements recorded over theduration of the adsorption experiment. Generating hydrogenadsorption isotherms at multiple cryogenic temperaturespresents researchers the advantage of more accuratelycalculating the isosteric heats of adsorption of hydrogen ontheir materials of study.00 20 40 60 80 100 120 140 160 180 200<strong>Pressure</strong> (Bar)MOF (CuBTC) at O °C
Specifications° °°°©All Rights Reserved 2013. <strong>Particulate</strong> <strong>Systems</strong>. Norcross GA 30093. Printed in U.S.A.PO2/42700/00