A Multichannel Approach to Fingerprint Classification
A Multichannel Approach to Fingerprint Classification
A Multichannel Approach to Fingerprint Classification

You also want an ePaper? Increase the reach of your titles
YUMPU automatically turns print PDFs into web optimized ePapers that Google loves.
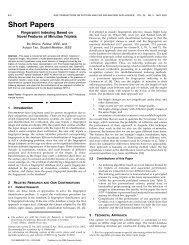
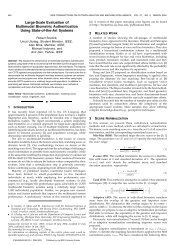
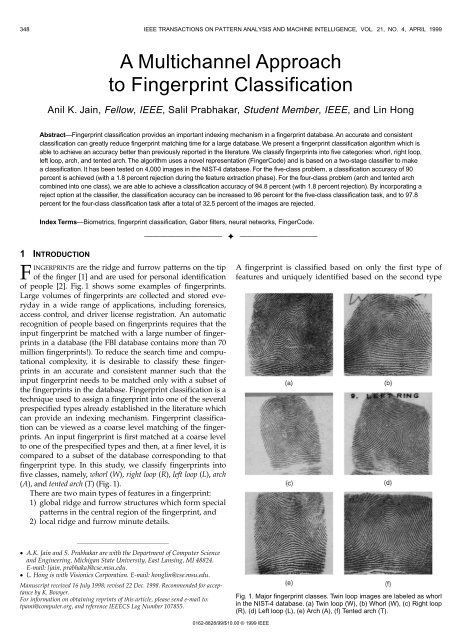
348 IEEE TRANSACTIONS ON PATTERN ANALYSIS AND MACHINE INTELLIGENCE, VOL. 21, NO. 4, APRIL 1999A <strong>Multichannel</strong> <strong>Approach</strong><strong>to</strong> <strong>Fingerprint</strong> <strong>Classification</strong>Anil K. Jain, Fellow, IEEE, Salil Prabhakar, Student Member, IEEE, and Lin HongAbstract—<strong>Fingerprint</strong> classification provides an important indexing mechanism in a fingerprint database. An accurate and consistentclassification can greatly reduce fingerprint matching time for a large database. We present a fingerprint classification algorithm which isable <strong>to</strong> achieve an accuracy better than previously reported in the literature. We classify fingerprints in<strong>to</strong> five categories: whorl, right loop,left loop, arch, and tented arch. The algorithm uses a novel representation (FingerCode) and is based on a two-stage classifier <strong>to</strong> makea classification. It has been tested on 4,000 images in the NIST-4 database. For the five-class problem, a classification accuracy of 90percent is achieved (with a 1.8 percent rejection during the feature extraction phase). For the four-class problem (arch and tented archcombined in<strong>to</strong> one class), we are able <strong>to</strong> achieve a classification accuracy of 94.8 percent (with 1.8 percent rejection). By incorporating areject option at the classifier, the classification accuracy can be increased <strong>to</strong> 96 percent for the five-class classification task, and <strong>to</strong> 97.8percent for the four-class classification task after a <strong>to</strong>tal of 32.5 percent of the images are rejected.Index Terms—Biometrics, fingerprint classification, Gabor filters, neural networks, FingerCode.——————————F——————————1 INTRODUCTIONFINGERPRINTS are the ridge and furrow patterns on the tipof the finger [1] and are used for personal identificationof people [2]. Fig. 1 shows some examples of fingerprints.Large volumes of fingerprints are collected and s<strong>to</strong>red everydayin a wide range of applications, including forensics,access control, and driver license registration. An au<strong>to</strong>maticrecognition of people based on fingerprints requires that theinput fingerprint be matched with a large number of fingerprintsin a database (the FBI database contains more than 70million fingerprints!). To reduce the search time and computationalcomplexity, it is desirable <strong>to</strong> classify these fingerprintsin an accurate and consistent manner such that theinput fingerprint needs <strong>to</strong> be matched only with a subset ofthe fingerprints in the database. <strong>Fingerprint</strong> classification is atechnique used <strong>to</strong> assign a fingerprint in<strong>to</strong> one of the severalprespecified types already established in the literature whichcan provide an indexing mechanism. <strong>Fingerprint</strong> classificationcan be viewed as a coarse level matching of the fingerprints.An input fingerprint is first matched at a coarse level<strong>to</strong> one of the prespecified types and then, at a finer level, it iscompared <strong>to</strong> a subset of the database corresponding <strong>to</strong> thatfingerprint type. In this study, we classify fingerprints in<strong>to</strong>five classes, namely, whorl (W), right loop (R), left loop (L), arch(A), and tented arch (T) (Fig. 1).There are two main types of features in a fingerprint:1) global ridge and furrow structures which form specialpatterns in the central region of the fingerprint, and2) local ridge and furrow minute details.A fingerprint is classified based on only the first type offeatures and uniquely identified based on the second type²²²²²²²²²²²²²²²²œ A.K. Jain and S. Prabhakar are with the Department of Computer Scienceand Engineering, Michigan State University, East Lansing, MI 48824.E-mail: {jain, prabhaka}@cse.msu.edu.œ L. Hong is with Visionics Corporation. E-mail: honglin@cse.msu.edu.Manuscript received 16 July 1998; revised 22 Dec. 1998. Recommended for acceptanceby K. Bowyer.For information on obtaining reprints of this article, please send e-mail <strong>to</strong>:tpami@computer.org, and reference IEEECS Log Number 107855.Fig. 1. Major fingerprint classes. Twin loop images are labeled as whorlin the NIST-4 database. (a) Twin loop (W), (b) Whorl (W), (c) Right loop(R), (d) Left loop (L), (e) Arch (A), (f) Tented arch (T).0162-8828/99/$10.00 © 1999 IEEE
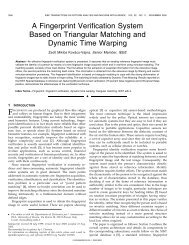
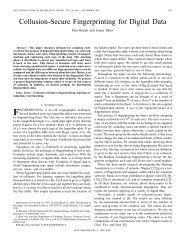
JAIN ET AL.: A MULTICHANNEL APPROACH TO FINGERPRINT CLASSIFICATION 349Fig. 2. Orientation field, thinned ridges, minutiae, and singular points. (a) Gray scale image. (b) Orientation field. (c) Thinned ridges. (d) Minutiae(†), Core (), and Delta (D).of features (one such feature is the ridge endings and bifurcations,also known as minutiae). See Fig. 2 for examples ofridges, minutiae, orientation field, and singular points in afingerprint image.Several approaches have been developed for au<strong>to</strong>maticfingerprint classification. These approaches can be broadlycategorized in<strong>to</strong> four main categories:1) model-based,2) structure-based,3) frequency-based, and4) syntactic.The model-based fingerprint classification technique usesthe locations of singular points (core and delta) <strong>to</strong> classify afingerprint in<strong>to</strong> the five above-mentioned classes [3], [4]. Amodel-based approach tries <strong>to</strong> capture the knowledge of ahuman expert by deriving rules for each category by handconstructingthe models and therefore, does not requiretraining. Accuracies of 85 percent [3] and 87.5 percent [4]have been reported on the NIST-4 database [5] using theseapproaches. A structure-based approach uses the estimatedorientation field in a fingerprint image <strong>to</strong> classify the fingerprintin<strong>to</strong> one of the five classes. An accuracy of 90.2 percentwith 10 percent rejection is reported on NIST-4 [6]. Theneural network used in [6] was trained on images from2,000 fingers (one image per finger) and then tested on anindependent set of 2,000 images taken from the same fingers.The error reported is, thus, optimistically biased. Alater version of this algorithm [7] was tested on the NIST-14database, which is a naturally distributed database, resultingin a better performance. However, this performance improvementshould be expected since the NIST-14 databasecontains only a small percentage of arch-type fingerprints,which pose the most difficulty for fingerprint classifiers andthe neural network used in the algorithm implicitly takesadvantage of this information. A similar structure-basedapproach, which uses hidden Markov models for classification[8], depends on a reliable estimation of ridge locations,which is difficult in noisy images. In another structure-basedapproach, B-spline curves are used <strong>to</strong> representand classify fingerprints [9]. A syntactic approach uses aformal grammar <strong>to</strong> represent and classify fingerprints [10].Frequency-based approaches use the frequency spectrum ofthe fingerprints for classification [11]. Hybrid approachescombine two or more approaches for classification [12], [13].These approaches show some promise but have not beentested on large databases. For example, Chong et al. [9] reportresults on 89 fingerprints, Fitz and Green [11] on 40 fingerprints,and Kawagoe and Tojo [13] on 94 fingerprints.Most of the category information about a fingerprint iscontained in the central part of the fingerprint. The modelbasedtechniques which use both the core and delta points
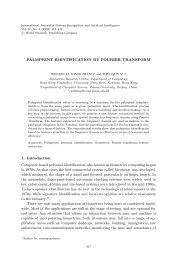
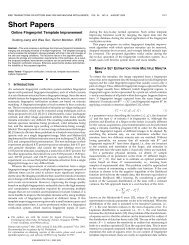
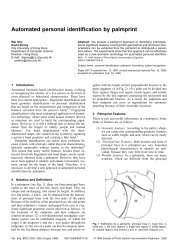
350 IEEE TRANSACTIONS ON PATTERN ANALYSIS AND MACHINE INTELLIGENCE, VOL. 21, NO. 4, APRIL 1999Fig. 3. Flow diagram of our fingerprint classification algorithm.for classification require that these singular points be presentin the image. The dab fingerprint images obtained by opticalscanners do not always capture the entire fingerprint andoften have the delta point(s) missing. The new solid-statefingerprint capture devices are small in size and so, captureonly a part of the fingerprint (e.g., the FPS100 solid-state sensorfrom Veridicom is about the size of a postage stamp).Also, the core or delta point(s) are difficult <strong>to</strong> detect in noisyfingerprint images. There is, however, sufficient informationavailable in the ridge pattern itself <strong>to</strong> classify a fingerprint.While the structure-based approach does not depend uponthe core or delta points, it requires a reliable estimate of theorientation field which is again very difficult <strong>to</strong> obtain in lowquality fingerprint images.We propose a fingerprint classification algorithm (Fig. 3)based on a novel representation scheme which is directlyderived from local ridge structures. The representation doesnot use the core, delta, and orientation field, explicitly. It ismore capable of <strong>to</strong>lerating poor image quality, which is amajor difficulty in fingerprint classification.The main steps of our classification algorithm are asfollows:1) Locate a registration point in the input image and definea spatial tessellation of the region around theregistration point (sec<strong>to</strong>rs).2) Decompose the input image in<strong>to</strong> a set of componentimages, each of which preserves certain ridge structures;compute the standard deviation of the componentimages in each sec<strong>to</strong>r <strong>to</strong> generate the featurevec<strong>to</strong>r (called FingerCode).3) Feed the feature vec<strong>to</strong>r in<strong>to</strong> a classifier; in our algorithm,a two-stage classifier is used.This two-stage classifier uses a K-nearest neighbor classifierin its first stage and a set of neural network classifiers in itssecond stage <strong>to</strong> classify a feature vec<strong>to</strong>r in<strong>to</strong> one of the fivefingerprint classes.In the following sections, we will present the details ofour fingerprint classification algorithm. Section 2 presentsour feature extraction scheme. In Section 3, we present ourclassification scheme. In Section 4, we present our experimentalresults on the NIST-4 database. The conclusions andfuture research directions are presented in Section 5.2 FEATURE EXTRACTIONThe category of a fingerprint is determined by its globalridge and furrow structures. A valid feature set for fingerprintclassification should be able <strong>to</strong> capture this global informationeffectively. We have developed a novel representationscheme (FingerCode) which is able <strong>to</strong> represent
JAIN ET AL.: A MULTICHANNEL APPROACH TO FINGERPRINT CLASSIFICATION 351both the minute details and the global ridge and furrowstructures of a fingerprint. For the purpose of classification,we use a low-level representation which is very effective inrepresenting the global ridge and furrow structures andwhich is invariant <strong>to</strong> individual minute details.The main steps of our feature extraction algorithm are asfollows:1) Find a registration point (center point) and define aspatial tessellation of the image space around the registrationpoint (represented by a collection of sec<strong>to</strong>rs).2) Decompose the input image in<strong>to</strong> a set of componentimages, which preserve global ridge and furrowstructures.3) Compute the standard deviation of gray level valuesin each sec<strong>to</strong>r <strong>to</strong> form the feature vec<strong>to</strong>r or theFingerCode.Let I(x, y) denote the gray level at pixel (x, y) in an M Nfingerprint image and let (x c , y c ) denote the center point.The spatial tessellation of the image space which consists ofthe region of interest is defined by a collection of sec<strong>to</strong>rs S i ,where the ith sec<strong>to</strong>r S i is computed in terms of parameters(r, q) as follows:S i = {(x, y)|b(T i + 1) ˆ r < b(T i + 2), q i ˆ q < q i+1 ,1 ˆ x ˆ N, 1 ˆ y ˆ M }, (1)whereT i = i div k, (2)p= 2 7 2 , (3)k qii mod k2 c7 2 c72 2r = x - x + y - y , (4)--q = tan 1 y yx - xcc, (5)b is the width of each band and k is the number of sec<strong>to</strong>rsconsidered in each band. We use six concentric bandsaround the center point. Each band is 20-pixels wide (b = 20),and segmented in<strong>to</strong> eight sec<strong>to</strong>rs (k = 8) (Fig. 4). The innermostband is not used for feature extraction because the sec<strong>to</strong>rsin the region near the center contain very few pixels.Thus, a <strong>to</strong>tal of 8 6 = 48 sec<strong>to</strong>rs (S 0 through S 47 ) are defined.2.1 Center Point LocationAny point that can be consistently detected in a fingerprintimage can be used as a registration point (or center point becausewe prefer this point <strong>to</strong> be positioned at the center of theimage). In a fingerprint image, the core point presents such aconsistent point. Therefore, in our algorithm, we define corepoint as the center point (x c , y c ). We used the core point detectionalgorithm described in [4] which is presented below.1) Estimate the orientation field 2 using the least squareorientation estimation algorithm [14]. Orientationfield 2 is defined as an N N image, where 2(i, j)represents the local ridge orientation at pixel (i, j). Animage is divided in<strong>to</strong> a set of w w nonoverlappingwindows and a single local orientation is defined foreach window.2) Smooth the orientation field in a local neighborhood. Letthe smoothed orientation field be represented as 2 ‡.3) Initialize $, a label image used <strong>to</strong> indicate the corepoint.4) For each pixel (i, j) in 2 ‡, compute the Poincaré indexand assign the corresponding pixels in $ a value ofone if the Poincaré index is (1/2). The Poincaré index atpixel (i, j) enclosed by a digital curve, which consistsof a sequence of pixels that are on or within a distanceof one pixel apart from the corresponding curve, iscomputed as follows:N -1Y 1Poincaré1i,j6 = Ê D1k6, (6)2pD( k)=k = 0% 16 16&K'K 16pd k , if d k
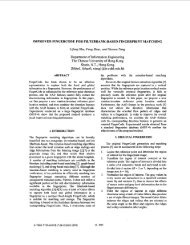
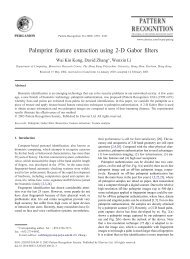
352 IEEE TRANSACTIONS ON PATTERN ANALYSIS AND MACHINE INTELLIGENCE, VOL. 21, NO. 4, APRIL 1999Fig. 5. Gabor filters (size = 33 33, f = 0.1, d x = 4.0, d y = 4.0). (a) 0° orientation. (b) 45° orientation. (c) 90° orientation. (d) 135° orientation.(the upper core). If only one core is detected, the centeris assigned the coordinates of the core point.8) If no core point is detected, compute the covariancematrix of the vec<strong>to</strong>r field in a local neighborhood (q q)of each point in the orientation field. Define a featureimage ) with the largest eigenvalue of the covariancematrix for each element in the orientation image. Acore is detected at the centroid of the largest connectedcomponent in the thresholded image of ) andthe center is assigned the coordinates of the core.The center found above is shifted 40 pixels down forfurther processing based on the fact that most of the categoryinformation in a fingerprint lies in the lower part ofthe fingerprint. This value was empirically determined. SeeFigs. 4, 12, 13, 14, and 15 for results of our center locationalgorithm.2.2 Decomposition<strong>Fingerprint</strong> images present a strong orientation tendencyand have a well-defined spatial frequency in each localneighborhood that does not contain singular point(s)(Fig. 6b). Gabor filters are band-pass filters which haveboth orientation-selective and frequency-selective propertiesand have optimal joint resolution in both spatial andfrequency domains [18]. By applying properly tuned Gaborfilters <strong>to</strong> a fingerprint image, the true ridge and furrowstructures can be greatly accentuated. These accentuatedridges and furrow structures constitute an efficientrepresentation of a fingerprint image.An even symmetric Gabor filter has the following generalform in the spatial domain:%&K"(#)K2- x‡yGx 1 , y; f,q6 =+ ‡ 21expcos12pfx‡6, (10)2 2 2dxd'K !y$#*Kx‡ = xsinq + ycosq, (11)y‡ = xcosq - ysinq, (12)where f is the frequency of the sinusoidal plane wave alongthe direction q from the x-axis, and d x and d y specify theGaussian envelope along x and y axes, respectively, whichdetermine the bandwidth of the Gabor filter.In our algorithm, the filter frequency f is set <strong>to</strong> the averageridge frequency (1/K), where K is the interridge distance.The average interridge distance is approximately 10 pixels ina 500 dpi fingerprint image. If f is <strong>to</strong>o large, spurious ridgesmay be created in the filtered image, whereas if f is <strong>to</strong>o small,nearby ridges may be merged in<strong>to</strong> one. The bandwidth of theGabor filters is determined by d x and d y . The selection of thevalues of d x and d y is based on the following trade-off. If theyare <strong>to</strong>o large, the filter is more robust <strong>to</strong> noise, but is morelikely <strong>to</strong> smooth the image <strong>to</strong> the extent that the ridge and
JAIN ET AL.: A MULTICHANNEL APPROACH TO FINGERPRINT CLASSIFICATION 353Fig. 6. <strong>Fingerprint</strong>s have well defined local frequency and orientation.(a) Ridges in a local region. (b) Fourier spectrum.furrow details in the fingerprint are lost. On the other hand,if they are <strong>to</strong>o small, the filter is not effective in removingnoise. In our algorithm, the values of d x and d y were empiricallydetermined and both were set <strong>to</strong> 4.0.A fingerprint image is decomposed in<strong>to</strong> four componentimages corresponding <strong>to</strong> four different values of q (0 o , 45 o ,90 o , and 135 o ) with respect <strong>to</strong> the x-axis (Fig. 5). A fingerprintimage is convolved with each of the four Gabor filters<strong>to</strong> produce the four component images. Convolution with a0 o -oriented filter accentuates ridges parallel <strong>to</strong> the x-axis,and it smoothes ridges which are not parallel <strong>to</strong> the x-axis.Filters tuned <strong>to</strong> other directions work in a similar way. According<strong>to</strong> our experimental results, the four componentimages capture most of the ridge directionality informationpresent in a fingerprint image and thus form a valid representation.We illustrate this by reconstructing a fingerprintimage by adding <strong>to</strong>gether all the four filtered images. Thereconstructed image is similar <strong>to</strong> the original image but theridges have been enhanced (Fig. 7).Before decomposing the fingerprint image, we normalizethe region of interest in each sec<strong>to</strong>r separately <strong>to</strong> a constantmean and variance. Normalization is done <strong>to</strong> remove theeffects of sensor noise and finger pressure differences. LetI(x, y) denote the gray value at pixel (x, y), M i and V i , theestimated mean and variance of sec<strong>to</strong>r S i , respectively, andN i (x, y), the normalized gray-level value at pixel (x, y). Forall the pixels in sec<strong>to</strong>r S i , the normalized image is defined as:N x,yi1 6=%& K' K2V73I1x,y6-M80iM0+V, if I x,y > Mii(13)22V073I1 x,y6-Mi8M -, otherwise,0Vi21 6where M 0 and V 0 are the desired mean and variance values,respectively. Normalization is a pixel-wise operation whichdoes not change the clarity of the ridge and furrow structures.If normalization is done on the entire image, then itcannot compensate for the intensity variations in the differentparts of the finger due <strong>to</strong> finger pressure differences.Normalization of each sec<strong>to</strong>r separately alleviates this problem.For our experiments, we set both M 0 and V 0 <strong>to</strong> a valueof 100. Normalized, filtered, and reconstructed images for thefingerprint shown in Fig. 4 are shown in Fig. 7.2.3 Feature Vec<strong>to</strong>rIn each component image, a local neighborhood withridges and furrows that are parallel <strong>to</strong> the correspondingFig. 7. Normalized, filtered, and reconstructed fingerprint images. (a)Normalized image. (b) Component image 0°. (c) Component image45°. (d) Component image 90°. (e) Component image 135°. (f) Reconstructedimage.filter direction exhibits a higher variation, whereas a localneighborhood with ridges and furrows that are not parallel<strong>to</strong> the corresponding filter tends <strong>to</strong> be diminished bythe filter which results in a lower variation. The spatialdistribution of the variations in local neighborhoods of thecomponent images thus constitutes a characterization ofthe global ridge structures and is well captured by thestandard deviation of grayscale values. In our algorithm,the standard deviation within the sec<strong>to</strong>rs defines the featurevec<strong>to</strong>r.Let C iq (x, y) be the component image corresponding <strong>to</strong> qfor sec<strong>to</strong>r S i . For "i, i = 0, 1, ¡, 47 and q ³ [0 o , 45 o , 90 o , 135 o ],a feature is the standard deviation F iq , defined as:3 1 6 8 2 , (14)Fi = Ê Ci x,y - Miq q qK iwhere K i is the number of pixels in S i and M iq is the mean ofthe pixel values in C iq (x, y). The 192-dimensional featurevec<strong>to</strong>rs, also called FingerCodes (similar <strong>to</strong> the IrisCode
354 IEEE TRANSACTIONS ON PATTERN ANALYSIS AND MACHINE INTELLIGENCE, VOL. 21, NO. 4, APRIL 1999introduced by Daugman [16]), for typical fingerprint imagesfrom different classes are shown as gray level images withfour disks, each disk corresponding <strong>to</strong> one filtered image(Fig. 8). The gray level in each sec<strong>to</strong>r of a disk represents thefeature value for that sec<strong>to</strong>r in the corresponding filteredimage. One can see that visually this representation appears<strong>to</strong> discriminate the five fingerprint classes reasonably well.Fig. 8. <strong>Fingerprint</strong> representation using 192-dimensional feature vec<strong>to</strong>rs (In each representation, the <strong>to</strong>p left disk represents the 0 o component,the <strong>to</strong>p right disk represents the 45 o component, the bot<strong>to</strong>m left disk represents the 90 o component, and the bot<strong>to</strong>m right disk represents the 135 ocomponent). The test pattern is a right loop. Each disk corresponds <strong>to</strong> one particular filter and there are 48 features (shown as gray values) ineach disk (8 6 = 48 sec<strong>to</strong>rs) for a <strong>to</strong>tal of 192 (48 4) features. (a) Test, (b) whorl, (c) right loop, (d) left loop, (e) arch, (f) tented arch.Fig. 9. <strong>Classification</strong> scheme using a combination of classifiers.
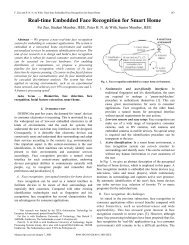
JAIN ET AL.: A MULTICHANNEL APPROACH TO FINGERPRINT CLASSIFICATION 3553 CLASSIFICATIONAu<strong>to</strong>matic classification of fingerprints is a difficult problembecause of the small interclass variability and large intraclassvariability among the five classes under consideration.In order <strong>to</strong> simplify the classification task, we decomposethe five-class problem in<strong>to</strong> a set of 10 two-class problems.Further, we use a two-stage classifier for fingerprintclassification. In the first stage, we use a K-nearest neighborclassifier <strong>to</strong> find the two most probable classes for a giveninput pattern. The K-nearest neighbor decision rule firstfinds the K nearest neighbors of the test pattern in the featurespace and, then, assigns the test pattern <strong>to</strong> the classwhich is most frequently represented among the K nearestneighbors. The <strong>to</strong>p two categories can be retrieved from theK-NN classifier corresponding <strong>to</strong> the classes which have thehighest and the second highest count among the K nearestneighbors, i.e., the first recall and the second recall. In thesecond stage of the classifier, a set of 10 (C 2 5 ) neural networksare trained <strong>to</strong> solve the 10 different two-class problems.The second stage uses the first and second recalls <strong>to</strong>select the specific neural network which has been trained <strong>to</strong>distinguish between the corresponding pair of classes andthe input pattern is then sent <strong>to</strong> the selected neural networkfor further classification. This neural network makes thefinal decision between these two classes.4 EXPERIMENTAL RESULTS4.1 DatasetWe report the results of our fingerprint classification algorithmon the NIST-4 database for the five-class fingerprintclassification problem. Since fingerprint classes A (arch) andT (tented arch) have a substantial overlap, it is very difficult<strong>to</strong> separate these two classes. Therefore, we also report ourresults for the four-class classification problem, whereclasses A and T have been merged in<strong>to</strong> one class. By incorporatinga rejection option, classification accuracy can beincreased. We report the improvement in error rates at differentrejection rates for both the five-class and the fourclassclassification problems.The NIST-4 database consists of 4,000 fingerprint images(image size is 512 480) from 2,000 fingers. Each finger hastwo impressions (f and s). Each image is labeled with one ormore of the five classes (W, R, L, A, and T). To simplify thetraining procedure, we make use of only the first label of afingerprint <strong>to</strong> train our system. For testing, however, wemake use of all the labels for a fingerprint and consider theoutput of our classifier <strong>to</strong> be correct if the output matchesany one of the labels. This is in line with the common practiceused by other researchers in comparing the classificationresults on the NIST-4 database. The images in theNIST-4 database are numbered f0001 through f2000 ands0001 through s2000. Each number represents a fingerprintfrom a different finger. We form our training set with thefirst 2,000 fingerprints from 1,000 fingers (f0001 <strong>to</strong> f1000 ands0001 <strong>to</strong> s1000) and the test set contains the remaining 2,000fingerprints (f1001 <strong>to</strong> f2000 and s1001 <strong>to</strong> s2000). The naturalproportion of fingerprints belonging <strong>to</strong> each class is 0.279,0.317, 0.338, 0.037, and 0.029 for the classes W, R, L, A, andT, respectively [6]. <strong>Classification</strong> accuracies can be significantlyincreased by using datasets whose records follow thenatural distribution of fingerprint classes because the morecommon types of fingerprints (loop and whorl) are easier <strong>to</strong>recognize. However, we do not use datasets with a naturalclass distribution. Twenty-eight fingerprints from thetraining set were rejected by our feature extraction algorithmbecause the center was detected at a corner of theimage and, therefore, a valid tessellation could not be establishedfor these images (Fig. 10). Thirty-five fingerprintswere rejected from the test set for the same reason. So, ourtraining set contains 1,972 fingerprint images. The 35 imagesrejected from the test set of 2,000 fingerprints amounts<strong>to</strong> a reject rate of 1.8 percent.4.2 K-Nearest Neighbor ClassifierThe K-nearest neighbor classifier results in an accuracy of85.4 percent for the five-class classification task when 10nearest neighbors (K = 10) are considered. <strong>Classification</strong>accuracy does not always increase with increasing K; thereexists an optimal value of K for finite training sample sizeclassification problems (Fig. 11) [19]. For the four-class classificationtask (where classes A and T were collapsed in<strong>to</strong>one class), an accuracy of 91.5 percent is achieved. The confusionmatrix for the K-nearest neighbor classification isshown in Table 1. The diagonal entries in this matrix showthe number of test patterns from different classes which arecorrectly classified. Since a number of fingerprints in theFig. 10. Example of images which were rejected because a valid tessellationcould not be established.Fig. 11. K vs. percent error for the K-nearest neighbor classifier.
356 IEEE TRANSACTIONS ON PATTERN ANALYSIS AND MACHINE INTELLIGENCE, VOL. 21, NO. 4, APRIL 1999TABLE 1CONFUSION MATRIX FOR THE K-NEAREST NEIGHBORCLASSIFICATION; K = 10TABLE 2CONFUSION MATRIX FOR THE NEURAL NETWORKCLASSIFICATIONTABLE 3CONFUSION MATRIX FOR THE TWO-STAGE CLASSIFICATIONNIST-4 database are labeled as belonging <strong>to</strong> two differentclasses, row sums of the confusion matrices in Tables 1, 2,and 3 are not identical.4.3 Neural Network ClassifierWe trained a multilayer feed-forward neural network usinga quick propagation training algorithm [22]. The neuralnetwork has one hidden layer with 20 neurons, 192 inputneurons, and five output neurons corresponding <strong>to</strong> the fiveclasses. We obtain an accuracy of 86.4 percent for the fiveclassclassification task. For the four-class classification task,an accuracy of 92.1 percent is achieved. The confusion matrixfor the neural network classification is shown in Table 2.4.4 Two-Stage ClassifierThe objective here is <strong>to</strong> perform a “simple” classification taskusing a K-NN classifier and then use a bank of two-class neuralnetwork classifiers <strong>to</strong> handle more subtle discriminations.The first stage uses the K-nearest neighbor (K = 10) classifier<strong>to</strong> yield the two most probable classes. We observed that 85.4percent of the time, the class with the maximum frequencyamong the K nearest neighbors is the correct class and 12.6percent of the time, the class with the second highest frequencyis the correct class. In other words, the K-nearestneighbor classifier yields the <strong>to</strong>p two classes with an accuracyof 98 percent. This result itself can be used <strong>to</strong> accuratelyclassify fingerprints in<strong>to</strong> two out of the five classes. Each fingerprintwill have an entry in two of the five partitions of thedatabase and the matching is required <strong>to</strong> be performed onlyin the corresponding two partitions of the database. The secondstage uses 10 different neural networks for 10 differentpairwise classifications. These neural networks have 192 inputneurons, 20-40 hidden neurons in one hidden layer, and2 output neurons. Each neural network is trained using thepatterns from only the two corresponding classes in thetraining set. For example, the neural network which distinguishesbetween R and W is trained using only the patternslabeled R and W in the training set.This two-stage classifier yields an accuracy of 90 percent forthe five-class classification task and an accuracy of 94.8 percentis achieved for the four-class classification task. The confusionmatrix for the two-stage classification is shown in Table3. Although our classifier is robust <strong>to</strong> noise and is able<strong>to</strong> correctly classify most of the poor quality fingerprints inthe NIST-4 database (Fig. 12), it fails on some very badquality fingerprint images where no ridge information ispresent in the central part of the fingerprint (Fig. 13). Inpoor quality fingerprints, it is very difficult <strong>to</strong> detect thecenter point correctly (Fig. 10b). Our classifier also fails <strong>to</strong>correctly classify twin loop images which are labeled aswhorl in the NIST-4 database. For these images, our centerlocation algorithm picks up the upper core and on consideringthat as the center, the image looks like a loop in theregion of interest which leads <strong>to</strong> a misclassification of W asL or R. See Fig. 14 for these misclassifications. About 3 percen<strong>to</strong>f the errors result from loop-arch misclassification becauseof the subtle difference between loop and arch types(see Fig. 15a). The A-T misclassification accounts for about5 percent of the errors. An example of this type of confusionis shown in Fig. 15b.4.5 Reject Option<strong>Classification</strong> accuracies can be further increased by incorporatinga rejection option. We use the (K, K‡)-nearestneighbor classifier [23] for rejection and the proposed
JAIN ET AL.: A MULTICHANNEL APPROACH TO FINGERPRINT CLASSIFICATION 357Fig. 12. Poor quality images which were correctly classified. (a) Arch,(b) left loop.Fig. 13. Poor quality images which were misclassified as arch. (a) Whorl,(b) right loop.two-stage classifier for classification. If the number oftraining samples from the majority class among the K nearestneighbors of a test pattern is less than K‡ (K‡ < K), wereject the test pattern and do not attempt <strong>to</strong> classify it. Mos<strong>to</strong>f the rejected images using this scheme are of poor quality(Figs. 16a and 16b). Other rejected images are those imageswhich “appear” <strong>to</strong> belong <strong>to</strong> different classes. For example,for the fingerprint image shown in Fig. 16c, three of its nearestneighbors belong <strong>to</strong> class R, three <strong>to</strong> class A, and four <strong>to</strong>class T. By rejecting 19.5 percent of the images for the fiveclassproblem, the classification accuracy can be increased <strong>to</strong>93.5 percent and for the four-class classification problem, theaccuracy can be increased <strong>to</strong> 96.6 percent (Table 4).5 CONCLUSIONSWe have developed a novel multichannel filter-based classificationalgorithm which gives better accuracy than previouslyreported in the literature on the NIST-4 database. Ourfeature vec<strong>to</strong>r, called FingerCode, is more representative ofFig. 14. Misclassification of whorl (twin loop) as (a) right loop, (b) leftloop.TABLE 4ERROR-REJECT TRADE-OFFFig. 15. Misclassifications; (a) a right loop misclassified as an arch; (b) anarch misclassified as a tented arch.
358 IEEE TRANSACTIONS ON PATTERN ANALYSIS AND MACHINE INTELLIGENCE, VOL. 21, NO. 4, APRIL 1999Fig. 16. Examples of images rejected by (K, K‡)-NN.the fingerprint class information and is robust <strong>to</strong> noisewhich is reflected in the classification accuracy. We havetested our algorithm on the NIST-4 database and a verygood performance has been achieved (90 percent for thefive-class classification problem and 94.8 percent for thefour-class classification problem with 1.8 percent rejectionduring the feature extraction phase). However, thisalgorithm suffers from the requirement that the region ofinterest be correctly located, requiring the accurate detectionof center point in the fingerprint image. By improvingthe accuracy of registration point location, a better performancecan be easily expected. Our system takes about 10seconds on a Sun Ultra-1 machine <strong>to</strong> classify one fingerprint,which is another aspect of the algorithm that needs <strong>to</strong>be improved. Since image decomposition (filtering) stepsaccount for 90 percent of the <strong>to</strong>tal compute time, specialpurpose hardware for convolution can significantly decreasethe overall time for classification.ACKNOWLEDGMENTSWe would like <strong>to</strong> thank Dr. Ruud Bolle and Dr. SharathPankanti of the IBM T.J. Watson Research Center and ScottConnell of the PRIP lab, Michigan State University, for theirmany useful suggestions.REFERENCES[1] Advances in <strong>Fingerprint</strong> Technology, H.C. Lee and R.E. Gaensslen,eds. New York: Elsevier, 1991.[2] A.K. Jain, L. Hong, S. Pankanti, and R. Bolle, “An IdentityAuthentication System Using <strong>Fingerprint</strong>s,” Proc. IEEE, vol. 85,no. 9, pp. 1,365-1,388, 1997.[3] K. Karu and A.K. Jain, “<strong>Fingerprint</strong> <strong>Classification</strong>,” Pattern Recognition,vol. 29, no. 3, pp. 389-404, 1996.[4] L. Hong and A.K. Jain, “<strong>Classification</strong> of <strong>Fingerprint</strong> Images,”Technical Report MSUCPS:TR98-18, Michigan State Univ., June1998.[5] C.I. Watson and C.L. Wilson, “NIST Special Database 4, <strong>Fingerprint</strong>Database,” Nat’l Inst. of Standards and Technology, Mar.1992.[6] C.L. Wilson, G.T. Candela, and C.I. Watson, “Neural Network<strong>Fingerprint</strong> <strong>Classification</strong>,” J. Artificial Neural Networks, vol. 1, no. 2,pp. 203-228, 1993.[7] G.T. Candela, P.J. Grother, C.I. Watson, R.A. Wilkinson, and C.L.Wilson, “PCASYS—A Pattern-Level <strong>Classification</strong> Au<strong>to</strong>mationSystem for <strong>Fingerprint</strong>s,” Technical Report NISTIR 5647, Apr.1995.[8][9]A. Senior, “A Hidden Markov Model <strong>Fingerprint</strong> Classifier,” Proc.31st Asilomar Conf. Signals, Systems and Computers, pp. 306-310,1997.M.M.S. Chong, T.H. Ngee, L. Jun, and R.K.L. Gay, “GeometricFramework for <strong>Fingerprint</strong> <strong>Classification</strong>,” Pattern Recognition,vol. 30, no. 9, pp. 1,475-1,488, 1997.[10] C.V.K. Rao and K. Black, “Type <strong>Classification</strong> of <strong>Fingerprint</strong>s: ASyntactic <strong>Approach</strong>,” IEEE Trans. Pattern Analysis and Machine Intelligence,vol. 2, no. 3, pp. 223-231, 1980.[11] A.P. Fitz and R.J. Green, “<strong>Fingerprint</strong> <strong>Classification</strong> Using HexagonalFast Fourier Transform,” Pattern Recognition, vol. 29, no. 10,pp. 1,587-1,597, 1996.[12] B.G. Sherlock and D.M. Monro, “A Model for Interpreting <strong>Fingerprint</strong>Topology,” Pattern Recognition, vol. 26, no. 7, pp. 1,047-1,055, 1993.[13] M. Kawagoe and A. Tojo, “<strong>Fingerprint</strong> Pattern <strong>Classification</strong>,”Pattern Recognition, vol. 17, no. 3, pp. 295-303, 1984.[14] A. Jain, L. Hong, and R. Bolle, “On-Line <strong>Fingerprint</strong> Verification,”IEEE Trans. Pattern Analysis and Machine Intelligence, vol. 19, no. 4,pp. 302-314, Apr. 1997.[15] J.G. Daugman, “Two-Dimensional Spectral Analysis of CorticalReceptive Field Profiles,” Vision Research, vol. 20, pp. 847-856,1980.[16] J.G. Daugman, “High Confidence Recognition of Persons by aTest of Statistical Independence,” IEEE Trans. Pattern Analysis andMachine Intelligence, vol. 15, no. 11, pp. 1,148-1,161, Nov. 1993.[17] A.K. Jain and F. Farrokhnia, “Unsupervised Texture SegmentationUsing Gabor Filters,” Pattern Recognition, vol. 24, no. 12, pp. 1,167-1,186, 1991.[18] J.G. Daugman, “Uncertainty Relation for Resolution in Space, SpatialFrequency, and Orientation Optimized by Two-DimensionalVisual Cortical Filters,” J. Optical Soc. Amer. A, vol. 2, pp. 1,160-1,169, 1985.[19] A.K. Jain and B. Chandrasekaran, “Dimensionality and SampleSize Considerations in Pattern Recognition Practice,” Handbook ofStatistics, vol. 2, P.R. Krishnaiah and L.N. Kanal, eds., pp. 835-855.North-Holland, 1982,[20] N. Ratha, S. Chen, and A.K. Jain, “Adaptive Flow Orientation-Based Feature Extraction in <strong>Fingerprint</strong> Images,” Pattern Recognition,vol. 28, no. 11, pp. 1,657-1,672, 1995.[21] N. Ratha, K. Karu, S. Chen, and A.K. Jain, “A Real-Time MatchingSystem for Large <strong>Fingerprint</strong> Databases,” IEEE Trans. PatternAnalysis and Machine Intelligence, vol. 18, no. 8, pp. 799-813, Aug.1996.[22] S.E. Fahlman, “Faster-Learning Variations on Back-Propagation:An Empirical Study,” Proc. 1988 Connectionist Models SummerSchool, 1988.[23] R.O. Duda and P.E. Hart, Pattern <strong>Classification</strong> and Scene Analysis.John Wiley & Sons, 1973.[24] J.L. Wayman, “Technical Testing and Evaluation of Biometric IdentificationDevices,” Biometrics: Personal Identification in Networked Society,A.K. Jain, R. Bolle, and S. Pankanti, eds. Kluwer, 1998.[25] K. Woods, W.P. Kegelmeyer, and K.W. Bowyer, “Combination ofMultiple Classifiers Using Local Accuracy Estimates,” IEEE Trans.Pattern Analysis and Machine Intelligence, vol. 19, no. 4, pp. 405-410,Apr. 1997.
JAIN ET AL.: A MULTICHANNEL APPROACH TO FINGERPRINT CLASSIFICATION 359Anil K. Jain is a University Distinguished Professorand Chair of the Department of ComputerScience and Engineering at Michigan State University.His research interests include statisticalpattern recognition, Markov random fields, textureanalysis, neural networks, document imageanalysis, fingerprint matching, and 3D objectrecognition. He received the best paper awardsin 1987 and 1991 and certificates for outstandingcontributions in 1976, 1979, 1992, and 1997from the Pattern Recognition Society. He alsoreceived the 1996 IEEE Transactions on Neural Networks OutstandingPaper Award. He was the edi<strong>to</strong>r-in-chief of the IEEE Transactions onPattern Analysis and Machine Intelligence (1990-1994). He is the coauthorof Algorithms for Clustering Data (Prentice Hall, 1988), editedthe book Real-Time Object Measurement and <strong>Classification</strong> (Springer-Verlag, 1988), and co-edited the books, Analysis and Interpretation ofRange Images (Springer-Verlag, 1989), Markov Random Fields (AcademicPress, 1992), Artificial Neural Networks and Pattern Recognition(Elsevier, 1993), 3D Object Recognition (Elsevier, 1993), and BIO-METRICS: Personal Identification in Networked Society (Kluwer, 1998).He is a fellow of the IEEE and the IAPR. He received a Fulbright researchaward in 1998.Salil Prabhakar received his BTech degree incomputer science and engineering from theInstitute of Technology, Banaras Hindu University,Varanasi, India, in 1996. During 1996-1997,he worked with Tata Information Systems Ltd.(now IBM Global Services India Pvt. Ltd.), Bangalore,India, as a software engineer. In the fall of1997, he joined the Department of ComputerScience and Engineering, Michigan State University,where he is currently a doc<strong>to</strong>ral degreecandidate. His research interests include patternrecognition, image processing, computer vision, biometrics, networksecurity, computer graphics, and multimedia systems.Lin Hong received the BS and MS degrees incomputer science from Sichuan University,China, in 1987 and 1990, respectively, and thePhD degree in computer science from MichiganState University in 1998. He is currently withVisionics Corporation. His current research interestsinclude multimedia, biometrics, data mining,pattern recognition, image processing, and computervision application.