

Voronoi Treemaps
Voronoi Treemaps
Voronoi Treemaps

Create successful ePaper yourself
Turn your PDF publications into a flip-book with our unique Google optimized e-Paper software.
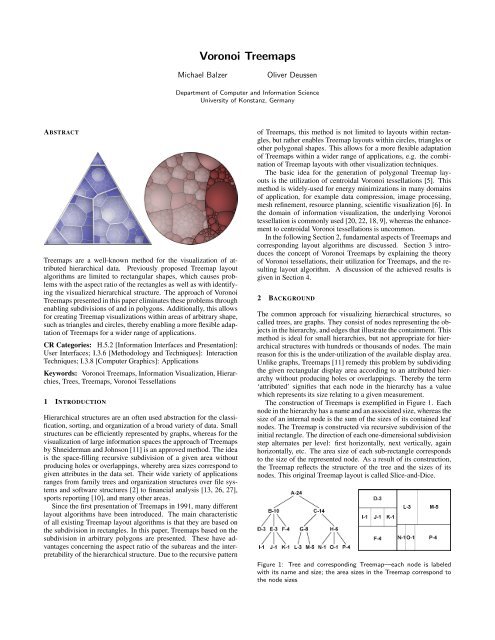
<strong>Voronoi</strong> <strong>Treemaps</strong>Michael BalzerOliver DeussenDepartment of Computer and Information ScienceUniversity of Konstanz, GermanyABSTRACT<strong>Treemaps</strong> are a well-known method for the visualization of attributedhierarchical data. Previously proposed Treemap layoutalgorithms are limited to rectangular shapes, which causes problemswith the aspect ratio of the rectangles as well as with identifyingthe visualized hierarchical structure. The approach of <strong>Voronoi</strong><strong>Treemaps</strong> presented in this paper eliminates these problems throughenabling subdivisions of and in polygons. Additionally, this allowsfor creating Treemap visualizations within areas of arbitrary shape,such as triangles and circles, thereby enabling a more flexible adaptationof <strong>Treemaps</strong> for a wider range of applications.CR Categories: H.5.2 [Information Interfaces and Presentation]:User Interfaces; I.3.6 [Methodology and Techniques]: InteractionTechniques; I.3.8 [Computer Graphics]: ApplicationsKeywords: <strong>Voronoi</strong> <strong>Treemaps</strong>, Information Visualization, Hierarchies,Trees, <strong>Treemaps</strong>, <strong>Voronoi</strong> Tessellations1 INTRODUCTIONHierarchical structures are an often used abstraction for the classification,sorting, and organization of a broad variety of data. Smallstructures can be efficiently represented by graphs, whereas for thevisualization of large information spaces the approach of <strong>Treemaps</strong>by Shneiderman and Johnson [11] is an approved method. The ideais the space-filling recursive subdivision of a given area withoutproducing holes or overlappings, whereby area sizes correspond togiven attributes in the data set. Their wide variety of applicationsranges from family trees and organization structures over file systemsand software structures [2] to financial analysis [13, 26, 27],sports reporting [10], and many other areas.Since the first presentation of <strong>Treemaps</strong> in 1991, many differentlayout algorithms have been introduced. The main characteristicof all existing Treemap layout algorithms is that they are based onthe subdivision in rectangles. In this paper, <strong>Treemaps</strong> based on thesubdivision in arbitrary polygons are presented. These have advantagesconcerning the aspect ratio of the subareas and the interpretabilityof the hierarchical structure. Due to the recursive patternof <strong>Treemaps</strong>, this method is not limited to layouts within rectangles,but rather enables Treemap layouts within circles, triangles orother polygonal shapes. This allows for a more flexible adaptationof <strong>Treemaps</strong> within a wider range of applications, e.g. the combinationof Treemap layouts with other visualization techniques.The basic idea for the generation of polygonal Treemap layoutsis the utilization of centroidal <strong>Voronoi</strong> tessellations [5]. Thismethod is widely-used for energy minimizations in many domainsof application, for example data compression, image processing,mesh refinement, resource planning, scientific visualization [6]. Inthe domain of information visualization, the underlying <strong>Voronoi</strong>tessellation is commonly used [20, 22, 18, 9], whereas the enhancementto centroidal <strong>Voronoi</strong> tessellations is uncommon.In the following Section 2, fundamental aspects of <strong>Treemaps</strong> andcorresponding layout algorithms are discussed. Section 3 introducesthe concept of <strong>Voronoi</strong> <strong>Treemaps</strong> by explaining the theoryof <strong>Voronoi</strong> tessellations, their utilization for <strong>Treemaps</strong>, and the resultinglayout algorithm. A discussion of the achieved results isgiven in Section 4.2 BACKGROUNDThe common approach for visualizing hierarchical structures, socalled trees, are graphs. They consist of nodes representing the objectsin the hierarchy, and edges that illustrate the containment. Thismethod is ideal for small hierarchies, but not appropriate for hierarchicalstructures with hundreds or thousands of nodes. The mainreason for this is the under-utilization of the available display area.Unlike graphs, <strong>Treemaps</strong> [11] remedy this problem by subdividingthe given rectangular display area according to an attributed hierarchywithout producing holes or overlappings. Thereby the term‘attributed’ signifies that each node in the hierarchy has a valuewhich represents its size relating to a given measurement.The construction of <strong>Treemaps</strong> is exemplified in Figure 1. Eachnode in the hierarchy has a name and an associated size, whereas thesize of an internal node is the sum of the sizes of its contained leafnodes. The Treemap is constructed via recursive subdivision of theinitial rectangle. The direction of each one-dimensional subdivisionstep alternates per level: first horizontally, next vertically, againhorizontally, etc. The area size of each sub-rectangle correspondsto the size of the represented node. As a result of its construction,the Treemap reflects the structure of the tree and the sizes of itsnodes. This original Treemap layout is called Slice-and-Dice.Figure 1: Tree and corresponding Treemap—each node is labeledwith its name and size; the area sizes in the Treemap correspond tothe node sizes
A substantial problem of this initial layout algorithm is the restrictionof subdividing the plane in each step solely in one dimension.As a result, thin elongated rectangles with a high aspect ratiobetween width and height emerge. Such rectangles are difficult tosee, select, compare in size, and label [7, 23, 3]. Figure 2 presentsan example of a real-world data set containing 698 nodes at 5 hierarchylevels. The left image visualizes this hierarchy with nodesof different sizes, whereby small nodes are hard to recognize. Thesame hierarchy with nodes of equal size is presented in the right image,illustrating the divergence of actual and perceived node sizes inSlice-and-Dice layouts. The reason for both problems is unerringlythe high aspect ratio of the rectangles.Figure 2: Slice-and-Dice Treemap layouts of 698 nodes at 5 hierarchylevels with nodes of different sizes (left) and nodes of equal size(right)—the high aspect ratio between width and height causes thehard recognition of small nodes and the bad perception of node sizesConsequentially, in the further developments of Treemap layoutalgorithms mainly the issue of the high aspect ratio was addressed,for instance in Clustered <strong>Treemaps</strong> [27], Squarified <strong>Treemaps</strong> [3],Ordered <strong>Treemaps</strong> [21], and Modifiable <strong>Treemaps</strong> [25]. Thesealgorithms employ a two-dimensional subdivision in each recursionstep, meaning horizontally and vertically at the same time.Their main optimization criterion is the approximation of the subrectanglesto the shape of a square, so that the overall aspect ratiobetween width and height of the sub-rectangles is minimized.Aside from the aspect ratio criterion, other criteria have also beenconsidered. For example, the order of nodes or the nearness of twoor more nodes, whereby these other criteria are mostly related tothe respective application domain. A demonstrative member of thisgroup of advanced Treemap layout algorithms is presented in Figure3, visualizing the same data set as in Figure 2 with a SquarifiedTreemap layout. Similarly, nodes of different sizes are shown in theleft image and nodes of equal size in the right image. Obviously,this layout algorithm maintains a much better aspect ratio, resultingin a better separation of the nodes and perception of their sizes.Figure 3: Squarified Treemap layouts of the same data set as in Figure2—the interpretation of the hierarchical structure is ambiguousand often edges seemingly run into each otherDisadvantageous in the mentioned sophisticated algorithms isthe unclear representation of the hierarchical structure, whereas itis preserved by Slice-and-Dice Treemap layouts. For example, Figure2 clearly represents a hierarchy with a root node containing sixchild nodes, which is conform to the data set. The indication thereforis the alternating horizontal and vertical subdivision. In contrast,this observation can not be made in Figure 3. Here the number ofchild nodes of the root node is ambiguous. A variant is a root nodewith two child nodes A and B, whereby A contains two and B fourof the original six child nodes. Aside from this example, more deludeinterpretations are possible. The reason for not producing aone-to-one mapping between the hierarchical structure and the correspondingTreemap layout, is the grouping of nodes during thesubdivision. For example, in the Squarified Treemap layout shownin Figure 3 the two largest nodes are vertically divided from theother four smaller nodes due to the functioning of the algorithm.This ‘internal’ division step may be interpreted as branching in thehierarchical structure.Another problem of the existent algorithms are edges that seeminglyrun into each other, whereby a distinction of nodes betweenand within different hierarchy levels becomes even more difficult.The reason is the still limited degree of freedom in each subdivisionstep. By aligning each edge only horizontally or vertically, theprobability that the end point of an edge is near the starting pointof another equally aligned edge is quite high, which results in theimpression of one single edge instead of two separate edges. Dependingon the hierarchical position of the nodes that are separatedby these two edges, the interpretation of the hierarchical structuremay be further deluded by the visualization.The representation of the hierarchical structure is a crucial requirementto <strong>Treemaps</strong>. Already Shneiderman and Johnson enhancedtheir initial Treemap layouts by assigning borders in everysubdivision step, called Nested <strong>Treemaps</strong> [11]. The approach ofCushion <strong>Treemaps</strong> [24] employs shading to improve the perceptionof structure by feigning specular reflection and thereby simulating acurved surface. This method is also adapted for the enhancement ofNested <strong>Treemaps</strong> to Framed <strong>Treemaps</strong> [3], resulting in quasi-threedimensionalborders. Another option is to use transparencies [2]to hide uninteresting or unwanted parts of the hierarchy. Theselayout-independent methods can be applied to the existing Treemapalgorithms and may reduce, but do not prevent, misinterpretationsconcerning the hierarchical structure.So far, all existent Treemap layout algorithms have one thingin common: they are based on and are thereby restricted to axisalignedrectangles. A slight exception are ET-Maps [19] that generateshapes composed of axis-aligned rectangles, but their generalappearance is identical. This limited degree of freedom drasticallyrestricts the space of layout variability. The issues of high aspect ratiosand misinterpretations concerning the hierarchical structure areconsequential symptoms. Additionally, this restriction to rectanglesimplies that the layout of <strong>Treemaps</strong> can only take place withinrectangular display areas. More complex shapes like circles, triangles,and arbitrary polygons are not possible. Although, theseshapes may not be necessary if Treemap visualizations are usedindependently. However, by embedding Treemap layouts withinmore complex visualizations, a better adaptability is quite useful oreven necessary.Hence, the approach of <strong>Voronoi</strong> <strong>Treemaps</strong> is presented, enablinga polygon-based two-dimensional subdivision following theTreemap paradigm. It offers low aspect ratios, better interpretabilityof hierarchical structures, and flexible adaptability regarding theenclosing shape.
3 VORONOI TREEMAPSGlobal application-independent constraints and optimization criteriafor a Treemap layout regarding the shape of the Treemap subareasare:1. Constraint: The division in subareas must fully utilize thegiven overall area, thereby avoiding holes and overlappings.2. Optimization criterion: Subareas should have an overall aspectratio between width and height that converges to one.of P by S. An ordinary <strong>Voronoi</strong> tessellation V ε (P) is a <strong>Voronoi</strong>tessellation using the Euclidian metric, defined by√distance ε (p i ,q) := ‖p i − q‖ = (x i − x) 2 + (y i − y) 2 , (1)as their distance function. The bisector of two regions V ε (p i ) andV ε (p j ) of an ordinary <strong>Voronoi</strong> tessellations is the perpendicular bisectorof the generators p i and p j . Examples for an unbounded anda bounded planar ordinary <strong>Voronoi</strong> tessellation are given in Figure4.3. Optimization criterion: Siblings in the hierarchy should notbe grouped during the layout process, thereby making theidentification of the hierarchical structure non-ambiguous.4. Optimization criterion: Subareas of the Treemap should havenon-regular shape, so that edges between the subareas do notseemingly run into each other.Obviously, polygons can be used for the division of a givenarea into subareas. A polygon is defined as a closed plane figurewith n sides. Each polygon can be subdivided into smaller polygons,hereby satisfying the constraint number 1. Polygons can havearbitrary shapes, and polygons with many sides can approximatecurves. Both refer to the optimization criteria number 2, 3, and 4.The principle structure of the layout algorithm is similar to theoriginal Treemap layout algorithm. The first step is to create apolygonal subdivision of the given display area according to thetop hierarchy level. The output is a set of polygons representing thenodes of the top hierarchy level. For the next hierarchy level, thisprocedure is performed recursively for all top level nodes within therespective polygons. When the recursion ends, a complete Treemaplayout is obtained.The basic concept for generating polygonal subdivisions is toutilize <strong>Voronoi</strong> tessellations. They enable an iteratively computationof good layouts in accordance to the given constraint and optimizationcriteria. Finding an optimal solution is a NP-completeproblem—even for layouts based on axis-aligned rectangles. However,a good approximation is sufficient for <strong>Treemaps</strong>. To clearlyconvey the idea of <strong>Voronoi</strong> <strong>Treemaps</strong>, necessary theoretical knowledgeof <strong>Voronoi</strong> tessellations is given in the subsequent Section 3.1.The layout algorithm for computing <strong>Voronoi</strong> <strong>Treemaps</strong> is explainedin detail in Section 3.2.3.1 <strong>Voronoi</strong> Tessellations<strong>Voronoi</strong> tessellations enable the partitioning of a m-dimensionalspace without producing holes or overlappings. For an easier understandingof their underlying theory, the explanations in this sectionare restricted to relevant aspects regarding their application forTreemap layouts. Here only planar <strong>Voronoi</strong> tessellations in the twodimensionalEuclidian space are considered. All definitions and denotationsare according to [17, 5].Basic Properties: Let P := {p 1 ,...., p n } be a set of n distinctpoints in R 2 with the coordinates (x 1 ,y 1 ),...,(x n ,y n ). Thesepoints are the generators. The subdivision of R 2 into n <strong>Voronoi</strong>regions V (p i ), with the property that a point q(x,y) lies in theregion V (p i ) if and only if distance(p i ,q) < distance(p j ,q) foreach p i , p j ∈ P with i ≠ j, is defined as the <strong>Voronoi</strong> tessellationV (P) := {V (p 1 ),...,V(p n )}. The denotation distance(p i ,q) representsa specified distance function between the generator p i andthe point q. In general, a <strong>Voronoi</strong> tessellation is defined in anunbounded space. Having a bounded space S, the set V ∩S (P) :={V (p 1 ) ∩ S,...,V(p n ) ∩ S} is called a bounded <strong>Voronoi</strong> tessellationFigure 4: Unbounded and bounded planar ordinary <strong>Voronoi</strong> tessellationWeighted <strong>Voronoi</strong> Tessellations: In the basic <strong>Voronoi</strong> tessellationV (P) it is implicitly assumed that each generator has thesame weight. As an extension, a set of parameters W may be given,and to each generator p i ∈ P a parameter w i ∈ W is assigned. Theseparameters are the weights. By using weighted generators, it ispossible to define weighted distance functions, generating weighted<strong>Voronoi</strong> tessellations V (P,W).An additively weighted <strong>Voronoi</strong> tessellation V aw (P,W), brieflythe AW <strong>Voronoi</strong> tessellation, uses the following distance functionbetween a generator p i ∈ P with its assigned weight w i ∈ W and apoint q:distance aw (p i ,w i ,q) := ‖p i − q‖ − w i . (2)The bisector of two regions V aw (p i ,w i ) and V aw (p j ,w j ) of an AW<strong>Voronoi</strong> tessellations forms a hyperbolic curve with foci p i and p j .The left image in Figure 5 presents an example for an AW <strong>Voronoi</strong>tessellation.The distance function for the additively weighted power <strong>Voronoi</strong>tessellations V pw (P,W), briefly PW <strong>Voronoi</strong> tessellation, is:distance pw (p i ,w i ,q) := ‖p i − q‖ 2 − w i . (3)This distance function yields a bisector of two regions V pw (p i ,w i )and V pw (p j ,w j ) that is a straight line. The bisector correspondsto the perpendicular bisector of p i and p j moved away from theirmidpoint depending on their weights w i and w j . The right image inFigure 5 presents an example for a PW <strong>Voronoi</strong> tessellation.Both, the AW and the PW <strong>Voronoi</strong> tessellation, may be illustratedas <strong>Voronoi</strong> tessellations that are using circles as generators.This is obvious, if circles are considered as points with a size orweight parameter. Thereby, the weight w i in the AW distance functionrepresents directly the radius of the circle, whereas in the PWdistance function, w i is the square of the radius. To satisfy the continuityof AW <strong>Voronoi</strong> tessellations, the circles are not allowed tooverlap. Additionally, the abstraction of circles with negative radiihas to be made in order to achieve the complete spectrum of possible<strong>Voronoi</strong> tessellations for the AW and the PW distance function.
Figure 5: Weighted <strong>Voronoi</strong> tessellations using the AW and the PWdistance functionCentroidal <strong>Voronoi</strong> Tessellations: The center of mass, orcentroid, c i of a <strong>Voronoi</strong> region V (p i ) within the Euclidian spaceis calculated by c i = ∫ V (p i ) xdx. A centroidal <strong>Voronoi</strong> tessellation,briefly CVT, is a special <strong>Voronoi</strong> tessellation with the property thateach generator p i is itself the center of mass c i of the corresponding<strong>Voronoi</strong> region V (p i ). Obviously, there exist many different CVTsfor a given number of generators.The mathematical importance of the CVT is founded by its relationshipto the energy function∫K (P,V (P)) = ∑ ‖x − p i ‖ 2 dx. (4)i V (p i )It is proven that a necessary condition for K (P,V (P)) to be minimizedis that V (P) is a CVT [5]. Since to find a CVT of a givennumber of generators with K (P,V (P)) in a global minimum isNP-complete [5], approximations of CVTs that are located in localminima of K (P,V (P)) are used. CVTs can be iteratively computedwith the Lloyd’s method [16]: By starting with an initial distributionof generators P within a bounded plane S, in each iterationstep each generator p i ∈ P is moved into the center of mass c i of its<strong>Voronoi</strong> region V ∩S (p i ) ∈ V ∩S (P). This iterative computation stopswhen the difference between each generator p i and its correspondingcenter of mass c i is below a chosen error threshold ε. Figure 6exemplifies this method.Figure 6: <strong>Voronoi</strong> tessellation of 20 random points and an associatedCVT—traces illustrate the movements of the points during thecomputation of the CVTThe concept of CVTs can be generalized to non-Euclidian distancefunctions and spaces, and can also be extended to weighted<strong>Voronoi</strong> tessellations. The only prerequisite is that the existence ofa however defined center of mass for each <strong>Voronoi</strong> region is guaranteed.Computational Complexity and Algorithms: A lowerbound of the worst-case time complexity for constructing the ordinary<strong>Voronoi</strong> tessellation V ε (P) of n generators is O(nlogn). Alower bound of the space complexity for computing V ε (P) is O(n)in the worst case. Both lower bounds for V ε (P) are tight in thesense that actually there exist optimal algorithms having these lowerbounds [17].The computations of the AW <strong>Voronoi</strong> tessellation V aw (P,W) andthe PW <strong>Voronoi</strong> tessellation V pw (P,W) have the same time andspace complexity as V ε (P) in the worst case. Optimal algorithmsare existent, for instance [8] for V aw (P,W), and [1, 14, 15] forV pw (P,W).The time complexity of the iterative computation of an approximationof a CVT is O(dO V ) with d as the number of iterations andO V as the complexity of the used <strong>Voronoi</strong> tessellation. Thereby dis not directly related to the number of generators, but rather to theminimal approximation error that should be achieved, and it thereforedoes not affect the overall complexity. The complexity of thecalculation of the centers of mass of a <strong>Voronoi</strong> region does alsonot affect the overall complexity, because it is only O(n), and each<strong>Voronoi</strong> tessellation has at least a time complexity of O(n). Thus,the overall time complexity for computing the approximation of aCVT is equal to the time complexity of the used <strong>Voronoi</strong> tessellation.Nevertheless, CVT algorithms are very time-consuming, sinceoften many iterations are necessary for obtaining a good approximation.By taking advantage of the fact that it is not necessary tocalculate the <strong>Voronoi</strong> tessellations itself for obtaining a CVT, it ispossible to use distributed computing environments for their computation[12]. The idea is to calculate only the centers of mass ineach iteration step by using large random sets of discrete samplepoints. This method achieves a nearly perfect linear speed-up withthe number of processors used, and has the same time complexityas the respective <strong>Voronoi</strong> tessellation. The space complexity of theiterative computation of an approximation of a CVT is O(n).3.2 <strong>Voronoi</strong> Treemap AlgorithmThe principle structure of the algorithm is similar to the recursivestructure of the original Treemap layout algorithm. The modificationfor <strong>Voronoi</strong> <strong>Treemaps</strong> is applied to the subdivision in eachrecursion step. Therefor the computation of the centroidal <strong>Voronoi</strong>tessellation is utilized.CVTs enable the subdivision of a given area without producingholes and overlappings, which satisfies the constraint for Treemaplayouts. CVTs minimize the overall energy of the <strong>Voronoi</strong> tessellation.The energy of the CVT is thereby equivalent to the overallaspect ratio of the subareas of the Treemap layout [5], which refersto optimization criterion number 2. In a <strong>Voronoi</strong> tessellation eachgenerator is treated separately from the other generators. CVTsare special cases of <strong>Voronoi</strong> tessellations, and therefore also do notgroup their generators. This refers to the optimization criterionnumber 3. Non-degenerated vertices within <strong>Voronoi</strong> tessellationsarise from three generators that have the same distance to a point,whereby each non-degenerated vertex is assigned to three edges.The energy minimization in CVTs simultaneously minimizes thenumber of degenerated vertices, and maximizes the distances betweenvertices and the angles between the edges of a vertex [5]. Incombination with the general non-regular topology of CVTs, thisrefers to the optimization criterion number 4. Concluding it can bestated that CVTs are suitable for generating good Treemap layoutsin reference to the given constraint and optimization criteria.The essential characteristic of <strong>Treemaps</strong> is that their subareasizes correspond to the sizes of the nodes in the hierarchy. In standardCVTs using the Euclidian distance function, the sizes of the<strong>Voronoi</strong> regions are roughly the same, which disqualifies them forthe generation of Treemap layouts. CVTs with weighted distancefunctions have the property to produce divisions with variable sizedsubareas. The problem is that during the computation of a CVTwith an arbitrarily defined distance function, the area sizes of the
<strong>Voronoi</strong> regions are not observed. For that reason, an extension ofthe standard CVT computation method is necessary in order to controlthe size of every <strong>Voronoi</strong> region. The idea is to adaptively alterthe weight parameter of each generator in the next iteration step accordingto the size of the dedicated <strong>Voronoi</strong> region in the currentiteration step. For example, if the size of a node in the hierarchyis 20% of the size of the parent node, and in the current iterationstep the dedicated <strong>Voronoi</strong> region covers only 16% of the overallarea, it is tried to increase the area size of this <strong>Voronoi</strong> region inthe next iteration step from 16% to 20% by increasing the weightof the generator by 25%. Due to the facts that the relation betweenthe weight of a generator and the area size of the dedicated <strong>Voronoi</strong>region is not a linear dependency, and the weight and positions ofthe other generators are changing at the same time, the correct areasize is most likely not achieved in the next iteration step. Rather itis presumed that a better approximation is obtained. By performingthese adjustments of the generator weights in each iteration step,the computation stops in a stable state, whereby the error betweenthe designated relative size of each node in the hierarchy and therelative area size of the dedicated <strong>Voronoi</strong> region is below a chosenmaximum error ε. This extended computation method for weightedCVTs for the generation of Treemap layouts is further outlined bymeans of Algorithm 1.Algorithm 1 <strong>Voronoi</strong> Treemap subdivisionInput: bounded plane S in R 2 ; set of n values A desired :={a 1desired ,...,a ndesired } with 0 < a idesired ≤ 1 and ∑a idesired = 1; errorthreshold εOutput: subdivision of∣ S in n disjoint subareas s i ⊂ S with∣ AreaSize(s i) ∣∣AreaSize(S) − a i desired < ε1: initialize a set of n points P := {p 1 ,..., p n } with p i ∈ S, p i ≠ p j2: initialize a set of n weights W := {w 1 ,...,w n } with w i = 13: initialize a data structure for the <strong>Voronoi</strong> tessellation V ∩S (P,W)4: repeat5: Compute<strong>Voronoi</strong>Tessellation(V ∩S (P,W))6: stable = true7: initialize a set of n values A := {a 1 ,...,a n }8: for each a i ∈ A do9: a i = AreaSize(V (p i,w i ))AreaSize(S)V ∩S (P,W)10: if |a i − a desired | ≥ ε then11: stable = f alse12: end if13: end for14: for each w i ∈ W do15: Ad justWeight(w i ,a i ,a idesired )16: end for17: MoveGenerators(P,W,V ∩S (P,W))18: until stable == true19: ExtractSubareas(V ∩S (P,W))with <strong>Voronoi</strong> region V (p i ,w i ) ∈In general, arbitrary weighted distance functions may be used forthe described subdivision algorithm. However for the application of<strong>Treemaps</strong> and the given optimization criteria, especially the additivelyweighted distance function—with restriction to distributionsequivalent to non-overlapping circles—and the additively weightedpower distance function are qualified. This is caused by the continuoustopology of their resulting <strong>Voronoi</strong> regions. The differencebetween the AW and the PW <strong>Voronoi</strong> tessellation is the shape ofthe bisector of two regions. AW <strong>Voronoi</strong> tessellations create hyperboliccurves, and PW <strong>Voronoi</strong> tessellations create straight lines.Thus, it has to be distinguished between AW <strong>Voronoi</strong> <strong>Treemaps</strong> andPW <strong>Voronoi</strong> <strong>Treemaps</strong>. Additionally, the different characteristics ofthe AW and PW distance functions necessitate a different handlingof the auxiliary functions Ad justWeight() and MoveGenerators()in Algorithm 1.During the computation of AW <strong>Voronoi</strong> Treemap subdivisions, itis necessary that the weight parameter w i can have negative values.If not, it may be possible that the area size error of small regions willnot get below the chosen error threshold ε. Furthermore, the specialcase has to be observed that the weight w i in AW tessellations doesnot become zero or nearby zero. Therefore, it has to be checkedagainst a very small value δ. In contrast, according to experience,the convergence of the algorithm for PW <strong>Voronoi</strong> Treemap subdivisionsis improved, if each w i ≥ 1. The resulting algorithms forthe Ad justWeight() function are outlined in Algorithm 2 for AW<strong>Voronoi</strong> <strong>Treemaps</strong> and in Algorithm 3 for PW <strong>Voronoi</strong> <strong>Treemaps</strong>.Algorithm 2 Ad justWeight() for AW <strong>Voronoi</strong> <strong>Treemaps</strong>Input: weight value w i ; area size value a i ; desired area size valuea idesired ≠ 0Output: adjusted weight value w i1: 0 < δ ≪ 12: if |w i | < δ then3: w i = sign(w i ) · δ4: end if5: w i = w i + |w i | · ai desired −a ia idesiredAlgorithm 3 Ad justWeight() for PW <strong>Voronoi</strong> <strong>Treemaps</strong>Input: weight value w i ; area size value a i ; desired area size valuea idesired ≠ 0Output: adjusted weight value w i with w i ≥ 1(1: w i = w i · 1 + a )i desired −a ia idesired2: if w i < 1 then3: w i = 14: end ifFor granting continuous AW <strong>Voronoi</strong> regions during the subdivisionalgorithm, it is required that the distribution of generatorsin combination with the according weights is equivalent to a distributionof non-overlapping circles. This can be achieved by againadjusting the weights after the generators have been moved into thecenters of mass of the dedicated <strong>Voronoi</strong> regions, while keeping theratio between the weights. Thereby all weights are multiplied by amaximum factor, so that for each subset of generators {p i , p j } ⊂ P,with i ≠ j, their Euclidian distance is not smaller than the sum of theassigned weights w i and w j . Algorithm 4 outlines the implementationof the function MoveGenerators() for AW <strong>Voronoi</strong> <strong>Treemaps</strong>.For PW <strong>Voronoi</strong> <strong>Treemaps</strong>, no additional conditions must be satisfied.Thus, the function MoveGenerators() for PW <strong>Voronoi</strong><strong>Treemaps</strong> is reduced to moving each generator p i into the center ofmass of the dedicated <strong>Voronoi</strong> region V pw (p i ,w i ) ∈ V pw∩S (P,W)).The formal declaration of an algorithm is set aside.For the standard CVT computation method with constantweights, it has been shown that the energy K i (P,V (P)) in iterationi is lower than the energy K i−1 (P,V (P)) in iteration i − 1, andtherefore the computation stops in a local minimum [5]. This cannotbe proven for the extended CVT computation method becauseof the permanently changing weights of the generators. Nevertheless,from experience it can be stated that in most cases this extendedCVT computation method also stops in a local minimum. Ifnot, this problem can be remedied by a re-initialization of the generatorswith new random positions. Aside from the energy of the
Algorithm 4 MoveGenerators() for AW <strong>Voronoi</strong> <strong>Treemaps</strong>Input: set of n points P := {p 1 ,..., p n }; set of n weights W :={w 1 ,...,w n }; AW <strong>Voronoi</strong> tessellation V aw∩S (P,W)Output: set of n points P := {p 1 ,..., p n } with p i =CenterO f Mass(V aw (p i ,w i )) and V aw (p i ,w i ) ∈ V aw∩S (P,W);set of n weights W := {w 1 ,...,w n } with ‖p i − p j ‖ 2 − (w i +w j ) ≥ 0 for {p i , p j } ⊂ P, i ≠ j1: for each p i ∈ P do2: p i = CenterO f Mass(V aw (p i ,w i )) with V aw (p i ,w i ) ∈V aw∩S (P,W)3: end for4: f actorWeight = ∞5: for each {p i , p j } ⊂ P with i ≠ j do6: f = ‖p i−p j ‖ 2w i +w j7: if 0 < f < f actorWeight then8: f actorWeight = f9: end if10: end for11: if f actorWeight < 1 then12: for each w i ∈ W do13: w i = w i · f actorWeight14: end for15: end ifset with 698 nodes at 5 hierarchy levels, as in the examples of Sliceand-Diceand Squarified Treemap layouts in Section 2. Again, theleft images visualize the hierarchy with nodes of different sizes, andthe right images with nodes of equal size.Figure 8: AW <strong>Voronoi</strong> Treemap layouts of the same data set as inFigure 2 with nodes of different sizes (left) and nodes of equal size(right)<strong>Voronoi</strong> tessellation, the area size error of each <strong>Voronoi</strong> region andthe overall area size error is also reduced during the computation.Indeed, at the end of the computation, this error does not reside ina local minimum, but rather below a chosen threshold ε. Figure 7illustrates a typical convergence of the maximum area size error ofa <strong>Voronoi</strong> region and of the overall area size error of the <strong>Voronoi</strong>tessellation during the computation of a CVT with an AW and aPW distance function. The data set consisted of ten generators withdifferent sizes. The area size error of each <strong>Voronoi</strong> region was lessthan 0.1% at iteration 185 for the AW distance function, and at iteration206 for the PW distance function.Figure 9: PW <strong>Voronoi</strong> Treemap layouts of the same data set as inFigure 2 with nodes of different sizes (left) and nodes of equal size(right)Similarly to the other Treemap layout algorithms, enhancementslike borders, adaptive edge sizes, cushions, coloring, etc., may alsobe applied to the described layout method. This additionally supportsthe user in the perception and interpretation of the Treemapvisualization. Examples for such enhanced <strong>Voronoi</strong> Treemap layoutsare presented in Figures 10–12.4 DISCUSSIONFigure 7: Typical convergence of the maximum area size error ofa <strong>Voronoi</strong> region and of the overall area size error of the <strong>Voronoi</strong>tessellation during the computation of a CVT with an AW and a PWdistance functionThe entire AW and PW <strong>Voronoi</strong> Treemap layouts are generatedby using the described computation of CVTs in the subdivision stepof the Treemap recursion. Figure 8 presents the result for a layoutwith the AW distance function, and Figure 9 presents the result for alayout with the PW distance function. All four images use the dataThis paper presents a new approach for the generation of Treemaplayouts. Contrary to existent layout algorithms that are based onthe subdivision in rectangles, this new layout algorithm enablesthe subdivision in arbitrary polygons. This also allows to createTreemap visualizations within areas of arbitrary shape, such as circlesor triangles. The evidence for the suitability of the introducedlayout method has been produced by the constraints and globalapplication-independent optimization criteria for <strong>Treemaps</strong>. Especially,the minimization of the overall aspect ratio of the subareasis explicitly attributed to the proven energy minimization in centroidal<strong>Voronoi</strong> tessellations. This minimization does thereby notentail ambiguities of the interpretability of the hierarchical structurein the visualization, such as observed in other Treemap layoutalgorithms.Because of the intricacy of the expanded degree of freedom forthese layouts, the presented method iteratively computes an approximationof a layout with an error below a desired threshold. Dependingon this threshold, the number of iterations required may
Figure 10: Enhanced AW <strong>Voronoi</strong> Treemap layout of 4075 nodes at10 hierarchy levels (a brighter color indicates a lower hierarchy level)Figure 11: Enhanced PW <strong>Voronoi</strong> Treemap layout of 16288 nodes at7 hierarchy levels (a brighter color indicates a lower hierarchy level)become very large. Thus, with regard to computation time, otherTreemap layout algorithms outperform this method by far. Thisproblem is diminished by using distributed computing environments.The recursive structure of the Treemap algorithm and theability to massively parallelize the computation of the CVTs, enablean almost perfect linear scalability with the number of processorsused. In the existing prototype implementation of the layout algorithm,a variable number of compute servers is utilized to generateeven large Treemap layouts within a reasonable time—using eightIntel Xeon CPUs each with 2.4 GHz, the computation of Figure 10required 7:13 minutes, and that of Figure 11 required 5:48 minutes.Indeed, this method is not appropriate for real time calculation.In future work, the properties and abilities of the presented layoutmethod will be studied extensively. For example, the restriction ofthe movement of the generators, and the temporal coherence of thesubareas, will be investigated. That will permit ordered layouts, andthe visualization of time-variant data sets respectively. Also, adaptationsof the presented method to other layout problems outsidethe Treemap domain will be addressed, such as the visualization ofgeoreferenced statistical data.REFERENCES[1] Franz Aurenhammer. Power diagrams: Properties, algorithms, andapplications. SIAM Journal on Computing, 16(1):78–96, 1987.[2] Michael Balzer, Oliver Deussen, and Claus Lewerentz. <strong>Voronoi</strong>treemaps for the visualization of software structures. In Proceedingsof the ACM Symposium on Software Visualization. ACM, 2005.[3] Mark Bruls, Kees Huizing, and Jarke J. van Wijk. Squarified treemaps.In Proceedings of the Joint Eurographics and IEEE TCVG Symposiumon Visualization, pages 33–42. IEEE Computer Society, 2000.[4] Mark de Berg, Marc van Kreveld, Mark Overmars, and OtfriedSchwarzkopf. Computational Geometry: Algorithms and Applications.Springer-Verlag, Berlin, Germany, 2nd rev. edition, 2000.[5] Qiang Du, Vance Faber, and Max Gunzburger. Centroidal voronoitessellations: Applications and algorithms. SIAM Review, 41(4):637–676, 1999.[6] Qiang Du and Xiaoqiang Wang. Centroidal voronoi tessellation basedalgorithms for vector fields visualization and segmentation. In Proceedingsof the IEEE Visualization, pages 43–50. IEEE Computer Society,2004.[7] Paul M. Fitts. The information capacity of the human motor systemin controlling the amplitude of movements. Journal of ExperimentalPsychology, 47(6):381–391, 1954.[8] Steven J. Fortune. A sweepline algorithm for voronoi diagrams. Algorithmica,2:153–174, 1987.[9] Michael Granitzer, Wolfgang Kienreich, Vedran Sabol, Keith Andrews,and Werner Klieber. Evaluating a system for interactive explorationof large, hierarchically structured document repositories. InProceedings of the IEEE Symposium on Information Visualization,pages 127–134. IEEE Computer Society, 2004.[10] Liqun Jin and David C. Banks. Tennisviewer: A browser for competitiontrees. IEEE Computer Graphics and Applications, 17(4):63–65,1997.[11] Brian Johnson and Ben Shneiderman. Tree maps: A space-filling approachto the visualization of hierarchical information structures. InProceedings of the 2nd International IEEE Visualization Conference,pages 284–291. IEEE Computer Society, 1991.[12] Lili Ju, Qiang Du, and Max Gunzburger. Probabilistic methods forcentroidal voronoi tessellations and their parallel implementations.Parallel Computing, 28(10):1477–1500, 2002.[13] Walter-Alexander Jungmeister and David Turo. Adapting treemaps tostock portfolio visualization. Technical Report UMCP-CSD CS-TR-2996, University of Maryland, College Park, Maryland 20742, USA,1992.[14] Deok-Soo Kim, Donguk Kim, and Kokichi Sugihara. <strong>Voronoi</strong> diagramof a circle set from voronoi diagram of a point set: I. Topology.Computer Aided Geometric Design, 18(6):541–562, 2001.[15] Deok-Soo Kim, Donguk Kim, and Kokichi Sugihara. <strong>Voronoi</strong> diagramof a circle set from voronoi diagram of a point set: II. Geometry.Computer Aided Geometric Design, 18(6):563–585, 2001.[16] Stuart P. Lloyd. Least square quantization in PCM. In IEEE Transactionson Information Theory, volume 28, pages 129–137. IEEE ComputerSociety, 1982.[17] Atsuyuki Okabe, Barry Boots, Kokichi Sugihara, and Sung Nok Chiu.Spatial Tessellations: Concepts and Applications of <strong>Voronoi</strong> Dia-
Figure 12: Comparison of four Treemap layout algorithms—at first, the top hierarchy level was subdivided with the Squarified Treemap algorithm,then for each of the four subareas according to its label a different layout algorithm was used (a brighter color indicates a lower hierarchy level)grams. John Wiley and Sons Ltd., 2nd edition, 2000.[18] Rene Reitsma, Stanislav Trubin, and Saurabh Sethia. Informationspace regionalization using adaptive multiplicatively weightedvoronoi diagrams. In Proceedings of the 8th International Conferenceon Information Visualisation, pages 290–294. IEEE ComputerSociety, 2004.[19] Dmitri Roussinov and Hsinchun Chen. A scalable self-organizing mapalgorithm for textual classification: A neural network approach to thesaurusgeneration. Communication and Cognition – Artificial Intelligence,15(1-2):81–112, 1998.[20] Shirley Schussman, Martin Bertram, Bernd Hamann, and Kenneth I.Joy. Hierarchical data representations based on planar voronoi diagrams.In Proceedings of the Joint Eurographics and IEEE TCVGSymposium on Visualization, pages 63–72. Eurographics Association,2000.[21] Ben Shneiderman and Martin Wattenberg. Ordered treemap layouts.In Proceedings of the IEEE Symposium on Information Visualization,pages 73–78. IEEE Computer Society, 2001.[22] Robert Strzodka and Alexandru Telea. Generalized distance transformsand skeletons in graphics hardware. In Proceedings of the JointEurographics and IEEE TCVG Symposium on Visualization, pages221–230. Eurographics Association, 2004.[23] David Turo and Brian Johnson. Improving the visualization of hierarchieswith treemaps: Design issues and experimentation. In Proceedingsof the 3rd Conference on Visualization, pages 124–131. IEEEComputerSociety, 1992.[24] Jarke J. van Wijk and Huub van de Wetering. Cushion treemaps: Visualizationof hierarchical information. In Proceedings of the IEEESymposium on Information Visualization, pages 73–78. IEEE ComputerSociety, 1999.[25] Frederic Vernier and Laurence Nigay. Modifiable treemaps containingvariable-shaped units. In Extended Abstracts of the IEEE Symposiumon Information Visualization. IEEE Computer Society, 2000.[26] Martin Wattenberg. Map of the market, 1998. SmartMoney.com,http://smartmoney.com/marketmap.[27] Martin Wattenberg. Visualizing the stock market. In Extended Abstractson Human Factors in Computing Systems, pages 188–189.ACM Press, 1999.


