Initial Public Offerings Jay R. Ritter Cordell Professor of Finance ...
Initial Public Offerings Jay R. Ritter Cordell Professor of Finance ...
Initial Public Offerings Jay R. Ritter Cordell Professor of Finance ...

You also want an ePaper? Increase the reach of your titles
YUMPU automatically turns print PDFs into web optimized ePapers that Google loves.
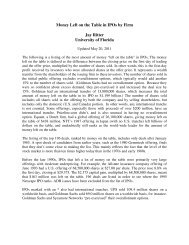
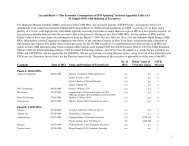
The international evidence on the long-run performance <strong>of</strong> IPOs is summarized in Table<br />
4. Total abnormal performance is calculated as 100% minus the ratio <strong>of</strong> the average three-year<br />
buy-and-hold gross return divided by the average three-year buy-and-hold gross return on the<br />
benchmark. Thus, the total abnormal return <strong>of</strong> -20% for the U.S. can be interpreted as meaning<br />
that buying a portfolio <strong>of</strong> IPOs would have left an investor with 20% less wealth three years later<br />
than if the money had been invested in nonissuing firms instead.<br />
Table 4<br />
International Evidence on Long-Run IPO Overpricing<br />
Number Issuing Total abnormal<br />
Country Author(s) <strong>of</strong> IPOs years return<br />
Australia Lee, Taylor & Walter 266 1976-89 -46.5%<br />
Austria Aussenegg 57 1965-93 -27.3%<br />
Brazil Aggarwal, Leal & Hernandez 62 1980-90 -47.0%<br />
Canada Jog and Srivistava 216 1972-93 -17.9%<br />
Chile Aggarwal, Leal & Hernandez 28 1982-90 -23.7%<br />
Finland Keloharju 79 1984-89 -21.1%<br />
Germany Ljungqvist 145 1970-90 -12.1%<br />
Japan Cai & Wei 172 1971-90 -27.0%<br />
Korea Kim, Krinsky & Lee 99 1985-88 +2.0%<br />
Singapore Hin & Mahmood 45 1976-84 -9.2%<br />
Sweden Loughran, <strong>Ritter</strong> & Rydqvist 162 1980-90 +1.2%<br />
U.K. Levis 712 1980-88 -8.1%<br />
U.S. Loughran & <strong>Ritter</strong> 4,753 1970-90 -20.0%<br />
Notes: Total abnormal returns are measured as 100⋅[(1+Ripo,T)/(1+Rm,T)] - 100, where Ripo,T is the average total<br />
return (where a 50% return is measured as 0.5) on the IPOs from the market price shortly after trading commences<br />
until the earlier <strong>of</strong> the delisting date or 3 years; Rm,T is the average <strong>of</strong> either the market return or matching-firm<br />
returns over the same interval. This is an updated version <strong>of</strong> Table 7 in Loughran, <strong>Ritter</strong>, and Rydqvist (1994). The<br />
Canadian numbers have been supplied by Vijay Jog <strong>of</strong> Carleton University.<br />
The long-run underperformance <strong>of</strong> IPOs is not limited to operating companies going<br />
public. Investors in a closed-end fund IPO pay a premium over net asset value (the market value<br />
<strong>of</strong> the securities that the fund holds), because commissions equal about 7 percent <strong>of</strong> the <strong>of</strong>fering<br />
price. Thus every $10.00 invested at the <strong>of</strong>fering price buys only $9.30 <strong>of</strong> net asset value. Given<br />
that closed-end funds typically sell at about a 10 percent discount to net asset value, it is difficult<br />
to explain why investors are willing to purchase the shares at a premium in the IPO. On average,<br />
it takes only about six months for closed-end funds to move from their 7 percent premium to a 10<br />
percent discount. Perhaps it is no surprise that practitioners say that "closed-end funds are sold,<br />
not bought." Almost all closed-end fund shares are sold to individuals, rather than more<br />
sophisticated institutional investors, at the time <strong>of</strong> the IPO. Furthermore, new issues <strong>of</strong> closedend<br />
funds are highly cyclical.<br />
15