Identification of Responsible Cultivation Areas In West Kalimantan ...
Identification of Responsible Cultivation Areas In West Kalimantan ...
Identification of Responsible Cultivation Areas In West Kalimantan ...

Create successful ePaper yourself
Turn your PDF publications into a flip-book with our unique Google optimized e-Paper software.
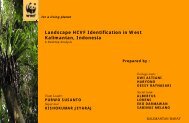
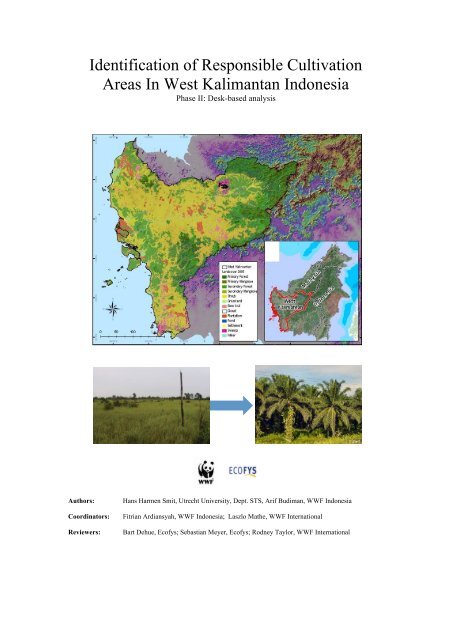
<strong>Identification</strong> <strong>of</strong> <strong>Responsible</strong> <strong>Cultivation</strong><br />
<strong>Areas</strong> <strong>In</strong> <strong>West</strong> <strong>Kalimantan</strong> <strong>In</strong>donesia<br />
Phase II: Desk-based analysis<br />
Authors: Hans Harmen Smit, Utrecht University, Dept. STS, Arif Budiman, WWF <strong>In</strong>donesia<br />
Coordinators: Fitrian Ardiansyah, WWF <strong>In</strong>donesia; Laszlo Mathe, WWF <strong>In</strong>ternational<br />
Reviewers: Bart Dehue, Ec<strong>of</strong>ys; Sebastian Meyer, Ec<strong>of</strong>ys; Rodney Taylor, WWF <strong>In</strong>ternational
Acknowledgment<br />
The development <strong>of</strong> this report and the underlying analysis would not have been possible without the expertise and<br />
input provided by the project partners and the support from sponsors. The following institutions contributed to this<br />
report: Ec<strong>of</strong>ys, WWF <strong>In</strong>ternational and Conservation <strong>In</strong>ternational. The work on this pilot report was made<br />
possible through sponsorship by the Packard Foundation.<br />
2
<strong>In</strong>troduction<br />
Background<br />
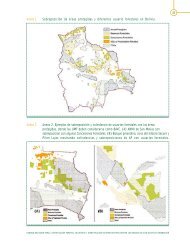
Potential <strong>Responsible</strong> <strong>Cultivation</strong> <strong>Areas</strong> (RCA’s) were preselected in phase I for <strong>West</strong><br />
<strong>Kalimantan</strong> based on: the presence <strong>of</strong> conservation areas, carbon stocks, land use, legal status<br />
and agricultural suitability for oil palm cultivation. Existing plantation concessions larger than<br />
15.000 ha, in which at least 50% <strong>of</strong> the land was found suitable are considered potential<br />
RCA’s. From this assessment it was found that 30 concessions (see figure 0.1) are potentially<br />
suitable as RCA. The preselected concessions are further analyzed on compliance with the<br />
RCA criteria in this report.<br />
Figure 0.1: Concessions potentially suitable as RCA as identified in phase I<br />
3
Content<br />
<strong>In</strong>troduction 1<br />
Goal & process phase II 5<br />
P1: Energy crop plantations maintain or increase High Conservation Values 7<br />
P2: Establishment <strong>of</strong> energy crop plantations does not lead to significant reductions<br />
in carbon stocks 31<br />
P3: Establishment <strong>of</strong> energy crop plantations respects formal and customary land<br />
rights 33<br />
P4: Establishment <strong>of</strong> energy crop plantations does not cause unwanted displacement<br />
effects 35<br />
P5: The identified areas is agriculturally suitable for the target energy crop 36<br />
Recommendation Phase II: Identified priority areas 37<br />
References 39<br />
Appendix 40<br />
List <strong>of</strong> figures<br />
Figure 0.1: Concessions potentially suitable as RCA as identified in phase I.................................................................................................................3<br />
Figure 1.1.1: (<strong>In</strong>ternational) Protection and Conservation <strong>Areas</strong> that are close or overlap with the 30 concessions...........................................9<br />
Figure 1.1.2: Map representing orangutan distribution in <strong>West</strong> <strong>Kalimantan</strong> (source: UNEP, 2004).................................................................. 12<br />
Figure 1.1.4: Map <strong>of</strong> important habitat for migration species, Important Bird <strong>Areas</strong>, and Endemic Bird <strong>Areas</strong> (source: Ministry <strong>of</strong> forestry,<br />
2002; Birdlife <strong>In</strong>ternational, 1998 and 2003) .................................................................................................................................................................... 13<br />
Figure 1.2.1: Map <strong>of</strong> potential corridors between orangutan habitats.......................................................................................................................... 18<br />
Table 1.3: The status <strong>of</strong> peat inside concessions. ............................................................................................................................................................... 22<br />
Table 1.4.1. Concessions that have 100 m wide forest along the river and the total required buffer zone........................................................... 24<br />
Table 1.4.2: Erosion classification based on USLE Methodology (source: HCV Consortium, 2008)................................................................ 25<br />
Figure 1.4.2: Map indicating soil erosion risk in <strong>West</strong> <strong>Kalimantan</strong> Province............................................................................................................. 26<br />
Table 1.4.3: Occurred fires in the 30 concessions in <strong>West</strong> <strong>Kalimantan</strong> during 2000 - 2007 .................................................................................. 28<br />
Table 2.1: Above ground carbon Stock estimation in the 30 concessions ................................................................................................................... 32<br />
Figure 3.1: Map <strong>of</strong> Land use (function) in <strong>West</strong> <strong>Kalimantan</strong> Province....................................................................................................................... 34<br />
Table 6.1: Overview identified conflicts/risk for conflict with RCA principles ........................................................................................................ 37<br />
Figure 6.1: Location concession 30 identified for further analysis in phase II ............................................................................................................ 38<br />
4
Goal & process phase II<br />
Goal<br />
The goal <strong>of</strong> phase II is to:<br />
1. Refine the findings <strong>of</strong> phase I (pre-selected areas).<br />
2. Identify remaining knowledge gaps that must be filled in through the field activities.<br />
Process<br />
Ideally the analysis in phase II should be based on regional information sources, however in<br />
this pilot it was found that information sources with such a level <strong>of</strong> detail are not available (a<br />
spatial resolution with a scale <strong>of</strong> 1:10,000 or higher would be ideal for application in<br />
cultivated areas, and minimum scale <strong>of</strong> 1:50,000 is recommended. However, most <strong>of</strong> national<br />
scale maps in <strong>In</strong>donesia were presented in 1:100,000 and 1:250,000, see also Muliastra,<br />
2009). Due to this limitation, no region specific recommendations can be made, and the phase<br />
II analysis was done on a landscape level for all 30 concessions. As a result, phase II is<br />
similar to phase I in the sense that both are done on the landscape level, and some data<br />
sources used in phase I are also included in phase II. <strong>In</strong> phase I, priority areas were selected<br />
based on the selection criterion that at least 50% <strong>of</strong> the concession is suitable based on this<br />
rapid assessment. <strong>In</strong> phase II, a number <strong>of</strong> additional data sources are added to make a more<br />
detailed analysis for each selected concession. <strong>In</strong> phase II the areas unsuitable as RCA within<br />
the concessions are identified, and specific recommendations are made on the field data<br />
needed to improve the limitations <strong>of</strong> the desk-based assessment.<br />
For the selected areas, the following tasks are carried out:<br />
• P1: Establishment <strong>of</strong> energy crop plantations maintain or increases High<br />
Conservation Values: Desk-based HCV-Assessment <strong>of</strong> the preselected areas<br />
according to step 1, 2 and 3 <strong>of</strong> the practical guidelines for HCV assessment as<br />
proposed by HCV Consortium (2008). The desk-based assessment in the context <strong>of</strong><br />
P1 is especially relevant for the identification <strong>of</strong> HCV´s <strong>of</strong> type 1,2,3 and 4 (see<br />
global HCV toolkit <strong>of</strong> Pr<strong>of</strong>orest (Jennings, 2003)).<br />
• P2: Establishment <strong>of</strong> energy crop plantations does not lead to significant<br />
reductions in carbon stocks: Verification and refinement <strong>of</strong> information on land<br />
cover and presence <strong>of</strong> peat areas and wetlands through regional studies.<br />
• P3: Establishment <strong>of</strong> energy crop plantations respects formal and customary<br />
land rights: Special focus will be given the possibility <strong>of</strong> conflicting information<br />
about land-use planning and actual land use. The formal ownership <strong>of</strong> the concessions<br />
is verified based on governmental databases, non scientific literature (newspapers,<br />
internet), and interviews.<br />
• P4: Establishment <strong>of</strong> energy crop plantations does not cause unwanted<br />
displacement effects: Verification and refinement <strong>of</strong> information on current land use<br />
through regional experts.<br />
• P5: The identified area is agriculturally suitable for the target energy crop.<br />
Refinement <strong>of</strong> the desk-based information from phase I through fieldwork (e.g.<br />
collection <strong>of</strong> more detailed soil and slope information) and consultation <strong>of</strong> experts.<br />
5
Based on the more detailed information collected in this phase, changes may be made to the<br />
pre-selected areas that will actually be analyzed in depth in the field work in phase III. During<br />
phase II it will also become clear what information gaps remain after the desk-based<br />
assessment. This forms the basis for the field work to be performed in phase III.<br />
6
P1: Energy crop plantations maintain or increase High Conservation<br />
Values<br />
This section describes the results <strong>of</strong> the desk-based HCV assessment <strong>of</strong> the preselected areas.<br />
For the HCV assessment, the HCV guidance documents developed by the HCV consortium<br />
(2008) were used.<br />
For each High Conservation Value it is described what the HCV entails, the information that<br />
has been gathered on this HCV (including its sources), and the resulting findings in terms <strong>of</strong><br />
the (potential) presence <strong>of</strong> the HCV in the preselected area. After this, it is determined for<br />
each HCV what information will need to be gathered or verified through field work in order<br />
to conclude on the presence <strong>of</strong> the HCV.<br />
HCV 1.1; <strong>Areas</strong> that Contain or Provide Biodiversity Support Function to<br />
Protection or Conservation <strong>Areas</strong><br />
Protected areas or conservation areas are gazetted in order to maintain ecological functions<br />
specifically, or preserve other characteristics (including biodiversity, water resource<br />
protection), endangered species and its viable populations or a combination <strong>of</strong> them, see also<br />
HCV Consortium, 2008). All protected areas and conservation areas were created with the<br />
aim <strong>of</strong> protecting culture, ecological functions (e.g., water provision), biodiversity or a<br />
combination <strong>of</strong> these, are considered HCV 1.1. Apart from the protection areas established by<br />
the Government, areas that have important ecological functions as identified by esteemed<br />
societal organizations such as IUCN, are also considered here.<br />
The assessment should identify the presence <strong>of</strong> any gazetted protected areas and conservation<br />
areas in <strong>West</strong> <strong>Kalimantan</strong> that may be impacted by potential operations in the preselected<br />
areas.<br />
Data <strong>In</strong>put<br />
To assess the presence/impact on HCV 1.1 areas proximate to the concessions, the following<br />
data on conservation and protected areas were used:<br />
• <strong>In</strong>donesian Conservation <strong>Areas</strong> (source: Ministry <strong>of</strong> Forestry, 2007). The data used is<br />
the <strong>of</strong>ficial data for <strong>In</strong>donesia conservation areas produced by Central Government <strong>of</strong><br />
<strong>In</strong>donesia. <strong>In</strong> addition to the boundaries <strong>of</strong> the protection areas indicated in this<br />
dataset, an additional buffer <strong>of</strong> 1 km was considered (government regulations require<br />
a 500m buffer zone, however it was found that the accuracy <strong>of</strong> the maps is biased,<br />
therefore twice the buffer as recommended is considered, to avoid a faulty<br />
interpretation in the field).<br />
• Protected Forest and Forest status (source: Spatial Planning unit Provincial<br />
Government <strong>West</strong> <strong>Kalimantan</strong>). This dataset provides the <strong>of</strong>ficial boundaries for<br />
Protected <strong>Areas</strong>/forests (in these areas important environmental functions are<br />
identified, e.g. water provision and erosion protection).<br />
• IUCN conservation areas categories I – IV (source: IUCN – UNEP). This dataset is<br />
used to identify additional conservation areas. The IUCN conservation areas are used<br />
because these are internationally recognized (endorsed by the <strong>In</strong>donesian<br />
Government: more detailed information on the definition <strong>of</strong> each category can be<br />
found on www.unep-wcmc.org)..<br />
7
• RAMSAR <strong>Areas</strong> (source: The Ramsar Convention on Wetlands <strong>of</strong> <strong>In</strong>ternational<br />
Importance). This dataset is used to identify wetland areas internationally recognized<br />
as conservation areas (endorsed by the <strong>In</strong>donesian Government: detailed information<br />
can be found on www.ramsar.org).<br />
The 30 preselected concessions are overlaid with the boundaries <strong>of</strong> the identified conservation<br />
areas described above. By applying GIS analysis, every concession that contains, or adjacent<br />
to these areas is identified as potential HCV 1.1.<br />
Findings<br />
Based on the desktop analysis, it is concluded that HCV 1.1 is potentially present in 8 <strong>of</strong> 30<br />
concessions; no 3, 14, 17, 19, 21, 22, 24, and 26. The concessions no 3, no 22, no 24, and no<br />
26 are found to be adjacent to protection forest; one concession is close to Strict Nature<br />
Reserve (no 14), and a portion <strong>of</strong> 3 concessions overlap with IUCN Category IV, concession<br />
no 22 is adjacent to forest protection and overlap with IUCN Category IV. The results <strong>of</strong> the<br />
analysis can be found in figure 1.1. and Appendix 1 table 1.1.<br />
Required field data<br />
Based on the desktop analysis, HCV 1.1 was found present in 8 <strong>of</strong> 30 concessions (partly<br />
based on the precautionary principal). For these 8 concessions, the findings need verification<br />
in the field, since occasionally the border <strong>of</strong> conservation and protected areas are not precisely<br />
mapped (these are indicative maps), and the location <strong>of</strong> the area may in practice be located<br />
100 – 200m from the mapped location.<br />
<strong>In</strong> addition, if the company wants to develop any <strong>of</strong> these concessions, a comprehensive study<br />
to assess the impact <strong>of</strong> the activities on the conservation and protected areas should be<br />
conducted. The fact that an HCV is present does not automatically mean it cannot be used for<br />
sustainable feedstock production.<br />
8
Figure 1.1.1: (<strong>In</strong>ternational) Protection and Conservation <strong>Areas</strong> that are close or overlap with the 30 concessions<br />
9
HCV 1.2; Critically Endangered Species<br />
Any species (potentially) present and listed as critically endangered by IUCN, Appendix 1 <strong>of</strong><br />
CITES or in <strong>In</strong>donesia Government Regulation on Protected Species is a HCV 1.2.<br />
Endangered species have a high risk <strong>of</strong> becoming extinct and therefore each individual is<br />
considered important for regeneration <strong>of</strong> the species.<br />
Other species will be a HCV 1.2 when identified as endangered by a consensus <strong>of</strong> influential<br />
stakeholders. Three categories are described that are relevant to the above criteria are:<br />
1. Species that have significance in the global conservation: presence <strong>of</strong> such species<br />
would constitute as a High Conservation Value. The species are listed in the category<br />
'Critically Endangered' on the IUCN Red List (http://www.redlist.org), or listed in<br />
Appendix I <strong>of</strong> CITES. All these species are considered an HCV. <strong>In</strong> addition species<br />
are considered that are listed in <strong>In</strong>donesian regulation to be protected from extinction.<br />
2. Undiscovered or enigmatic endangered species (HCV Consortium, 2008). Thus not<br />
listed in the IUCN Red List.<br />
3. Species threatened with local extinction (HCV Consortium, 2008).<br />
Data <strong>In</strong>put<br />
<strong>In</strong> the desktop analysis, identification will be made <strong>of</strong> critically endangered (sub) species that<br />
occur in/near the 30 concessions and that may be affected by operational activities in the<br />
future. This will be done through a landscape level analysis on distribution <strong>of</strong> critically<br />
endangered species and their habitats that (potentially) are inside and/or surrounding the<br />
concession (category 1).<br />
To assess the presence <strong>of</strong> HCV 1.2 on a landscape level the following data-sources are used in<br />
relation to the category 1 as mentioned above (for category 2 and 3 no desktop data is<br />
available):<br />
• IUCN Red list (source: http://www.iucnredlist.org/). <strong>In</strong> this list, an overview is given<br />
<strong>of</strong> all the species identified as endangered in line with international consensus. The<br />
species included in this list (the categories ‘Endangered’ and ‘Vulnerable’ are<br />
considered in the analysis<br />
• CITES Appendix (source: www.cites.org). CITES (the Convention on <strong>In</strong>ternational<br />
Trade in Endangered Species <strong>of</strong> Wild Fauna and Flora) is an international agreement<br />
between governments on species that need protection from extinction. Its aim is to<br />
ensure that international trade in specimens <strong>of</strong> wild animals and plants does not<br />
threaten their survival. The species included in ‘Appendix I’ are considered an HCV.<br />
• Appendix <strong>of</strong> <strong>In</strong>donesian regulation (Peraturan Pemerintah, no 7 1999). <strong>In</strong> this<br />
appendix a list <strong>of</strong> species is presented that require protection under <strong>In</strong>donesian law.<br />
The species included in this list are considered in the analysis.<br />
• Orangutan distribution map (based on regular surveys by WCMC, source www.unepwcmc.org).<br />
This data is used to assess the presence <strong>of</strong> orangutan habitats proximate to<br />
the concessions.<br />
• Orangutan Population and Habitat Viability Assessment (Singleton, 2004). This map<br />
is a contribution <strong>of</strong> the IUCN/SSC Conservation Breeding Specialist Group. The<br />
collected data <strong>of</strong> Borneo Orangutan is used to identify orangutan populations.<br />
10
• Important Bird Area (IBA) and Endemic Bird Area (EBA) (source: Birdlife<br />
<strong>In</strong>ternational, 1998 and 2003). These datasets are used to assess presence <strong>of</strong> bird<br />
species (listed in IUCN Red List or CITES) in the concessions.<br />
• Distribution <strong>of</strong> large mammals (Elephant, Banteng, Rhino) (source: Hearth <strong>of</strong> Borneo<br />
(HOB), Rautner, 2005). This data is used to assess the presence <strong>of</strong> large mammal<br />
species (listed in IUCN red list or CITES) to the concessions. These species are<br />
considered flagship species.<br />
By applying GIS analysis, the species distribution data listed above is overlaid preselected<br />
concessions. For all the concessions that overlap with distribution <strong>of</strong> any species listed, it is<br />
assumed that this area is HCV 1.2.<br />
Findings<br />
<strong>In</strong> <strong>West</strong> <strong>Kalimantan</strong> province only a few species as listed above are found to be present.<br />
Based on the existing data it was found that; except for orangutan and important/endemic bird<br />
areas, almost all important species were found inside conservation or protected forest areas.<br />
Therefore most significant species for this analysis, in terms <strong>of</strong> distribution are orangutan and<br />
several bird species. As a result <strong>of</strong> the analysis, 2 concessions (no 25 and no 28) were found<br />
to contain/overlap with orangutan populations. <strong>In</strong> addition one concession (no 24) was<br />
identified to be adjacent to an Endemic Bird Area (Bird life Area 157, <strong>Kalimantan</strong>). The<br />
results <strong>of</strong> the HCV 1.2 analysis can be found in figure 1.2 and 1.4, and also in appendix 1<br />
table 1.2.<br />
Required field data<br />
<strong>In</strong> the landscape level analysis on endangered species in the 30 concessions, the available data<br />
is limited. All the data on the endangered species is mostly from the conservation areas.<br />
However, outside these areas these species are also potentially present. The concessions are<br />
quite far from conservation areas, and thus any species present is unlikely to be mapped. It is<br />
therefore strongly recommended to verify the absence <strong>of</strong> endangered species in a field survey.<br />
11
Figure 1.1.2: Map representing orangutan distribution in <strong>West</strong> <strong>Kalimantan</strong> (source: UNEP, 2004)<br />
12
Figure 1.1.4: Map <strong>of</strong> important habitat for migration species, Important Bird <strong>Areas</strong>, and Endemic Bird <strong>Areas</strong><br />
(source: Ministry <strong>of</strong> forestry, 2002; Birdlife <strong>In</strong>ternational, 1998 and 2003)<br />
13
HCV 1.3; <strong>Areas</strong> that Contain Habitat for Viable Populations <strong>of</strong> Endangered, Restricted<br />
Range or Protected Species<br />
HCV 1.3 aims to identify habitats that can sustain viable populations <strong>of</strong> protected,<br />
endangered, or restricted range species. An area containing sufficient concentrations <strong>of</strong> such<br />
species, is thus recognized as HCV 1.3. Habitat loss and fragmentation are among the most<br />
common threats facing endangered species. Often habitat loss and fragmentation, combined<br />
with the natural heterogeneity <strong>of</strong> landscapes, forces species to exist in multiple populations<br />
inhabiting relatively isolated habitat patches (Acakaya, 1996).<br />
The more land that is cleared, the more animal populations will be concentrated in an area too<br />
small to sustain viable population. Whereas this will give a short term impression <strong>of</strong> a<br />
landscape "teeming with wildlife", the long term prospects will be severely reduced numbers<br />
and population viability and resources are rapidly depleted. The viability <strong>of</strong> a population can<br />
be assessed based on knowledge <strong>of</strong> the number <strong>of</strong> individuals present in an assessment area,<br />
or by drawing inference given the potential carrying capacity <strong>of</strong> available habitat in the<br />
landscape <strong>of</strong> which the assessment area forms a part (HCV Consortium, 2008).<br />
The assessment should identify the presence <strong>of</strong> habitats that could sustain viable populations<br />
<strong>of</strong> protected, endangered, or restricted range species in, or near the concessions. To identify<br />
the presence <strong>of</strong> HVC 1.3 the following tasks have been performed:<br />
• Identify where different habitat types intersect within the concession.<br />
• Decide if these give rise to concentrations <strong>of</strong> threatened endangered or endemic<br />
species.<br />
The species that need to be considered to assess the presence <strong>of</strong> HCV 1.3 include species that<br />
are categorized as:<br />
• Endangered or Vulnerable in accordance with IUCN’s Red list (see also HCV 1.2)<br />
• Protected species by the Government <strong>of</strong> <strong>In</strong>donesia under the Act No. 7 (see also HCV<br />
1.2)<br />
• CITES Appendix 1 and 2 (see also HCV 1.2)<br />
• Endemic species (e.g. Important Bird Area (IBA), Endemic Bird Area (EBA), see<br />
also HCV 1.2)<br />
Data <strong>In</strong>put<br />
To identify the presence <strong>of</strong> these species, the following datasets were used:<br />
• Forest cover 2005 map (source: ministry <strong>of</strong> forestry). It is assumed that areas with<br />
large intact forest cover contain a natural ecosystem (>20.000 ha) that can support<br />
viable populations <strong>of</strong> the listed species.<br />
• Distribution <strong>of</strong> Orangutan (source: WCMC 2004). (see also HCV 1.2)<br />
• Orangutan Population and Habitat Viability Assessment (Singleton et al. (2004), see<br />
also HCV 1.2).<br />
• IBA and EBA (Birdlife <strong>In</strong>ternational, 1998 and 2003). (see also HCV 1.2).<br />
• Distribution <strong>of</strong> large Mammals ; Elephant, Banteng, Rhino (source: Rautner et al<br />
(2005), see also HCV 1.2).<br />
14
To verify the presence <strong>of</strong> HCV 1.3, both the quality and the quantity <strong>of</strong> the species listed<br />
above are assessed.<br />
Findings<br />
If there is no forest or natural ecosystem (an area where ecological processes<br />
remain unperturbed, see also (HCV Consortium, 2008)) then HCV 1.3 is unlikely to be<br />
present, since these conditions are assumed to be necessary to be able to sustain viable<br />
populations. Based on analysis <strong>of</strong> the literature and spatial data, it is found that no habitat is<br />
likely to be present inside the 30 concessions that can support a viable population <strong>of</strong><br />
endangered, restricted or protected species.<br />
Required field data<br />
For the desk-based analysis it can be concluded that HCV 1.3 is absent for all pre-selected<br />
concessions. However, considering the uncertainties <strong>of</strong> the land cover data, and the<br />
limitations <strong>of</strong> the distribution data (see also HCV 1.2) field verification is recommended on<br />
the presence <strong>of</strong> natural ecosystems and endangered species.<br />
HCV 1.4 <strong>Areas</strong> that Contain Habitat <strong>of</strong> Temporary Use by Species or<br />
Congregations <strong>of</strong> Species<br />
HCV 1.4 identifies key habitats temporarily used by a collection <strong>of</strong> individuals or species in a<br />
landscape. <strong>In</strong> addition to key habitats, areas that harbor concentrations <strong>of</strong> migratory species or<br />
important migration routes are considered here. Key habitats can also be a place <strong>of</strong> refuge<br />
(refugium) for a species during the long dry season for drinking, floods or fires. All the<br />
habitats identified as HCV 1.4 have the similar characteristic that if the habitat is lost then the<br />
impact on the population <strong>of</strong> some particular species will be very significant, even though the<br />
area itself might be relatively small. Examples <strong>of</strong> such temporary key habitats are:<br />
• Places to breed or nest, e.g. caves or wetland habitats used by several bird, bat and<br />
reptile species.<br />
• Places along main migration routes (bird species transit in <strong>West</strong> <strong>Kalimantan</strong> in<br />
migrating from the pole to areas on the other side <strong>of</strong> the equator)<br />
• Local wildlife movement paths (corridors) where individuals can move between<br />
different ecosystems in the search for food with seasonal availability (HCV<br />
Consortium, 2008)<br />
Data input<br />
<strong>Areas</strong> that are considered to have an important function as a temporary habitat are: extensive<br />
mangroves, freshwater swamp forest, peat swamp forest, riparian forest. To identify these<br />
areas, the following data-sources were used:<br />
• Land cover <strong>West</strong> <strong>Kalimantan</strong>, 2006 (WWF, 2009). This data is used to identify areas<br />
with: mangroves, freshwater swamp forest and riparian forest<br />
• IBA and EBA (source: Birdlife <strong>In</strong>ternational, 1998 and 2003). This data is used to<br />
identify important migration areas for bird species.<br />
• <strong>West</strong> <strong>Kalimantan</strong> Peat Land <strong>Areas</strong> (source: Wetland <strong>In</strong>ternational, 2002). This data is<br />
used to identify peat swamp forest.<br />
15
Findings<br />
Based on existing literature, the following important habitats were identified in <strong>West</strong><br />
<strong>Kalimantan</strong>: Gunung Palung NP, Betung Kerihun NP, Danau Sentarum NP, Bukit Baka –<br />
Bukit Raya NP, Kendawang Wildlife Sanctuary, Gunung Nyiut Perinsen, Gunung Poteng,<br />
littoral areas <strong>of</strong> Paloh swamp, and littoral areas <strong>of</strong> Kapuas swamp.<br />
<strong>In</strong> the desktop analysis on HCV 1.4, using 2005 land cover <strong>of</strong> <strong>West</strong> <strong>Kalimantan</strong> data and the<br />
literature data, found that there was no temporary habitat used by the species or congregations<br />
<strong>of</strong> species within the concessions (HCV Consortium, 2008). <strong>In</strong> the desk-based analysis HCV<br />
1.4 was found not present.<br />
Required field data<br />
Based on the desktop study, HCV 1.4 is considered absent in all concessions. The accuracy <strong>of</strong><br />
the data on migratory species is considered limited, and verification on the temporal presence<br />
<strong>of</strong> such species is thus recommended by experts for the fieldwork (pers. comm. Yana<br />
Suryadinata (TNC)).<br />
16
HCV 2.1 Large Natural Landscapes with Capacity to Maintain Natural<br />
Ecological Processes and Dynamics<br />
HCV 2.1 aims to protect the ecological functions within a natural landscape in which natural<br />
ecosystem processes have the potential for a continued long-term future. The main objective<br />
is to identify and protect core areas <strong>of</strong> the landscape that ensure natural ecological processes<br />
can take place without negative influence <strong>of</strong> fragmentation and edge effects.<br />
The definition <strong>of</strong> a landscape with a core area is; a forest block (or other natural landscape<br />
mosaic) with an internal core larger than 20,000 ha surrounded by a natural vegetation buffer<br />
<strong>of</strong> at least 3 km from the forest edge (HCV Consortium, 2008). Every concession that is<br />
within, or is part <strong>of</strong> a landscape with such a core area is potentially a HCV 2.1. To verify this<br />
both the condition and the size <strong>of</strong> the ecosystem the concessions has to be assessed. <strong>In</strong><br />
addition, the potential impact <strong>of</strong> the conversion on the large natural landscapes under HCV<br />
2.1 has to be included in the analysis.<br />
Data <strong>In</strong>put<br />
To verify the proximity <strong>of</strong> core areas to the concessions, and the impact <strong>of</strong> potential<br />
conversion <strong>of</strong> any MU on any large forest landscape, the following datasets were used:<br />
• Land system classification for <strong>In</strong>donesia, (source: RePPProT 1989). This data is used<br />
to assess the type <strong>of</strong> landscape present based on: parent material, hydro climate,<br />
landform, soil and vegetation<br />
• Land cover <strong>West</strong> <strong>Kalimantan</strong>, 2006 (WWF, 2009). This dataset was used to identify<br />
the presence <strong>of</strong> forest blocks (larger than 20.000 ha). This dataset is used in addition<br />
to RePPProT, since up to date land cover data is required for a reliable analysis.<br />
Findings<br />
Based on the analysis done using RePPProT and the land cover data, it was found that HCV<br />
2.1 is potentially present in one concession (nr. 25, see also figure 2.1). Although the size <strong>of</strong><br />
this concession is less than 20,000 ha (requirement to qualify as HCV 2.1), it forms a part <strong>of</strong> a<br />
larger natural ecosystem in which the concession covers a potential corridor for orangutan.<br />
Required field data<br />
Because the land cover and land system data used in this analysis is not <strong>of</strong> sufficient quality,<br />
it is possible that other concessions also contain HCV 2.1. Considering the precautionary<br />
principle, it is recommended that the current land cover is verified in the field.<br />
17
Figure 1.2.1: Map <strong>of</strong> potential corridors between orangutan habitats<br />
18
HCV 2.2 <strong>Areas</strong> that Contain Two or More Contiguous Ecosystems<br />
<strong>Areas</strong> supporting a diversity <strong>of</strong> ecosystems, in general support great numbers <strong>of</strong> species and<br />
have high capacity to sustain them in the long term. The maintenance <strong>of</strong> ecosystem types,<br />
especially those co-occurring within a single landscape, is a major goal <strong>of</strong> local conservation,<br />
it guarantees the movement <strong>of</strong> species among ecosystems and the flow <strong>of</strong> materials and<br />
energy in the face <strong>of</strong> environmental changes (like fluctuating food availability, extreme<br />
weather and changing climate). HCV 2.2 aims to identify landscapes that contain multiple<br />
ecosystem types, to protect their core areas and to maintain connectivity among these types<br />
(HCV Consortium, 2008).<br />
Data <strong>In</strong>put<br />
Transition areas between ecosystems (ecotone area’s) <strong>of</strong>ten contain relatively high<br />
biodiversity levels, especially the transition zone between swamp and non-swamp, or heath<br />
forest and non-heath forest. (HCV Consortium, 2008). <strong>In</strong> mountainous areas these zones can<br />
be distributed along different elevation gradients, for example those including transitions<br />
between lowland forest to sub-montane and montane forest. Therefore, to be able to assess the<br />
status <strong>of</strong> the ecotone regions, the boundaries between the relevant ecosystems proximate to<br />
the concessions have to be identified. Data on land systems will be used to identify ecosystem<br />
transition zones (ecotone regions), in addition land cover data will be used to verify whether<br />
these areas are still intact. To verify the proximity to or the presence in the concessions <strong>of</strong> any<br />
important ecotone areas, the following dataset was used:<br />
• Land system map, (source: RePPProT 1989). This datasets were used to identify the<br />
different ecosystems in the landscape as well as the ecotone regions.<br />
• Forest cover 2006 map (source: WWF 2009). This dataset is use in addition to<br />
RePPProT to assess the current status <strong>of</strong> the ecosystems present. For example when<br />
the vegetation cover is lost, the ecotone areas no longer exist.<br />
• <strong>West</strong> <strong>Kalimantan</strong> Peat land <strong>Areas</strong> (Wetlands <strong>In</strong>ternational, 2002). This dataset was<br />
used to identify the transition areas from peat to non-peat.<br />
Findings<br />
From the analysis it was found that none <strong>of</strong> the concessions contains areas considered as<br />
ecotone, or an area where two intact ecosystems overlap. Almost all the land inside the<br />
concession has lost forest cover. Even if areas with important ecosystems where present here<br />
in the past, it can be assumed that these are lost.<br />
Required field data<br />
As mentioned previously, the findings from the land cover data have to be verified in the<br />
field, since the accuracy <strong>of</strong> the classes ‘agricultural land’ or ‘open land’ (most prominent in<br />
the concessions) is limited (pers. Com. Niels Wielaard, SarVision).<br />
HCV 2.3 <strong>Areas</strong> that Contain Representative Populations <strong>of</strong> Most Naturally<br />
Occurring Species<br />
The <strong>In</strong>donesian HCV Toolkit states that an area containing a minimum viable population<br />
(MVP) <strong>of</strong> most naturally occurring species is an HCV 2.3. The long-term presence <strong>of</strong> a<br />
species requires maintaining habitat <strong>of</strong> sufficient quality and extent for population viability.<br />
To identify areas that contain representative populations <strong>of</strong> most naturally occurring species,<br />
19
HCV 2.3 employs several proxies. These include landscapes with populations <strong>of</strong> higher<br />
predators <strong>of</strong> different taxa (e.g., tigers, leopards, and eagles) or a low density <strong>of</strong> far ranging<br />
species (e.g., orangutans and elephants) that require large areas to persist (HCV Consortium,<br />
2008).<br />
To support minimum viable population, a larger forested landscape has to be considered. To<br />
assess this, concessions that contain viable populations <strong>of</strong> potential umbrella species have to<br />
be identified. Since these species may not always have been signaled, from a precautionary<br />
principle areas containing large natural forests are dealt with with caution. Concessions that<br />
contain sufficient extent <strong>of</strong> forest that would be large enough to support such populations are<br />
therefore also identified. Since this is in line with the analysis related to HCV 2.1, those<br />
related findings are also considered here.<br />
Data <strong>In</strong>put<br />
To assess the presence <strong>of</strong> species considered in HCV 2.3 the following datasets are used:<br />
• Land cover <strong>West</strong> <strong>Kalimantan</strong>, 2006 (WWF, 2009). This dataset is used to identify<br />
large forest areas in the proximity <strong>of</strong> the concessions that can provide a habitat for the<br />
species considered under HCV 2.3 (see HCV 1.2).<br />
• Distribution <strong>of</strong> orangutan (WCMC 2004). To identify overlap with umbrella species,<br />
the identified species suitable for such an analysis (based on the distribution and data<br />
available) is the orangutan. The orangutan distribution data was used to assess the<br />
overlap <strong>of</strong> the habitat <strong>of</strong> this umbrella species with the concessions. (see HCV 1.2).<br />
• Orangutan Population and Habitat Viability Assessment (Singleton, 2004). The<br />
orangutan distribution data was used to in addition to the WCMC data ro assess the<br />
overlap <strong>of</strong> umbrella species with the concessions. (see HCV 1.2).<br />
To identify the HCV 2.3 presence from the data above, the overlap and proximity to the<br />
(potential) habitats 30 concessions has been analyzed.<br />
Findings<br />
None <strong>of</strong> concessions were found to overlap with an umbrella species habitat. However, one<br />
concession (nr. 25) was found to be between 2 orangutan habitats, and this area is likely to<br />
form a corridor. Although this corridor area is not part <strong>of</strong> the main habitat, it is likely to be<br />
important for the viability <strong>of</strong> the species, since this migration potential increases genetic<br />
variability in both populations.<br />
Required field data<br />
Based on the desk-based analysis, HCV 2.3 is unlikely to be present the preselected areas.<br />
Due to the potential corridor function <strong>of</strong> a part <strong>of</strong> concession 25, this concession, and its<br />
function as a corridor should be examined in more detail. However, due to the uncertainty in<br />
the land-cover data it is thus recommended that the land cover is verified in the field, and<br />
confirm HCV 2.3 is indeed absent.<br />
20
HCV 3 Rare or Endangered Ecosystems<br />
Ecosystems can be classified as rare or threatened due to natural factors that limit its<br />
distribution (e.g. Karst forest is found only on limestone), as a result <strong>of</strong> land cover changes<br />
and degradation caused by anthropogenic activity. HCV 3 aims to identify rare or endangered<br />
ecosystems in a landscape. Ecosystems can be considered a plant and animal community,<br />
including its physical environment, which together functions as an inseparable unit (HCV<br />
Consortium, 2008). Different ecosystems harbor different communities, environmental<br />
biophysics and patterns <strong>of</strong> interaction between all organisms. To preserve the variety <strong>of</strong><br />
environmental services, representative samples <strong>of</strong> ecosystem types should be maintained<br />
(HCV Consortium, 2008). The types <strong>of</strong> ecosystem recommended to preserve include rare<br />
forests such as freshwater swamp forests or peat swamp forests, but can also refer to<br />
ecosystem types formerly widespread but declining rapidly (see also HCV Consortium,<br />
2008).<br />
To assess whether an ecosystem is rare or endangered, an analysis has to be made comparing<br />
the current condition <strong>of</strong> bio-physiographic situation at the landscape level with the historical<br />
condition and predict future trends. If one ecosystem was reduced with more than 50%<br />
compared to the historical situation, or if it is likely to decrease with more than 75% in the<br />
future as a result <strong>of</strong> forest conversion, the ecosystem can be classified as HCV 3 (see also<br />
HCV Consortium, 2008). Although a large proportion <strong>of</strong> the natural land ecosystems in<br />
<strong>In</strong>donesia are forest ecosystems, other aquatic ecosystems such as lakes and open swamps or<br />
marshlands should also be considered (HCV Consortium, 2008). <strong>In</strong> case a concession<br />
contains a significant size <strong>of</strong> such rare or endangered ecosystem types, the area will be<br />
considered under HCV 3. Furthermore, any rare or endangered ecosystem that is located<br />
outside the management unit and likely to be negatively affected as a result <strong>of</strong> the conversion<br />
<strong>of</strong> the area, will also result in the concession being identified as HCV 3. Therefore, for each<br />
concession it has been assessed:<br />
• What the extent and quality is <strong>of</strong> ecosystems found in the landscape where the<br />
concessions are located.<br />
• What ecosystem types are present within the concessions and whether these are rare,<br />
threatened or endangered in the wider landscape.<br />
• Whether any areas are present that are identified by an independent organization as<br />
important for conservation.<br />
Data input<br />
To assess the presence <strong>of</strong> HCV 3 the following data was used:<br />
• Forest cover 2006 (source: WWF, 2008). This dataset is used to identify large forest<br />
area’s in the proximity <strong>of</strong> the concessions.<br />
• Land system map, (source: RePPProt 1989). This dataset is used to assess the type <strong>of</strong><br />
forest present.<br />
• Forest Class Zone (MoF, 2002), in this data the forest is classified based on the<br />
system as proposed by the MoF in 2002). This dataset is used to assess the type <strong>of</strong><br />
forest present.<br />
• Peat land <strong>Areas</strong> (Wetlands <strong>In</strong>ternational, 2002). This dataset is used to identify<br />
unique ecosystems.<br />
21
• Asian Karst Data (source: School <strong>of</strong> Environment, The University <strong>of</strong> Auckland,<br />
http://www.sges.auckland.ac.nz/research/karst.shtml) This dataset is developed by<br />
Ford & Williams in 1989, the revision was published in 2007 was used here to<br />
identify unique karst ecosystems.<br />
Findings<br />
Based on the analysis it was found that there are 4 concessions (nr’s 8, 17, 18, 22) that<br />
potentially contain peat land. However, only one <strong>of</strong> these concessions (nr. 22) contains an<br />
area <strong>of</strong> peat with a relatively large size compared to the whole concession (about 4,600 ha,<br />
see also table: 1.3). According to the data analyzed, no other ecosystems that could qualify as<br />
HCV 3 were found in the preselected areas.<br />
Nr Name Soil Proportion Depth Hectares<br />
5 PT. <strong>Kalimantan</strong> Bina Permai Hemists/Mineral 4 50-100 90<br />
14 PT. Maiska Bhumi Semesta Hemists/Mineral 4 50-100 59<br />
15 PT. Mestika Karunia Abadi Hemists/Fibrists 1 1/2 100-200 191<br />
19 PTP. XIII Hemists/Mineral 4 50-100 4,579<br />
Table 1.3: The status <strong>of</strong> peat inside concessions.<br />
Required field data<br />
Also in this case, the precautionary principle should be considered. Since the data available to<br />
assess the presence <strong>of</strong> HCV 3 has considerable limitations (especially the data on peat and<br />
land systems have a low resolution, 1:250.000), a field assessment on land cover is strongly<br />
recommended, even though no significant areas containing HCV 3 were identified in the<br />
desktop analysis.<br />
22
HCV 4.1 <strong>Areas</strong> or Ecosystems Important for the Provision <strong>of</strong> Water and<br />
Prevention <strong>of</strong> Floods for Downstream communities<br />
Land use activities or forest use in a watershed <strong>of</strong>ten results in the degradation <strong>of</strong> land due to<br />
disturbance in the water cycle. The main parties that feel consequences <strong>of</strong> this degradation are<br />
downstream communities. Land cover water catchment areas consisting <strong>of</strong> forest in good<br />
condition functions to regulate water downstream. If a forest area is found to play a role in the<br />
production <strong>of</strong> clean water or to control flooding in downstream communities, then it qualifies<br />
as HCV 4.1 (HCV Consortium, 2008).<br />
There are several land- and forest ecosystems that have exceptional hydrological functions<br />
that should be attended to. For example wetland and forest eco-systems, are included in HCV<br />
4.1. <strong>In</strong> addition, there are several terrestrial ecosystems (for example cloud forest, ridge line<br />
forest, riparian ecosystems, karst forest) that have an extremely important hydrological<br />
function and require special attention.<br />
Data input<br />
To identify the potential presence <strong>of</strong> this HCV, the data below is collected and analyzed:<br />
• Priority Water Catchment <strong>Areas</strong> (Source Ministry <strong>of</strong> Forestry 1999 – 2009). This data<br />
is used to identify watersheds. Priority <strong>Areas</strong> are watersheds classified by priority for<br />
conservation (the MoF defined criteria related to the status <strong>of</strong> the land in terms <strong>of</strong><br />
erosion and land cover, water quality, water use, the context in the land use plan, see<br />
also HCV consortium, 2008).<br />
• Land cover <strong>West</strong> <strong>Kalimantan</strong>, 2006 (WWF, 2009). This data is used to identify<br />
riparian zones. Remaining forest cover along the river has to be identified, since such<br />
areas can qualify as an HCV 4.1 if it is likely to affect the hydrological situation<br />
watersheds.<br />
• Asian Karst Data (source: School <strong>of</strong> Environment, The University <strong>of</strong> Auckland,<br />
http://www.sges.auckland.ac.nz/research/karst.shtml) This dataset is developed by<br />
Ford & Williams in 1989, (the revision was published in 2007) used here to identify<br />
unique karst ecosystems.<br />
Findings:<br />
It was found that there are three high priority water catchments, and 5 low priority water<br />
catchments in <strong>West</strong> <strong>Kalimantan</strong> (identified in 1994 – 1999). A follow up study indicated that<br />
<strong>West</strong> <strong>Kalimantan</strong> has become critical in terms <strong>of</strong> water management and hence needs serious<br />
and good management in water sector. The status <strong>of</strong> watershed present in 30 concessions can<br />
be seen in table 1.4.1 (see also appendix 1 figure 1.4.1 and table 1.4.1).<br />
No Name Forest Cover Class Total Required buffer<br />
23<br />
zone (ha)<br />
1 PT. <strong>In</strong>ma Makmur Lestari Secondary Dry land Forest 123<br />
4 PT. Selaras Mukti Lestari Secondary Dry land Forest 132<br />
8 PT. <strong>In</strong>doresins Putra Mandiri Secondary Dry land Forest 18<br />
9 PT. Putra <strong>In</strong>dotropical Secondary Dry land Forest 13<br />
11 PT. Mitra Austral Sejahtera Secondary Swamp Forest 7<br />
12 PT. Prana Reksa Karya Secondary Dry land Forest 27
18 PTP. XIII Secondary Dry land Forest 17<br />
20 PT. Bintara Tani Nusantara Secondary Dry land Forest 230<br />
23 PT. Tanjung Berkah Mulia Secondary Dry land Forest 43<br />
24 PT. Mustika Agung Sentosa Secondary Dry land Forest 26<br />
27 PT. Borneo Khatulistiwa Sawit Secondary Dry land Forest 19<br />
28 PT. Bangun Nusa Mandiri Secondary Dry land Forest 92<br />
Table 1.4.1. Concessions that have 100 m wide forest along the river and the total required buffer zone<br />
<strong>Areas</strong> in proximity to the river, the buffer-zones, are considered HCV 4.1 and should be<br />
maintained. HCV 4.1 was found to be present in the concessions 1, 4, 8, 9, 11, 12, 18, 20, 23,<br />
24, 27, 28 ((based on the minimum requirements in decree No. 128/Kpts/V/1997, see table<br />
1.4.1). Although this does not mean these areas cannot be used for oil palm cultivation (since<br />
the value only covers a relatively small portion <strong>of</strong> the land), in the development <strong>of</strong> the<br />
plantation the watershed areas have to be managed (see appendix 1.4.1 and table 1.4.1 as well<br />
as HCV Consortium, 2008).<br />
Required field work<br />
The identified areas considered as HCV 4.1 are relatively small, and thus do not make the<br />
concessions unsuitable for potential conversion. However, in the management plan the<br />
presence <strong>of</strong> the HCV 4.1 should be considered. Based on the uncertainty <strong>of</strong> the data used<br />
(very course scale <strong>of</strong> the data), field verification is recommended to precisely map the<br />
location <strong>of</strong> water sources and required buffer-‐zones.<br />
HCV 4.2 <strong>Areas</strong> Important for the Prevention <strong>of</strong> Erosion and Sedimentation<br />
Erosion and sedimentation have significant ecological and economic consequences at the<br />
landscape level. Surface erosion causes the loss <strong>of</strong> topsoil, which in turn decreases the<br />
productivity <strong>of</strong> the land. Morpho-erosion like landslides or the creation <strong>of</strong> ravines reduces the<br />
area <strong>of</strong> productive land, damages economic infrastructure and increases sediment loads.<br />
Under natural conditions, the rate <strong>of</strong> soil erosion is approximately equal to the rate <strong>of</strong> soil<br />
formation. <strong>In</strong> disturbed environments, accelerated erosion is extremely destructive and bears<br />
high cost in time and money to control it. Among factors that affect erosion rates, those which<br />
can be fully controlled by humans are land cover and soil conservation practices. Natural<br />
forest land cover is much more effective than non-forest at reducing erosion levels, due in<br />
large part to a closed canopy, complex understory and surface leaf litter protecting the soil<br />
(HCV Consortium, 2008)).<br />
To assess the erosion risk the HCV toolkit proposes to use an adjusted version <strong>of</strong> the USLE<br />
(R x K x LS) in which the vegetation parameter C is excluded (see for a detailed explanation<br />
<strong>of</strong> the method HCV consortium, 2008). Based on USLE methodology, the erosion factor is<br />
categorized into 5 levels: Very Low, Low, Moderate, High, Very High (see also table 4.2.1).<br />
24
25<br />
Soil Loss (ton/ha/year)<br />
Erosion Class 1 2 3 4 5<br />
Soil Depth 480<br />
Depth (>90 cm) Very low Low Medium High Very high<br />
Middle (60-90 cm) Low Medium High Very high Very high<br />
Thin (30-60 cm) Medium High Very high Very high Very high<br />
Very Thin (
Figure 1.4.2: Map indicating soil erosion risk in <strong>West</strong> <strong>Kalimantan</strong> Province<br />
26
HCV 4.3: <strong>Areas</strong> that Function as Natural Barriers to the Spread <strong>of</strong> Forest or<br />
Ground Fire<br />
Forest fires in <strong>In</strong>donesia have become a serious problem, which until now has not been<br />
resolved. Forest fires affect almost all parts <strong>of</strong> <strong>In</strong>donesia, such as Central <strong>Kalimantan</strong>, <strong>West</strong><br />
<strong>Kalimantan</strong>, South Sumatra, Jambi, and Riau with intervals 1987, 1991, 1997/1998, and year<br />
2006. Various types <strong>of</strong> natural forests like, intact peat swamp forests, swamp forests, pool<br />
areas, and other wetlands that are still in good condition have physical attributes that mitigate<br />
the risk <strong>of</strong> large-scale fire. <strong>Areas</strong> that can protect and prevent forest fires on a large scale are<br />
considered areas containing HCV 4.3.<br />
To identify HCV 4.3, the fire occurrences inside and around the concessions have been<br />
checked. It is assumed that when an area is burned over repeatedly, HCV 4.3 is not present <strong>In</strong><br />
addition potential fire barriers have been identified, such as large forest areas and wetland<br />
ecosystems inside or around the concession.<br />
Data input<br />
To assess the presence <strong>of</strong> HCV 4.3 in the 30 concessions, the following data sources are used:<br />
• Land cover <strong>West</strong> <strong>Kalimantan</strong>, 2006 (WWF, 2009) The land cover data was used to<br />
identify any large forest area, that potentially functions as a barrier for large scale fire<br />
is present in or proximate to the concessions.<br />
• Peat and wetland <strong>Areas</strong> (Wetland <strong>In</strong>ternational, 2002). This dataset is used to identify<br />
wetlands, since these have a high potential <strong>of</strong> functioning like a barrier.<br />
• Forest Fire data (source: NOAA and MODIS Rapid Response). This data was used to<br />
assess the occurrence <strong>of</strong> fire in or around the concessions. If the area burned severely<br />
in the recent past, it can be assumed that no HCV 4.3 is present.<br />
Findings<br />
Based on the analysis no significant fire barriers such as large wetland forest, or large blocks<br />
<strong>of</strong> primary forests were found inside the concessions. <strong>In</strong> addition, based on the historical data,<br />
many fires were found to have occurred proximate, or in the concessions (see table 4.3).<br />
Therefore it is concluded from the desktop study that HCV 4.3 is absent in all 30 concessions.<br />
Required field data<br />
Since no significant barriers were indicated, and both the resolution and the quality <strong>of</strong> the data<br />
are <strong>of</strong> sufficient detail for the purpose <strong>of</strong> our analysis, no further verification data is required.<br />
27
No. Name 2000 2002 2003 2004 2005 2006 2007<br />
<strong>West</strong> <strong>Kalimantan</strong> 648 2,331 4,112 8,002 3,434 12,948 2,271<br />
<strong>In</strong>side 30 MUs 14 51 225 351 204 370 72<br />
% from Province 2% 2% 5% 4% 6% 3% 3%<br />
1 PT. <strong>In</strong>ma Makmur Lestari 1 10 18 16 27 5<br />
2 PT. Global <strong>Kalimantan</strong> Makmur 4 18 12 21 38 5<br />
3 PT. Malindo Persada Khatulisti 5 11 12 5 5<br />
4 PT. Selaras Mukti Lestari 16 14 14 7<br />
5 PT. <strong>Kalimantan</strong> Bina Permai 1 13 8 3 7 4<br />
6 PT. Grand Utama Mandiri 3 3 1 4<br />
7 PT. Pratama Prosentindo 5 5 2 1<br />
8 PT. <strong>In</strong>doresins Putra Mandiri 3 6 4 5<br />
9 PT. Putra <strong>In</strong>dotropical 5 3 2 1 4<br />
10 PTP. XIII 8<br />
11 PT. Mitra Austral Sejahtera 1 11 7 5 7 8<br />
12 PT. Prana Reksa Karya 5 1 6 3<br />
13 PT. Maiska Bhumi Semesta 14 16 15 21 2<br />
14 PT. Mestika Karunia Abadi 1 14 12 11 2 8<br />
15 PT. Sime <strong>In</strong>doagro 4 5 7 4 1<br />
16 PT. Bumi Pratama Khatulistiwa 1 15 9 15 23 3<br />
17 PT. Multi Prima Entakai 1 1 18 11 13 7 1<br />
18 PTP. XIII 7 20 6 3<br />
19 PT. Multi Jaya Perkasa 8 12 8 9 1<br />
20 PT. Bintara Tani Nusantara 2 6 3 5 10 6 3<br />
21 PT. Bintang Harapan Desa 1 3 2<br />
22 PT. Sumatra Makmur Lestari 2 6 11 3 4 1<br />
23 PT. Tanjung Berkah Mulia 3 12 19 9 20 2<br />
24 PT. Arvena Sepakat 1 2 15 1 4 1<br />
25 PT. Mustika Agung Sentosa 4 12 6 19 1<br />
26 PT. SMART (Sinar Mas Group) 5 7 17 47 7<br />
27 PT. Borneo Khatulistiwa Sawit 1 5 6 31 1 39 3<br />
28 PT. Bangun Nusa Mandiri 14 1 28<br />
29 No-<strong>In</strong>fo yet 3<br />
30 No-<strong>In</strong>fo yet 6 22 16 51 7 23<br />
Table 1.4.3: Occurred fires in the 30 concessions in <strong>West</strong> <strong>Kalimantan</strong> during 2000 - 2007<br />
28
HCV 5: Natural <strong>Areas</strong> Critical for Meeting the Basic Needs <strong>of</strong> Local People<br />
This HCV aims to identify the natural areas that have important functions as a source <strong>of</strong><br />
livelihood for local communities, both to meet the direct needs (subsistence/consumption) or<br />
indirectly (commercial), namely by selling products (forest products or other natural<br />
resources) to meet financial needs. Basic needs include: food, water, clothing, materials and<br />
equipment for homes, fuel wood, medicines, and animal feedings.<br />
A natural area is identified as HCV 5, if one or more community members use the area in<br />
order to meet the basic needs, and no affordable alternative is present. The value is present<br />
when 50% or more <strong>of</strong> a single basic need is met by the use <strong>of</strong> natural ecosystems (see also<br />
(HCV Consortium, 2008). An important factor to take into account is the existence <strong>of</strong> market<br />
access. Isolated communities may be largely dependent on forests or other natural<br />
ecosystems. However, communities with good accessibility, market access and<br />
communication networks will be more able to switch to other means to meet their basic<br />
needs.<br />
<strong>In</strong> addition, the use <strong>of</strong> the forests resources must be sustainable and not excessive. This means<br />
that HCV 5 is not present in the application <strong>of</strong> traditional practices that damage or threaten<br />
other HCV, such as excessive hunting <strong>of</strong> endangered species (HCV 1.2).<br />
Data input<br />
To assess the presence <strong>of</strong> HCV 5, the basic needs related to: food, water, clothing, materials<br />
for the house and tools, firewood, medicine, and livestock originating from areas in the<br />
concessions have to be identified.<br />
Finding<br />
No desk-based data on how local populations meet their basic needs was found.<br />
Required field data<br />
<strong>In</strong>formation has to be gathered on where basic needs <strong>of</strong> the local communities are obtained<br />
from and which alternatives may be available.<br />
29
HCV 6: <strong>Areas</strong> Critical for Maintaining the Cultural Identity <strong>of</strong> Local<br />
Communities<br />
HCV 6 concerns areas that play an important role in the traditional cultural identity <strong>of</strong> local<br />
communities and/or where a particular area is needed to fulfill their cultural needs. The<br />
relationship between a community and an area can be rooted in ideas, concepts, norms,<br />
values, activities, and activity patterns, as well as features <strong>of</strong> the environment/natural<br />
resources/objects. Together, these features form the basis <strong>of</strong> a collective behavior <strong>of</strong> a<br />
community and that define the relationship between a community and an area (HCV<br />
Consortium, 2008).<br />
Unique cultural identity is the identity emerging from a collective <strong>of</strong> individuals<br />
(communities) who lived in a certain area, based on shared historical background and<br />
common collective interpretation <strong>of</strong> the surrounding environment and resources. The<br />
interaction between the community and the natural environment is unique and can't be<br />
separated if it would disrupt the pattern <strong>of</strong> life or ecological balance that has been built (HCV<br />
Consortium, 2008).<br />
Thus an area may be designated HCV 6 if it provides values without which a local<br />
community would suffer a drastic cultural change.<br />
Data input<br />
To be able to identify HCV 6, an inventory must be made <strong>of</strong> the areas in the concessions that<br />
are critical to the maintenance <strong>of</strong> communities’ traditional cultural identity. <strong>In</strong> addition the<br />
relevant cultural ties to natural areas in the concessions have to be identified, as well as the<br />
types <strong>of</strong> community forest management that may lead to irreversible change in case this is not<br />
continued.<br />
Finding<br />
The information and the data related to HCV 6 that is needed to perform the analysis could<br />
not be found.<br />
Required field data<br />
Data on HCV 6 must be collected in specifically designed fieldwork. The information<br />
required can be obtained through focus group discussions (FGD), Participatory Rural<br />
Appraisal (PRA) or by directly interviewing the communities. It is recommended that this is<br />
done for specific concessions on a site level.<br />
30
P2: Establishment <strong>of</strong> energy crop plantations does not lead to<br />
significant reductions in carbon stocks<br />
As outlined in the methodology for RCA (Dehue, 2009), both the (dominant) land cover, and<br />
the presence <strong>of</strong> high carbon soils, such as peat soils, have to be identified to assess whether or<br />
not the carbon stocks in the concession will be significantly reduced in case <strong>of</strong> conversion to<br />
energy crop plantation. The threshold value for the carbon payback time resulting from<br />
emissions from land use change may not exceed 10 years.<br />
Data input<br />
To estimate <strong>of</strong> the above ground carbon stock in each concession, secondary data and<br />
literature data will be used. This approach is in line with the IPCC guidelines in tier 2. <strong>In</strong> the<br />
estimation <strong>of</strong> carbon stocks based on present biomass, the carbon content is estimated 50% <strong>of</strong><br />
the biomass (Gibbs, 2006). <strong>In</strong> line with the IPCC Tier 1 methodology, no significant change<br />
in soil carbon is assumed in the conversion <strong>of</strong> grassland or forest to a perennial crop such as<br />
oil palm (see also Vlek, 2005). For the consistency <strong>of</strong> the study, the same land cover data is<br />
used as applied in phase I.<br />
• Distribution wetlands (Wetlands <strong>In</strong>ternational, 2002) Used to identify the wetlands.<br />
• Carbon stocks (SEAMEO Biotrop): As a reference for carbon stock data for each<br />
land cover category, a study from SEAMEO-Biotrop was used. <strong>In</strong> this study data<br />
from several sources was collected and baselines were developed by SEAMEO-<br />
Biotrop. For the 30 concessions identified as promising RCA’s, the carbon stocks<br />
were assessed based on the stratification <strong>of</strong> the land cover. The study used a range for<br />
carbon stocks by giving minimum (low estimation) and maximum (high estimation)<br />
estimates (see also table 2.1).<br />
Findings<br />
Based on the desk-based analysis, it was found that the aboveground carbon stocks in the<br />
concessions are significantly lower than the default value for an oil palm plantation (48<br />
Mg/ha, based on Palm et al.1999. It can be concluded that the carbon stocks in the<br />
concessions are relatively low, and thus can be considered in line with RCA principle 2 (see<br />
also table 2.1). The main reason for the relatively low carbon stocks found in the concessions<br />
is due to the fact that the preselected concessions have a no or very little forest cover.<br />
Required field data<br />
Considering the uncertainties in the data used, (mainly the land cover data and the wide<br />
ranges for the carbon stocks for a given land cover type in the SEAMEO-Biotrop study), it is<br />
recommended to assess the actual land cover in the field and to make an estimate <strong>of</strong> the above<br />
ground carbon stocks <strong>of</strong> any forest re-growth patches in the preselected areas.<br />
31
No Company Hectares C/Ha LE C/Ha HE<br />
1 PT. <strong>In</strong>ma Makmur Lestari 21,470 5.7 11.7<br />
2 PT. Global <strong>Kalimantan</strong> Makmur 27,367 4.4 8.4<br />
3 PT. Malindo Persada Khatulisti 21,055 1.2 4.2<br />
4 PT. Selaras Mukti Lestari 20,029 9.5 15.8<br />
5 PT. <strong>Kalimantan</strong> Bina Permai 36,928 0.7 2.8<br />
6 PT. Grand Utama Mandiri 17,387 0.5 2.3<br />
7 PT. Pratama Prosentindo 20,086 1.0 3.0<br />
8 PT. <strong>In</strong>doresins Putra Mandiri 18,044 3.7 7.5<br />
9 PT. Putra <strong>In</strong>dotropical 19,908 3.1 6.7<br />
10 PTP. XIII 20,972 2.5 8.0<br />
11 PT. Mitra Austral Sejahtera 26,567 0.6 2.7<br />
12 PT. Prana Reksa Karya 21,819 1.9 4.3<br />
13 PT. Maiska Bhumi Semesta 20,612 0.7 3.2<br />
14 PT. Mestika Karunia Abadi 19,595 1.4 5.5<br />
15 PT. Sime <strong>In</strong>doagro 22,040 0.6 2.9<br />
16 PT. Bumi Pratama Khatulistiwa 49,480 0.8 2.8<br />
17 PT. Multi Prima Entakai 29,519 1.6 3.9<br />
18 PTP. XIII 28,682 1.1 3.5<br />
19 PT. Multi Jaya Perkasa 43,334 0.8 2.7<br />
20 PT. Bintara Tani Nusantara 19,363 10.7 18.6<br />
21 PT. Bintang Harapan Desa 16,786 0.5 2.3<br />
22 PT. Sumatra Makmur Lestari 43,944 0.6 2.6<br />
23 PT. Tanjung Berkah Mulia 19,317 2.0 4.6<br />
24 PT. Arvena Sepakat 21,989 0.8 2.7<br />
25 PT. Mustika Agung Sentosa 19,667 12.0 19.6<br />
26 PT. SMART (Sinar Mas Group) 37,209 4.4 8.9<br />
27 PT. Borneo Khatulistiwa Sawit 17,611 5.6 18.1<br />
28 PT. Bangun Nusa Mandiri 25,903 10.8 31.4<br />
29 No-<strong>In</strong>fo yet 19,734 4.1 17.8<br />
30 No-<strong>In</strong>fo yet 21,078 2.1 9.2<br />
Table 2.1: Above ground carbon Stock estimation in the 30 concessions<br />
Note: Estimation carbon stock in each concession, which is:<br />
C/Ha LE: Carbon Stock Low Estimation in Mg/hectare<br />
C/Ha HE: Carbon Stock High Estimation in Mg/hectare<br />
32
P3: Establishment <strong>of</strong> energy crop plantations respects formal and<br />
customary land rights<br />
Under principle 3, an energy crop plantation should respect formal and customary land rights,<br />
with a special focus on conflicting information about land-use planning and actual land use.<br />
To assess whether or not land rights can be respected, or that there is a high potential for<br />
conflict, both the formal land right holder as well as the holders <strong>of</strong> customary land right was<br />
identified. Recent conflicts between right holders are used as an indicator for risk for<br />
conflicting/overlapping land rights. <strong>In</strong> addition, the land use plans are assessed on potential<br />
conflict with energy crop production.<br />
Data input<br />
To assess the potential conflict on land (use) rights, the following datasets were analyzed in<br />
this phase:<br />
• Based on data available on permits issued (Plantation service, 2007), non-scientific<br />
literature (internet, newspapers, RSPO database) and interviews, the formal<br />
ownership <strong>of</strong> almost all the 30 concessions could be established.<br />
• <strong>West</strong> <strong>Kalimantan</strong> Plantation Service (Plantation service, 2007). To assess the plans<br />
for land use by the formal land right holders, the <strong>of</strong>ficial status <strong>of</strong> the concessions<br />
(active or non active) was verified.<br />
Findings<br />
The concession status and its owner were identified for most <strong>of</strong> the concessions (see<br />
Appendix 3). Most are <strong>of</strong>ficially still inactive (there hasn’t been any activity during three<br />
years to develop the plantation). For detailed information what the plan is <strong>of</strong> the local<br />
government with this land, what the land-claims are within the concessions, and what<br />
conflicts have occurred in recent history no literature data was found.<br />
Required field data<br />
To clarify the plans on land use by the government, interviews should be held with local<br />
governments and the concession holders. To obtain better insight in the current situation<br />
related to land claims and potential conflicts, a more detailed study on a concession level is<br />
required, in which representative group and experts in the local communities are interviewed.<br />
33
Figure 3.1: Map <strong>of</strong> Land use (function) in <strong>West</strong> <strong>Kalimantan</strong> Province<br />
34
P4: Establishment <strong>of</strong> energy crop plantations does not cause<br />
unwanted displacement effects<br />
To assess whether the establishment <strong>of</strong> energy crop plantations does not cause unwanted<br />
displacement effects in line with principle 4, it must be clarified what the current provisioning<br />
services are. For this purpose, existing plantations and agricultural land used by local<br />
communities are identified and mapped. <strong>In</strong> addition, for the unused land inquiries will be<br />
made on why the land is not used or abandoned.<br />
Data input<br />
It is difficult to assess the land use by local communities with a desk-based analysis.<br />
However, as a proxy an analysis was made based on the following input:<br />
• Land cover <strong>West</strong> <strong>Kalimantan</strong>, 2006 (WWF, 2009). This dataset was used to assess<br />
how much land is used for agriculture and settlements.<br />
• Plantation concession (plantation service, 2007). This data is used to assess whether<br />
the concession is active.<br />
Findings<br />
Based on the analysis, no land preparation for plantations seems to taken place yet in the<br />
preselected areas. Based on remote sensing data the current land use by communities seems<br />
relatively high, in some concessions some above 90% (see Appendix 3), indicating a potential<br />
risk <strong>of</strong> displacing small scale local agriculture.<br />
Required field data<br />
<strong>In</strong> case communities use a large portion <strong>of</strong> the land, the potential displacement effects (and<br />
the risk for conflicts) will be significant. It is however unlikely that the amount <strong>of</strong> land<br />
indicated for agriculture by remote sensing is actually used in practice. The wide variety <strong>of</strong><br />
reflection patterns, associated with the shifting cultivation methods <strong>of</strong> the communities,<br />
strongly limit the reliability <strong>of</strong> an assessment based on remote sensing data. For example; the<br />
reflection pattern <strong>of</strong> “jungle rubber” in the field, is very similar to “re-growth”.<br />
Considering the limitations <strong>of</strong> remote sensing, land use data has to be compared with the<br />
conditions in the field. Thus to assess the potential displacement, a more detailed analysis <strong>of</strong><br />
the actual amount <strong>of</strong> land used in the concessions is needed.<br />
35
P5: The identified areas is agriculturally suitable for the target<br />
energy crop<br />
To assess whether the concessions are agriculturally suitable for energy crop development in<br />
line with principle 5, a reference is made to crop specific studies. <strong>In</strong> line with this<br />
recommendation, an inventory <strong>of</strong> relevant studies is made.<br />
<strong>In</strong> addition to the analysis on biophysical suitability, the access and proximity to<br />
infrastructure was assessed, since this will strongly influence the economic viability <strong>of</strong><br />
developing a plantation in a specific area. To be able to support oil palm plantation<br />
development access by road or river, and settlements (people, accommodation to support the<br />
employers, electricity, etc) are crucial.<br />
Data <strong>In</strong>put<br />
To assess the biophysical suitability for oil palm cultivation in the concessions, and the<br />
proximity to infrastructure, the following data sources were used:<br />
• Biophysical suitability for oil palm in <strong>Kalimantan</strong> (Mantel 2007). The biophysical<br />
suitability was assessed based on climate, topographic- (elevation, slope) and soil<br />
properties (soil type, soil depth, drainage).<br />
• Ministry <strong>of</strong> Public Works (2007/2008). To assess the access <strong>of</strong> the concessions the<br />
distance from rivers, infrastructure and existing plantations was analyzed.<br />
Findings<br />
Based on the biophysical suitability analysis, all concessions were found to have sufficient<br />
portion (minimum 5000 ha) <strong>of</strong> the land classified as suitable (see appendix 5 table 5.1). <strong>In</strong> the<br />
assessment on access, two concessions were found to be to remote from rivers infrastructure<br />
or existing plantations. Concession 23 is remote from main road, and does not have sufficient<br />
access to other infrastructure (see Appendix 5 table 5.2). The development <strong>of</strong> a plantation in<br />
this area is therefore not likely to be economically feasible. These concessions are therefore<br />
not considered as RCA areas. The other concessions have sufficient access to infrastructure.<br />
Required field work<br />
Since the resolution <strong>of</strong> data produced by Mantel et al. (2007) (1:250000) is unsuitable for a<br />
reliable biophysical suitability analysis on a site level, an on-site assessment <strong>of</strong> the<br />
biophysical suitability is recommended. Specifically an analysis on the soil type and soil<br />
depth should be included in the field activities as well as a visual inspection <strong>of</strong> the slopes <strong>of</strong><br />
the terrain.<br />
On access to infrastructure, no further field assessment is required, since the data used is<br />
considered to have been sufficiently verified by the Ministry <strong>of</strong> Public Works (2007/2008).<br />
36
Recommendation Phase II: Identified priority areas<br />
The analysis for phase II started with 30 preselected areas identified in phase I. Based on the<br />
additional analysis <strong>of</strong> Phase II, a number areas have been removed as potential RCA since<br />
conflicts with the RCA principles were identified. <strong>In</strong> addition, for a number <strong>of</strong> areas a risk for<br />
conflict with RCA principles was identified. The latter areas may still be suitable as RCA.<br />
However, these would need special attention to one or more <strong>of</strong> the RCA principles due to<br />
potential issues in these areas The results <strong>of</strong> the analysis in phase II are summarized in table<br />
6.1 below.<br />
RCA Presence <strong>of</strong> HCV’s Presence <strong>of</strong><br />
Preselected area<br />
nr.s unsuitable as<br />
RCA<br />
Preselected area<br />
nr.s that need<br />
special attention<br />
due to risks<br />
identified<br />
No conflicts with<br />
the RCA criteria<br />
were found<br />
25 (HCV 2.1, 2.3)<br />
HCV 1.1: 3, 14, 22,<br />
24, and 26 (also 17,<br />
19, 21, but already<br />
excluded based on P<br />
3)<br />
HCV, 1.2: 24, 28<br />
HCV 3: 8, 18, 22<br />
(also 17 but already<br />
excluded<br />
high carbon<br />
stocks<br />
Table 6.1: Overview identified conflicts/risk for conflict with RCA principles<br />
For concessions 1, 2, 4, 6, 7, 8, 9, 10, 12, 13, 20, 27, 28, 29, 30, no conflicts with the RCA<br />
criteria were found. These areas are recommended for a first focus in initiatives identifying<br />
potential expansion areas for oil palm in <strong>West</strong> <strong>Kalimantan</strong>.<br />
The phase III assessment will focus in detail on concessions 20, 29, 30. These concession<br />
ware selected for further analysis since its location is proximate to the heart <strong>of</strong> Borneo, and<br />
thus can potentially provide an option to divert planned operations in or close to heart <strong>of</strong><br />
Borneo to (see also figure 6.1).<br />
37<br />
Land right<br />
issues<br />
5, 11, 15,<br />
16, 17, 18,<br />
19, 21<br />
(status<br />
active)<br />
1, 2, 4, 6, 7, 8, 9, 10, 12, 13, 20, 27, 28, 29, 30<br />
Displacement<br />
risk<br />
Agricultural<br />
suitability<br />
23, remote<br />
from main<br />
road, but has<br />
access to<br />
river)
Figure 6.1: Location concession 30 identified for further analysis in phase II<br />
The next chapter will describe the results <strong>of</strong> the fieldwork that was performed in concession<br />
30. The designed field activities are based on information requirements identified desk-based<br />
assessment in phase II, and aims to fill the identified information gaps (aspects on which no<br />
desk-based information was available), as well as improve data quality (data that requires<br />
verification on the ground).<br />
38
References<br />
Akcakaya, Linking GIS with Models <strong>of</strong><br />
Ecological Risk Assessment for<br />
Endangered Species. Paper in the Third<br />
<strong>In</strong>ternational Conference on <strong>In</strong>tegrating<br />
GIS and Environmental Modeling New<br />
York.<br />
Gibbs, H.K.; Brown, S.; Niles, J.O.; Foley,<br />
J.A. 2007. Monitoring and estimating<br />
tropical forest carbon stocks: making<br />
REDD a reality. Environmental Research<br />
Letters.<br />
HCV Consortium, 2008. Toolkit for<br />
<strong>Identification</strong> <strong>of</strong> High Conservation<br />
Values in <strong>In</strong>donesia. Jakarta<br />
Jennings., S., Judd, N., Nussbaum, R.,<br />
Evans., J. 2003. The High Conservation<br />
Value Forest Toolkit, ProForest. UK.<br />
Mantel, S., Wösten, H. and Verhagen, J.,<br />
2007. Biophysical land suitability for oil<br />
palm in <strong>Kalimantan</strong>, <strong>In</strong>donesia. Report<br />
2007/01. Wageningen, the Netherlands:<br />
ISRIC - World Soil <strong>In</strong>formation, Altera,<br />
Plant Research <strong>In</strong>ternational,<br />
Wageningen UR.<br />
Muliastra, K.D. 2009. Assessment Spatial<br />
requirements <strong>of</strong> the BioSt-NachV; Spatial<br />
Data Assessment for <strong>In</strong>donesia. Bali,<br />
<strong>In</strong>donesia<br />
Palm CA, Wooner PL, Alegre J, Arevalo<br />
C. 1999.Strategic information on changes<br />
in carbon stocks and land-use,<br />
www.asb.cgiar.org/data/dataset<br />
Rautner, M., Hardiono, M., Alfred, J. 2005<br />
Borneo: Treasure Island at Risk. WWF<br />
Germany<br />
Regional Physical Planning Programme<br />
for Transmigration (RePPProT). 1989.<br />
39<br />
The Land Resources <strong>of</strong> <strong>In</strong>donesia: A<br />
National Overview. Regional Physical<br />
Planning Programme for Transmigration.<br />
Jakarta, <strong>In</strong>donesia.<br />
Singleton, I., S. Wich, S. Husson, S.<br />
Stephens, S. Utami Atmoko, M. Leighton,<br />
N. Rosen, K. Traylor-Holzer, R. Lacy and<br />
O. Byers (eds.). 2004. Orangutan<br />
Population and Habitat Viability<br />
Assessment: Final Report.<br />
Vlek, P. L. G. 2005. The potential <strong>of</strong> oil<br />
palm and forest plantations for carbon<br />
sequestration on degraded land in<br />
<strong>In</strong>donesia. Ecology and Development<br />
Series No. 28. Center for Development<br />
Research - University <strong>of</strong> Bonn,<br />
Goettingen, Germany<br />
WWF <strong>In</strong>donesia 2009. Land cover<br />
assessment RCA <strong>West</strong> <strong>Kalimantan</strong>.<br />
Unpublished<br />
Websites<br />
The Annotated Ramsar List <strong>of</strong> Wetlands<br />
<strong>of</strong> <strong>In</strong>ternational Importance: <strong>In</strong>donesia<br />
http://ramsar.org/pr<strong>of</strong>iles_indonesia.htm<br />
accessed oktober, 2009<br />
UNEP-WCMC. Oktober 2009: UNEP-<br />
WCMC Species<br />
Database: CITES-Listed Species<br />
http://sea.unep-wcmc.org/isdb/<br />
CITES/Taxonomy/taxspecies-<br />
result.cfm?displaylanguage=<br />
eng&Genus=Dicerorhinus&Species=suma<br />
trensis&source=ani<br />
mals&Country=&tabname=all<br />
Wetlands <strong>In</strong>ternational – <strong>In</strong>donesia<br />
Program: Danau Sentarum<br />
http://www.wetlands.or.id/kal04.htm<br />
accessed oktober, 2009
Appendix 1<br />
Table 1.1 Protected and Conservation <strong>Areas</strong> that are close or overlap with the 30<br />
concessions<br />
No Name Hectares Forest<br />
40<br />
(ha)<br />
1 PT. <strong>In</strong>ma Makmur Lestari 21,470 1,474<br />
2 PT. Global <strong>Kalimantan</strong> Makmur 27,367 1,389<br />
Protected<br />
Forest<br />
3 PT. Malindo Persada Khatulistiwa 21,055 129 Adjacent<br />
4 PT. Selaras Mukti Lestari 20,029 2,514<br />
5 PT. <strong>Kalimantan</strong> Bina Permai 36,928<br />
6 PT. Grand Utama Mandiri 17,387<br />
7 PT. Pratama Prosentindo 20,086 132<br />
8 PT. <strong>In</strong>doresins Putra Mandiri 18,044 784<br />
9 PT. Putra <strong>In</strong>dotropical 19,908 602<br />
10 PTP. XIII 20,972<br />
11 PT. Mitra Austral Sejahtera 26,567 65<br />
12 PT. Prana Reksa Karya 21,819 411<br />
13 PT. Maiska Bhumi Semesta 20,612<br />
Conservation<br />
Area<br />
14 PT. Mestika Karunia Abadi 19,595 385 Adjacent<br />
15 PT. Sime <strong>In</strong>doagro 22,040<br />
16 PT. Bumi Pratama Khatulistiwa 49,480 146<br />
IUCN<br />
17 PT. Multi Prima Entakai 29,519 416 Cat IV, 9 ha<br />
18 PTP. XIII 28,682 154<br />
19 PT. Multi Jaya Perkasa 43,334 149 Cat IV, 1717 ha<br />
20 PT. Bintara Tani Nusantara 19,363 2,646<br />
21 PT. Bintang Harapan Desa 16,786 Cat IV, 15 ha<br />
22 PT. Sumatra Makmur Lestari 43,944 22 Adjacent Cat IV, 5067 ha<br />
23 PT. Tanjung Berkah Mulia 19,317 421<br />
24 PT. Arvena Sepakat 21,989 83 Adjacent<br />
25 PT. Mustika Agung Sentosa 19,667 3,097<br />
26 PT. SMART (Sinar Mas Group) 37,209 1,326 Adjacent<br />
27 PT. Borneo Khatulistiwa Sawit 17,611 547<br />
28 PT. Bangun Nusa Mandiri 25,903 1,987<br />
29 No-<strong>In</strong>fo yet 19,734<br />
30 No-<strong>In</strong>fo yet 21,078
Table 1.2: Important habitats that are close or overlap with the 30 concessions<br />
No Name Hectares Forest (ha) Orang Utan Habitat Bird Life (EBA)<br />
24 PT. Arvena Sepakat 21,989 83 Adjacent<br />
25 PT. Mustika Agung Sentosa 19,667 3,097 75 ha<br />
28 PT. Bangun Nusa Mandiri 25,903 1,987 5243 ha<br />
Table 1.4.1.1 Watershed status inside the 30 concessions<br />
No Name Hectares Watershed Condition<br />
1 PT. <strong>In</strong>ma Makmur Lestari 21,470 Critical<br />
2 PT. Global <strong>Kalimantan</strong> Makmur 27,367 Critical<br />
3 PT. Malindo Persada Khatulisti 21,055 Not Critical<br />
4 PT. Selaras Mukti Lestari 20,029 Not Critical<br />
5 PT. <strong>Kalimantan</strong> Bina Permai 36,928 Critical<br />
6 PT. Grand Utama Mandiri 17,387 Critical<br />
7 PT. Pratama Prosentindo 20,086 Not Critical<br />
8 PT. <strong>In</strong>doresins Putra Mandiri 18,044 Not Critical<br />
9 PT. Putra <strong>In</strong>dotropical 19,908 Not Critical<br />
10 PTP. XIII 20,972 Critical<br />
11 PT. Mitra Austral Sejahtera 26,567 Critical<br />
12 PT. Prana Reksa Karya 21,819 Critical<br />
13 PT. Maiska Bhumi Semesta 20,612 Not Critical<br />
14 PT. Mestika Karunia Abadi 19,595 Not Critical<br />
15 PT. Sime <strong>In</strong>doagro 22,040 Critical<br />
16 PT. Bumi Pratama Khatulistiwa 49,480 Critical<br />
17 PT. Multi Prima Entakai 29,519 Critical<br />
18 PTP. XIII 28,682 Critical<br />
19 PT. Multi Jaya Perkasa 43,334 Critical<br />
20 PT. Bintara Tani Nusantara 19,363 Critical<br />
21 PT. Bintang Harapan Desa 16,786 Critical<br />
22 PT. Sumatra Makmur Lestari 43,944 Critical<br />
23 PT. Tanjung Berkah Mulia 19,317 Critical<br />
24 PT. Arvena Sepakat 21,989 Critical<br />
25 PT. Mustika Agung Sentosa 19,667 Critical<br />
26 PT. SMART (Sinar Mas Group) 37,209 Not Critical<br />
27 PT. Borneo Khatulistiwa Sawit 17,611 Not Critical<br />
28 PT. Bangun Nusa Mandiri 25,903 Not Critical<br />
29 No-<strong>In</strong>fo yet 19,734 Critical<br />
30 No-<strong>In</strong>fo yet 21,078 Critical<br />
41
Figure 1.4.1.2: Zones with critical watersheds (Kapuas and Sambas), the watersheds in a<br />
zone classified as critical are considered Super Priority to be be managed by Government<br />
42
Table 1.4.2: Estimated erosion levels inside the 30 concessions.<br />
No . Name Area<br />
(ha)<br />
1 2<br />
Erosion risk<br />
3 4 5<br />
1 PT. <strong>In</strong>ma Makmur Lestari 21,478 44% 9% 0% 0% 0%<br />
2 PT. Global <strong>Kalimantan</strong> Makmur 27,389 75% 20% 4% 0% 0%<br />
3 PT. Malindo Persada Khatulisti 21,077 13% 71% 14% 1% 0%<br />
4 PT. Selaras Mukti Lestari 20,036 50% 40% 10% 0% 0%<br />
5 PT. <strong>Kalimantan</strong> Bina Permai 36,937 94% 5% 0% 0% 0%<br />
6 PT. Grand Utama Mandiri 17,394 84% 16% 0% 0% 0%<br />
7 PT. Pratama Prosentindo 20,091 45% 35% 14% 6% 1%<br />
8 PT. <strong>In</strong>doresins Putra Mandiri 18,061 39% 48% 9% 3% 0%<br />
9 PT. Putra <strong>In</strong>dotropical 19,927 44% 39% 14% 3% 0%<br />
10 PTP. XIII 20,978 86% 14% 0% 0% 0%<br />
11 PT. Mitra Austral Sejahtera 26,582 83% 16% 1% 0% 0%<br />
12 PT. Prana Reksa Karya 21,840 28% 44% 18% 9% 1%<br />
13 PT. Maiska Bhumi Semesta 20,627 27% 67% 4% 0% 0%<br />
14 PT. Mestika Karunia Abadi 19,611 40% 51% 6% 2% 0%<br />
15 PT. Sime <strong>In</strong>doagro 22,048 84% 13% 3% 0% 0%<br />
16 PT. Bumi Pratama Khatulistiwa 49,496 83% 15% 2% 0% 0%<br />
17 PT. Multi Prima Entakai 29,522 83% 15% 2% 0% 0%<br />
18 PTP. XIII 28,683 94% 5% 0% 0% 0%<br />
19 PT. Multi Jaya Perkasa 43,353 73% 18% 6% 3% 0%<br />
20 PT. Bintara Tani Nusantara 19,390 68% 30% 1% 0% 0%<br />
21 PT. Bintang Harapan Desa 16,807 51% 47% 1% 0% 0%<br />
22 PT. Sumatra Makmur Lestari 44,003 22% 53% 16% 8% 1%<br />
23 PT. Tanjung Berkah Mulia 19,368 33% 41% 23% 3% 0%<br />
24 PT. Arvena Sepakat 22,013 26% 40% 22% 10% 2%<br />
25 PT. Mustika Agung Sentosa 19,694 46% 49% 5% 0% 0%<br />
26 PT. SMART (Sinar Mas Group) 37,248 48% 33% 11% 7% 1%<br />
27 PT. Borneo Khatulistiwa Sawit 17,623 82% 17% 1% 0% 0%<br />
28 PT. Bangun Nusa Mandiri 25,915 77% 17% 5% 1% 0%<br />
29 No-<strong>In</strong>fo yet 19,744 97% 3% 0% 0% 0%<br />
30 No-<strong>In</strong>fo yet 21,082 74% 22% 3% 1% 0%<br />
43
Table 1.4.3: Occurred fires in the 30 concessions in <strong>West</strong> <strong>Kalimantan</strong> between 2000 –<br />
2007<br />
No. Name 2000 2002 2003 2004 2005 2006 2007<br />
<strong>West</strong> <strong>Kalimantan</strong> 648 2,331 4,112 8,002 3,434 12,948 2,271<br />
<strong>In</strong>side 30 MUs 14 51 225 351 204 370 72<br />
% from Province 2% 2% 5% 4% 6% 3% 3%<br />
1 PT. <strong>In</strong>ma Makmur Lestari 1 10 18 16 27 5<br />
2 PT. Global <strong>Kalimantan</strong> Makmur 4 18 12 21 38 5<br />
3 PT. Malindo Persada Khatulisti 5 11 12 5 5<br />
4 PT. Selaras Mukti Lestari 16 14 14 7<br />
5 PT. <strong>Kalimantan</strong> Bina Permai 1 13 8 3 7 4<br />
6 PT. Grand Utama Mandiri 3 3 1 4<br />
7 PT. Pratama Prosentindo 5 5 2 1<br />
8 PT. <strong>In</strong>doresins Putra Mandiri 3 6 4 5<br />
9 PT. Putra <strong>In</strong>dotropical 5 3 2 1 4<br />
10 PTP. XIII 8<br />
11 PT. Mitra Austral Sejahtera 1 11 7 5 7 8<br />
12 PT. Prana Reksa Karya 5 1 6 3<br />
13 PT. Maiska Bhumi Semesta 14 16 15 21 2<br />
14 PT. Mestika Karunia Abadi 1 14 12 11 2 8<br />
15 PT. Sime <strong>In</strong>doagro 4 5 7 4 1<br />
16 PT. Bumi Pratama Khatulistiwa 1 15 9 15 23 3<br />
17 PT. Multi Prima Entakai 1 1 18 11 13 7 1<br />
18 PTP. XIII 7 20 6 3<br />
19 PT. Multi Jaya Perkasa 8 12 8 9 1<br />
20 PT. Bintara Tani Nusantara 2 6 3 5 10 6 3<br />
21 PT. Bintang Harapan Desa 1 3 2<br />
22 PT. Sumatra Makmur Lestari 2 6 11 3 4 1<br />
23 PT. Tanjung Berkah Mulia 3 12 19 9 20 2<br />
24 PT. Arvena Sepakat 1 2 15 1 4 1<br />
25 PT. Mustika Agung Sentosa 4 12 6 19 1<br />
26 PT. SMART (Sinar Mas Group) 5 7 17 47 7<br />
27 PT. Borneo Khatulistiwa Sawit 1 5 6 31 1 39 3<br />
28 PT. Bangun Nusa Mandiri 14 1 28<br />
29 No-<strong>In</strong>fo yet 3<br />
30 No-<strong>In</strong>fo yet 6 22 16 51 7 23<br />
44
Appendix 3<br />
Table 3.1: Formal ownership concessions and land use by communities<br />
No Owner Status Action Ha Agriculture Settlement<br />
1 Pinehill Ventures Limited <strong>In</strong>active No Land Clearing yet 21,470 19,350 48<br />
2 <strong>In</strong>donusa <strong>In</strong>active No Land Clearing yet 27,367 25,441 152<br />
3 Global Natural Resources <strong>In</strong>active No Land Clearing yet 21,055 19,758 114<br />
4 Un-identified <strong>In</strong>active No Land Clearing yet 20,029 17,458 55<br />
5 Lyman Agro Active No Land Clearing yet 36,928 35,750 27<br />
6 Un-identified <strong>In</strong>active No Land Clearing yet 17,387 17,334 41<br />
7 Wilmar <strong>In</strong>active No Land Clearing yet 20,086 19,793 159<br />
8 Wilmar <strong>In</strong>active No Land Clearing yet 18,044 17,063 74<br />
9 Wilmar <strong>In</strong>active No Land Clearing yet 19,908 18,366 98<br />
10 State owned company <strong>In</strong>active No Land Clearing yet 20,972 15,988 141<br />
11 Sinergy Drive Active No Land Clearing yet 26,567 26,265 136<br />
12 Un-identified <strong>In</strong>active No Land Clearing yet 21,819 20,970 315<br />
13 Global Natural Resources <strong>In</strong>active No Land Clearing yet 20,612 20,183 107<br />
14 Un-identified <strong>In</strong>active No Land Clearing yet 19,595 18,297 67<br />
15 Sinergy Drive Active No Land Clearing yet 22,040 21,741 116<br />
16 Wilmar Active No Land Clearing yet 49,480 48,360 303<br />
17 MPE Group Active No Land Clearing yet 29,519 29,011 92<br />
18 State owned company Active No Land Clearing yet 28,682 27,868 135<br />
19 MJP Group Active No Land Clearing yet 43,334 42,680 330<br />
20 <strong>In</strong>casi Raya <strong>In</strong>active No Land Clearing yet 19,363 14,353 147<br />
21 BHD Group Active No Land Clearing yet 16,786 16,785<br />
22 <strong>In</strong>casi Raya - Gunas <strong>In</strong>active No Land Clearing yet 43,944 43,583 221<br />
23 Un-identified <strong>In</strong>active No Land Clearing yet 19,317 17,058 106<br />
24 <strong>In</strong>casi Raya <strong>In</strong>active No Land Clearing yet 21,989 21,840 64<br />
25 Un-identified <strong>In</strong>active No Land Clearing yet 19,667 16,535 24<br />
26 SMART Group <strong>In</strong>active No Land Clearing yet 37,209 32,561 379<br />
27 Artha <strong>In</strong>active No Land Clearing yet 17,611 12,946 87<br />
28 Un-identified <strong>In</strong>active No Land Clearing yet 25,903 15,889 147<br />
29 Un-identified <strong>In</strong>active No-<strong>In</strong>fo yet 19,734 13,977 49<br />
30 Un-identified <strong>In</strong>active No-<strong>In</strong>fo yet 21,078 8,105 60<br />
45
Appendix 5<br />
Table 5.1: The biophysical suitability in the 30 concessions according to the Low <strong>In</strong>put<br />
and High <strong>In</strong>put base on ISRIC data.<br />
Low <strong>In</strong>put High <strong>In</strong>put<br />
No Hectares No Data Not Possible Constrained Possible Optimal Not Possible Possible Optimal<br />
1 21,470 79 21,391 21,470<br />
2 27,367 132 1,197 26,039 654 26,713<br />
3 21,055 79 1,600 19,376 1,018 20,038<br />
4 20,029 26 20,003 20,029<br />
5 36,928 175 1,291 35,462 1,261 35,667<br />
6 17,387 72 17,315 17,387<br />
7 20,086 97 840 6 19,143 340 19,746<br />
8 18,044 65 2,360 43 15,577 1,845 16,199<br />
9 19,908 37 1 19,870 19,908<br />
10 20,972 72 20,900 20,972<br />
11 26,567 48 193 26,326 155 26,412<br />
12 21,819 85 6,216 176 15,345 4,448 17,371<br />
13 20,612 18 1,142 19,451 428 20,184<br />
14 19,595 91 1,902 28 17,575 1,310 18,285<br />
15 22,040 34 22,006 22,040<br />
16 49,480 157 991 48,332 653 48,827<br />
17 29,519 59 184 29,277 110 29,409<br />
18 28,682 75 28,135 473 28,176 505<br />
19 43,334 42 2,709 26 40,557 2,256 41,078<br />
20 19,363 50 19,313 19,363<br />
21 16,786 21 16,765 16,786<br />
22 43,944 61 10,348 149 33,387 8,561 35,383<br />
23 19,317 20 15 13 19,269 19 19,299<br />
24 21,989 48 7,833 22 14,089 6,045 15,944<br />
25 19,667 58 796 3 18,809 525 19,142<br />
26 37,209 56 8,214 214 28,726 6,492 30,717<br />
27 17,611 37 1,471 16,103 1,002 16,608<br />
28 25,903 50 1,838 39 23,978 1,048 24,855<br />
29 19,734 16 14 19,704 9 19,725<br />
30 21,078 31 21,047 21,078<br />
46
Table 5.2: Accessibility <strong>of</strong> the 30 concessions, based on existing infrastructure and<br />
proximity to the nearest plantation.<br />
Distance to road Distance to river Distance to nearest plantation<br />
No Ha<br />
0 - 5 5 - 20 20 - 40 > 40 0 - 5 5 - 20 20 - 40 > 40 0 - 5 km 5 - 10 km 10 - 30 km > 30 km<br />
km km km km km km km km<br />
1 21,470 7,868 13,602 21,470 1,986 19,484<br />
2 27,367 10,201 17,166 27,367 847 26,520<br />
3 21,055 11,041 10,014 10,176 10,879 8,236 3,755 9,064<br />
4 20,029 10,966 9,063 2 20,027 2,963 17,067<br />
5 36,928 8,381 23,168 5,379 3,419 7,797 22,382 3,330 6,460 15,983 14,485<br />
6 17,387 13,313 4,073 38 17,160 188 6,106 10,127 1,153<br />
7 20,086 14,144 5,942 755 19,331 5,328 13,091 1,667<br />
8 18,044 2,539 15,505 18,044 1,836 15,455 753<br />
9 19,908 92 19,816 19,908 7,605 7,045 5,258<br />
10 20,972 14,954 6,017 1,976 18,996 9,821 1,410 9,741<br />
11 26,567 9,068 17,499 22,497 4,070 3,499 23,068<br />
12 21,819 11,323 10,497 12,683 9,137 824 20,995<br />
13 20,612 6,740 13,872 6,045 14,567 2,161 18,451<br />
14 19,595 13,276 6,319 19,246 349 19,595<br />
15 22,040 8,533 13,507 4,403 17,637 22,040<br />
16 49,480 20,750 28,730 5,240 21,880 22,360 16,205 21,287 11,988<br />
17 29,519 10,335 19,184 3,251 25,945 324 11,396 6,137 11,986<br />
18 28,682 11,874 16,808 14,981 13,701 14,824 2,665 11,193<br />
19 43,334 22,622 20,712 10,121 30,103 3,111 11,240 30,862 1,233<br />
20 19,363 16,390 2,973 1,210 18,153 14,997 4,366<br />
21 16,786 12,620 4,165 6,819 9,967 11,457 38 5,291<br />
22 43,944 29,210 14,734 11,173 32,771 11,038 21,477 11,429<br />
23 19,317 19,317 17,446 1,872 305 19,013<br />
24 21,989 21,989 8,152 13,838 9,678 5,966 6,346<br />
25 19,667 11,878 7,788 8,513 11,154 19,667<br />
26 37,209 24,511 12,698 2,590 34,619 8,482 26,119 2,608<br />
27 17,611 12,152 5,458 1,652 15,959 8,949 2,515 6,147<br />
28 25,903 13,100 12,803 1,567 24,325 12 10,982 1,148 13,773<br />
29 19,734 1,981 17,753 10,130 9,604 3,941 15,543 250<br />
30 21,078 5,120 15,959 5,043 16,035 8,308 8,769 4,002<br />
47