Intrinsic noise in gene regulatory networks
Intrinsic noise in gene regulatory networks
Intrinsic noise in gene regulatory networks

You also want an ePaper? Increase the reach of your titles
YUMPU automatically turns print PDFs into web optimized ePapers that Google loves.
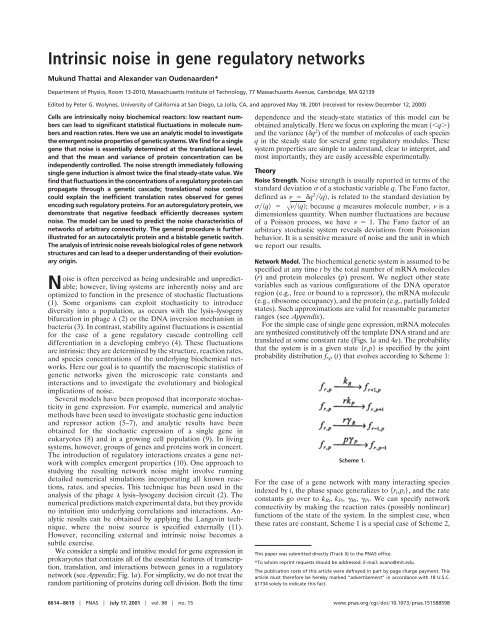
Fig. 2. Transient <strong>noise</strong> for a s<strong>in</strong>gle <strong>gene</strong>. The prote<strong>in</strong> half-life is fixed at 1 h,b 20, and k R 0.01 s 1 . Exact analytic results are plotted for an mRNAhalf-life of 120, 24, and 0 s, correspond<strong>in</strong>g to 130, 1150, and 0,respectively. p 2 p is plotted versus time <strong>in</strong> seconds. The 0 casecorresponds to Eq. 2; the steady-state value from Eq. 1 is shown as a dashedl<strong>in</strong>e. The transient <strong>noise</strong> reaches almost twice the steady-state strength, as tends to zero.curve (Fig. 3a). In that region, the function is well approximatedby its l<strong>in</strong>earization about the mean value of p: k R k 0 k 1 p. Thenetwork matrices for the auto<strong>regulatory</strong> system are:A D r pD 0 0 0r k 0 0 k 1p 0 k P 0D r pD 0 0 0r 0 R 0p0 0 PThese produce the follow<strong>in</strong>g prote<strong>in</strong> number statistics:p 11 b k 0b Pp 2p 1 1 bb1 1, [3]where b and are as def<strong>in</strong>ed previously, and k 1 P describesthe strength of the negative feedback. Eq. 3 shows that autoregulationhas an effect not only <strong>in</strong> controll<strong>in</strong>g the prote<strong>in</strong>concentration but also <strong>in</strong> reduc<strong>in</strong>g the relative size of fluctuations.Fig. 3b compares the predictions of this model to theresults of Monte Carlo simulations of the fully nonl<strong>in</strong>ear system;the match is excellent.Extension to Complex Networks. Bistability is an important featureof several <strong>gene</strong> <strong>regulatory</strong> structures (2). An autocatalyticsystem, <strong>in</strong> which a prote<strong>in</strong> enhances its own production (Fig. 4c),typically has two stable states: one at low prote<strong>in</strong> concentrations,where prote<strong>in</strong> creation is near its basal level, and another at highprote<strong>in</strong> concentrations. This is the ‘‘all-or-none’’ phenomenonseen for autocatalytic systems such as the ara (15) and lac (16)operons. A bistable switch can also be constructed from twomutually repress<strong>in</strong>g prote<strong>in</strong>s (ref. 17; Fig. 4d). Fig. 4 shows howthe <strong>noise</strong> analysis would proceed for the systems discussed here,as well as for a feed-forward cascade of three <strong>gene</strong>s (Fig. 4e).These examples <strong>in</strong>dicate how the theory can be applied toarbitrary <strong>regulatory</strong> <strong>networks</strong>. In the <strong>gene</strong>ral case, nonl<strong>in</strong>ear<strong>in</strong>teractions between various species typically lead to multiplestable fixed po<strong>in</strong>ts; each such fixed po<strong>in</strong>t <strong>in</strong>duces a dist<strong>in</strong>ctl<strong>in</strong>earized system, and the l<strong>in</strong>earized systems can be solved byus<strong>in</strong>g analytic theory.Fig. 3. Noise control by autoregulation. (a) The histogram (scale on left axis)to the right shows the unrepressed distribution, the one to the left thedistribution when repression is turned on. The rate of prote<strong>in</strong> production atany given prote<strong>in</strong> number p is given by a Hill repression function (dashed l<strong>in</strong>e,scale on right axis): k R k max R 1(1 [pK d ]”). Here, K d is the dissociationconstant that specifies the threshold prote<strong>in</strong> concentration at which thetranscription rate is at half its maximum value. n is the Hill coefficient anddeterm<strong>in</strong>es the steepness of the repression curve. For example, the cI repressorprote<strong>in</strong> acts on the promoters P R and P RM of phage with a K d of about 50 and1,000 nM, respectively (26). Typical biological values for n range from 1(hyperbolic control) to over 30 (sharp switch<strong>in</strong>g). Note that the repressioncurve is very nearly l<strong>in</strong>ear <strong>in</strong> the region where it <strong>in</strong>tersects the repressedhistogram. (b) Noise control by autoregulation: compar<strong>in</strong>g analytic results(solid l<strong>in</strong>es, Eq. 3) with Monte Carlo simulations, as K d is varied (triangles), andn is varied (circles). As <strong>in</strong> Fig. 1c, the Fano factor (variancemean) is plottedversus the mean. The prote<strong>in</strong> half-life is fixed at 1 h, mRNA half-life at 2 m<strong>in</strong>,and the burst size at 10; the unrepressed mean value is p unrep 1,200. Notethat n 0 corresponds to a fixed transcription <strong>in</strong>itiation rate that is half thebase value, therefore giv<strong>in</strong>g a mean prote<strong>in</strong> number of 600. K d is varied(triangles) from 100 to 2,000 <strong>in</strong> <strong>in</strong>crements of 100, and then from 2,000 to5,000 <strong>in</strong> <strong>in</strong>crements of 1,000, with n set to 2. (K d is given <strong>in</strong> molecule number;one molecule per cell corresponds to a concentration of 1 nanomolar.) Theunrepressed (K d is <strong>in</strong>f<strong>in</strong>ite) limit is also shown. n is varied (circles) from 0 to 20,with K d set at 800. The Monte Carlo simulations (symbols) are very wellreproduced by the analytical values (solid l<strong>in</strong>es) given by Eq. 3.Range of Validity of the Analytic Model. First, cell division and therandom partition<strong>in</strong>g of prote<strong>in</strong>s between daughter cells are asource of stochastic fluctuations that will modify the resultspresented above. For example, Berg (9) has analyzed the expressionof a s<strong>in</strong>gle <strong>gene</strong> <strong>in</strong> a divid<strong>in</strong>g cell population (<strong>in</strong> theabsence of prote<strong>in</strong> degradation). He calculates the Fano factoras a function of cell age t <strong>in</strong> a population with cell division time T:2t 2T3 b 1. [4]t TThis implies (43)b 1 just before and (23)b 1 justafter cell division, compared with b1 predicted by oursimplified model.Second, <strong>in</strong> this paper, we have described a l<strong>in</strong>earized stochasticmodel. However, biochemical systems are <strong>in</strong>variably nonl<strong>in</strong>ear.Indeed, it is nonl<strong>in</strong>earity that creates much of the rich variety ofbehavior exhibited by biological <strong>networks</strong>. When the result<strong>in</strong>gsystem displays limit cycles or oscillations (e.g., ref. 18), it will notyield to naive l<strong>in</strong>earization. L<strong>in</strong>earization is also <strong>in</strong>valid around8616 www.pnas.orgcgidoi10.1073pnas.151588598 Thattai and van Oudenaarden
Fig. 4. Analysis of various <strong>gene</strong> <strong>regulatory</strong> <strong>networks</strong>. (a) S<strong>in</strong>gle <strong>gene</strong>. (b)Auto<strong>regulatory</strong> prote<strong>in</strong>. Parameters are the same as <strong>in</strong> a but with repressionturned on. (c) Autocatalytic prote<strong>in</strong>. Both steady states are shown. (d) Bistableswitch with two mutually repress<strong>in</strong>g prote<strong>in</strong>s. This system occasionally makesa transition from one steady state to the other, lead<strong>in</strong>g to a shallow valleybetween the two peaks not predicted by the analytic model. (e) Feed-forwardcascade of three <strong>gene</strong>s. A histogram is shown for each prote<strong>in</strong>. In each case,the network is represented schematically and the network matrix A is shown(with entries or show<strong>in</strong>g the sign of each quantity). The matrix is omittedbecause it is always diagonal. The results from a typical Monte Carlo simulationof the network are shown. The numerical histograms for prote<strong>in</strong> numberare overlaid with Gaussians (solid l<strong>in</strong>es), with the mean and variance predictedby the analytic model.or near unstable or quasistable (also known as critical) fixedpo<strong>in</strong>ts. For example, the threshold or saddle po<strong>in</strong>t of a bistablesystem (Fig. 4d) is not well approximated by our approach.However, nonl<strong>in</strong>ear <strong>networks</strong> often display multiple stable fixedpo<strong>in</strong>ts; about these po<strong>in</strong>ts, l<strong>in</strong>earization is a valid approximation,as with the examples treated above. The range of validity willvary from case to case, with the approximation becom<strong>in</strong>g exact<strong>in</strong> the limit of small fluctuations.Third, the biochemical reactions we have described are allbirth and death processes with first-order rates. Other types ofreactions, such as modifications or second- and higher-order<strong>in</strong>teractions between biochemical species, will <strong>in</strong>troduce stochasticityof a different character. For example, fluctuations <strong>in</strong>DNA–repressor <strong>in</strong>teractions (7) can contribute significantly tosystem <strong>noise</strong>. When such <strong>in</strong>teractions are much faster than thereactions we have considered, they can be treated determ<strong>in</strong>isticallyand then l<strong>in</strong>earized with<strong>in</strong> our analytic framework.F<strong>in</strong>ally, we have presented ma<strong>in</strong>ly steady-state results, whereasmany biologically <strong>in</strong>terest<strong>in</strong>g systems are driven or out of equilibrium.We have shown above that for a s<strong>in</strong>gle <strong>gene</strong>, <strong>noise</strong> outof equilibrium can be significantly higher than that at steadystate. Nevertheless, the burst size b enters both Eqs. 1 and 2<strong>in</strong> an essential way. In a similar manner, steady-state resultsfor other systems might shed light on their out-of-equilibrium<strong>noise</strong> properties and will be a useful <strong>in</strong>dicator of their <strong>noise</strong>characteristics.DiscussionNoise control can play a major role <strong>in</strong> determ<strong>in</strong><strong>in</strong>g the structureof <strong>gene</strong> <strong>regulatory</strong> <strong>networks</strong>. For example, Eq. 1 shows that thetwo-step process of transcription followed by translation hasgiven biochemical circuits the freedom to <strong>in</strong>dependently adjustthe average concentration of a prote<strong>in</strong> and the spread of thatconcentration <strong>in</strong> a population (Fig. 1c). Thus a <strong>gene</strong> can producea given prote<strong>in</strong> concentration <strong>in</strong> two very different ways. At lowtranscription but high translation rates, few mRNA moleculesare synthesized <strong>in</strong> a cell <strong>gene</strong>ration, but each one produces alarge variable burst of prote<strong>in</strong>s. This causes significant fluctuationsover time and <strong>in</strong> a population. The same concentration canbe achieved with high transcription and low translation rates andtherefore a smaller burst size. In this case, many mRNA moleculesdecay without ever be<strong>in</strong>g translated; this procedure is<strong>in</strong>efficient because high energy phosphate groups are hydrolyzedto drive the synthesis of unused or little-used transcripts. However,<strong>in</strong>efficient translation results <strong>in</strong> a steady stream of prote<strong>in</strong>swith much smaller fluctuations. Dur<strong>in</strong>g evolutionary adaptation,liv<strong>in</strong>g systems have made tradeoffs between energy efficiencyand <strong>noise</strong> reduction <strong>in</strong> choos<strong>in</strong>g between these two alternatives.For a <strong>regulatory</strong> prote<strong>in</strong> that controls the synthesis of severaldownstream products, fluctuations <strong>in</strong> regulator concentrationwill propagate through the cascade (Figs. 4e and 5). Translational<strong>noise</strong> control is a means by which <strong>gene</strong>tic circuits canreduce <strong>noise</strong> <strong>in</strong> such cascades. Regulatory <strong>gene</strong>s such as the cI<strong>gene</strong> of phage (2) and the malT <strong>gene</strong> of Escherichia coli (19)are often poorly translated. It has been po<strong>in</strong>ted out by otherresearchers (e.g., ref. 19) that this translational <strong>in</strong>efficiencymight be susta<strong>in</strong>ed <strong>in</strong> the genome through the result<strong>in</strong>g beneficialreduction <strong>in</strong> <strong>noise</strong>. However, we note that <strong>in</strong> some situations,the <strong>in</strong>tr<strong>in</strong>sic <strong>noise</strong> of a regulator can actually <strong>in</strong>crease thesensitivity with which its signal is transmitted (20, 21).The primary function of autoregulation lies <strong>in</strong> the control ofbiochemical concentrations <strong>in</strong> metabolic and <strong>gene</strong>tic pathways.However, we f<strong>in</strong>d that it is also a very economical method of<strong>noise</strong> reduction. Translational <strong>noise</strong> control is wasteful <strong>in</strong> thatonly a small fraction of mRNA molecules are successfullytranslated <strong>in</strong>to prote<strong>in</strong>s. In contrast, <strong>in</strong> an auto<strong>regulatory</strong> system,mRNA molecules are synthesized only when required and arethen efficiently translated. Eq. 3 shows that even l<strong>in</strong>ear autoregulationcan dramatically reduce fluctuations <strong>in</strong> prote<strong>in</strong> number,down to a small fraction of the unregulated value. Althoughthis result is <strong>in</strong>tuitive and has been directly observed experimentally(14), it is not explicitly predicted by methods such asstability analysis (14) or Langev<strong>in</strong> analysis; a systematic treatmentof <strong>in</strong>tr<strong>in</strong>sic <strong>noise</strong> is essential for understand<strong>in</strong>g biologicallyrelevant system properties.Although stochasticity is evident even <strong>in</strong> the expression of as<strong>in</strong>gle <strong>gene</strong>, the behavior of a system of <strong>gene</strong>s can be understoodonly by treat<strong>in</strong>g the network as a whole. The analytic model usedhere provides a quick accurate estimate of the emergent <strong>noise</strong>properties of <strong>gene</strong>tic <strong>networks</strong> preferable to that provided bylong numerical simulations. The predictions of the model can beused <strong>in</strong> the design of quantitative experiments <strong>in</strong> stochastic <strong>gene</strong>expression. The robustness of network motifs like negativefeedback can be quickly tested over a range of parameters, andthe importance of particular connections to overall network<strong>noise</strong> can be estimated (Figs. 3–5). Quantify<strong>in</strong>g the <strong>in</strong>tr<strong>in</strong>sic<strong>noise</strong> of <strong>gene</strong>tic and biochemical <strong>networks</strong> <strong>in</strong> this manner isessential for understand<strong>in</strong>g the design pr<strong>in</strong>ciples of stable androbust synthetic biochemical systems (14, 17). Conversely, liv<strong>in</strong>gsystems could possess novel <strong>regulatory</strong> structures whose major orBIOPHYSICSThattai and van Oudenaarden PNAS July 17, 2001 vol. 98 no. 15 8617
large pool of nonspecifically bound molecules (24). Transcript<strong>in</strong>itiation is therefore assumed to be a pseudofirst-orderreaction with rate k R . Interactions between species <strong>in</strong> anetwork are embodied by transact<strong>in</strong>g factors such as repressorprote<strong>in</strong>s. Such <strong>regulatory</strong> prote<strong>in</strong>s tend to act by b<strong>in</strong>d<strong>in</strong>g thepromoter region and shield<strong>in</strong>g it from RNAP, as is the case forthe lac repressor (25) or for the Cro prote<strong>in</strong> of phage (26).These reactions are considered to be <strong>in</strong> equilibrium and simplychange the fraction of RNAP bound as a closed complex,thereby chang<strong>in</strong>g the effective rate k R of transcript <strong>in</strong>itiation(25). Ribosomes can beg<strong>in</strong> b<strong>in</strong>d<strong>in</strong>g the newly synthesizedribosome-b<strong>in</strong>d<strong>in</strong>g site almost immediately as transcriptionbeg<strong>in</strong>s. Analogous to transcript <strong>in</strong>itiation, translation <strong>in</strong>itiationoff a s<strong>in</strong>gle mRNA molecule is assumed to proceed witha pseudofirst-order rate k P . For most E. coli operons, <strong>in</strong>itiationand elongation rates are such that ribosome queu<strong>in</strong>g does notoccur (13, 27). We therefore take each transcription andtranslation <strong>in</strong>itiation reaction to be <strong>in</strong>dependent. F<strong>in</strong>ally, weassume that mRNA and prote<strong>in</strong> molecules degrade with rates R and P , respectively. A decay rate gives a half-life ofln(2). If growth <strong>in</strong> cell volume is exponential, ris<strong>in</strong>g as e kt , theresult<strong>in</strong>g dilution of species concentrations can be <strong>in</strong>corporatedby replac<strong>in</strong>g i with I k for all species i (other thanthe DNA, which is replicated at a rate exactly match<strong>in</strong>g cellgrowth). The mRNA decay rate depends on the ribosomeb<strong>in</strong>d<strong>in</strong>grate, because actively translat<strong>in</strong>g ribosomes shield themRNA molecule from the action of nucleases (12, 27).Construction and Solution of the Master Equation. Scheme 2 <strong>gene</strong>ratesthe follow<strong>in</strong>g Master Equation:Fig. 5. Propagation of <strong>noise</strong> <strong>in</strong> a <strong>regulatory</strong> cascade. Analytic results areshown for a six <strong>gene</strong> cascade with <strong>gene</strong> products P 1 ,P 2 ...P 6 (similar to Fig. 4e).As described below, mean values of all prote<strong>in</strong>s are fixed so that effects purelycaused by propagated <strong>noise</strong> can be seen. P 1 is the regulator prote<strong>in</strong>, P 2 ...P 6are downstream prote<strong>in</strong>s, and i is the prote<strong>in</strong> <strong>in</strong>dex of P i . For all six <strong>gene</strong>s,ln(2) P 1h,ln(2) R 2 m<strong>in</strong>. The transcript <strong>in</strong>itiation rate of downstream<strong>gene</strong>s depends hyperbolically on the amount of prote<strong>in</strong> <strong>in</strong> the previous stepof the cascade: k Ri k max R 1 1(1 p i 1 K d ) with K 500. As <strong>in</strong> previousfigures, we focus on the Fano factor p 2 P.(a) For the regulator <strong>gene</strong>,b is varied from 0 to 20, thereby chang<strong>in</strong>g the variance of P 1 (Eq. 1); fordownstream <strong>gene</strong>s, b 20. k R1 and k max R are chosen so that P i K d for all i. (P 2 )...(P 4 ) are plotted aga<strong>in</strong>st (P 1 ). (Data for i 5, 6 are difficult to dist<strong>in</strong>guishfrom those for i 4.) The predicted value of for a burst size b 20 <strong>in</strong> theabsence of <strong>in</strong>put <strong>noise</strong> (Eq. 1) is shown as a dashed l<strong>in</strong>e. The results <strong>in</strong>dicatethat fluctuations <strong>in</strong> the concentration of a <strong>regulatory</strong> prote<strong>in</strong> are an importantsource of <strong>noise</strong> <strong>in</strong> a cascade. (b) Now b is fixed at 20 for all <strong>gene</strong>s, andparameters are aga<strong>in</strong> chosen so P i K d for all i. (P i ) is shown as a function ofprote<strong>in</strong> <strong>in</strong>dex i. For visual clarity, the results are fitted to a hyperbola. We seethat propagated <strong>noise</strong> makes a significant contribution to the <strong>noise</strong> of downstreamprote<strong>in</strong>s, although saturat<strong>in</strong>g after a few steps of the cascade.sole function is the control or use of <strong>noise</strong> (7, 20, 21); such structurescan be discovered and understood only through the <strong>in</strong>vestigation ofemergent network <strong>noise</strong> properties. As with the examples discussedhere, study<strong>in</strong>g <strong>noise</strong> <strong>in</strong> <strong>gene</strong> <strong>regulatory</strong> <strong>networks</strong>, as their structureand parameters are varied, can provide new <strong>in</strong>sights <strong>in</strong>to theirevolutionary orig<strong>in</strong> and biological function.AppendixModel<strong>in</strong>g Gene Expression <strong>in</strong> Prokaryotes: Biochemical Assumptions.Dur<strong>in</strong>g transcription <strong>in</strong>itiation, the <strong>in</strong>itial reversible b<strong>in</strong>d<strong>in</strong>g ofan RNA polymerase (RNAP) to the promoter region andsubsequent formation of an open complex achieve rapidequilibrium (22): <strong>in</strong>itiation from the f<strong>in</strong>al open complex is therate-limit<strong>in</strong>g step (23). The amount of free RNAP <strong>in</strong> a cell isbuffered aga<strong>in</strong>st cell growth and other time variations by aḟ qi E i 1 1 j A ij q j f qi E i 1 1 j ij q j f qi ,[A1]where E is the step operator (28) def<strong>in</strong>ed by E k i f(q i ,...) f(q i k, . . .). For simplicity, the jo<strong>in</strong>t probability distributionf q1 , q2 ,..., qn is written simply as f qi ,, <strong>in</strong>dex<strong>in</strong>g the variable of<strong>in</strong>terest by i rang<strong>in</strong>g from 1 to n, the number of species. Thisequation is l<strong>in</strong>ear <strong>in</strong> the state variables {q j } and can be solved byconstruct<strong>in</strong>g the moment <strong>gene</strong>rat<strong>in</strong>g function Fz j ,t q 1,...,q 1,...,n z fq . Simplify to the case where is diagonal: ij ij j .The function F then obeys the equationḞ i 1 z i i F i j A ij z j F j [A2]where F j denotes zj F. In steady state, Ḟ 0.. We now use thefollow<strong>in</strong>g properties of the moment <strong>gene</strong>rat<strong>in</strong>g function:F 1 1; F j 1 q j ; F jj 1 q j 2 q j , where 1 signifiesevaluation of F at z j 1 for all j. Successive differentiation of Eq.A2 will <strong>gene</strong>rate l<strong>in</strong>ear equations for successively higher moments.Def<strong>in</strong>e the vector J j F j and the matrix K ij F ij (wheresubscripts on F denote differentiation). Differentiat<strong>in</strong>g up tosecond moments gives:A J 0, A K L A K L T , [A3]where L ij A ij J j (no summation). These l<strong>in</strong>ear equations can besolved for means (J) and variances (K).Monte Carlo Simulations. Simulations were implemented by us<strong>in</strong>gGillespie’s algorithm for stochastic coupled chemical reactions(29). The reactions simulated were precisely those shown <strong>in</strong>Scheme 1 with multiple species, where the reaction rates wereallowed to depend nonl<strong>in</strong>early on species concentrations. Nol<strong>in</strong>earization approximation was used. Steady state was assumedto have been reached at a time equal to 10 times the prote<strong>in</strong>half-life. Each data po<strong>in</strong>t or histogram was the result of 10,000trials.8618 www.pnas.orgcgidoi10.1073pnas.151588598 Thattai and van Oudenaarden
We thank H. S. Seung for ask<strong>in</strong>g the first questions that prompted us tostudy <strong>gene</strong>tic <strong>networks</strong>, D. G. Greenhouse and T. A. Bass for usefuldiscussions, and J. Werfel and R. Metzler for critically review<strong>in</strong>g themanuscript.1. McAdams, H. H. & Ark<strong>in</strong>, A. (1999) Trends Genet. 15, 65–69.2. Ark<strong>in</strong>, A., Ross, J. & McAdams, H. H. (1998) Genetics 149, 1633–1648.3. van de Putte, P. & Goosen, N. (1992) Trends Genet. 8, 457–462.4. von Dassow, G., Meir, E., Munro, E. M. & Odell, G. M. (2000) Nature (London)406, 188–192.5. Ko, M. S. H. (1991) J. Theor. Biol. 153, 181–194.6. Cook, D. L., Gerber, A. N. & Tapscott, S. J. (1998) Proc. Natl. Acad. Sci. 95,15641–15646.7. Berg, O. G., Paulsson, J. & Ehrenberg, M. (2000) Biophys. J. 79, 2944–2953.8. Peccoud, J. & Ycart, B. (1995) Theor. Popul. Biol. 48, 222–234.9. Berg, O. G. (1978) J. Theor. Biol. 71, 587–603.10. Bhalla, U. S. & Iyengar, R. (1999) Science 283, 381–387.11. Hasty, J., Prad<strong>in</strong>es, J., Dolnik, M. & Coll<strong>in</strong>s, J. J. (2000) Proc. Natl. Acad. Sci.USA 97, 2075–2080. (First Published February 18, 2000; 10.1073pnas.040411297)12. McAdams, H. & Ark<strong>in</strong>, A. (1997) Proc. Natl. Acad. Sci. USA 94, 814–819.13. Kennell, D. & Riezman, H. (1977) J. Mol. Biol. 114, 1–21.14. Becskei, A. & Serrano, L. (2000) Nature (London) 405, 590–593.15. Siegele, D. A. & Hu, J. C. (1997) Proc. Natl. Acad. Sci. USA 94, 8168–8172.16. Carrier, T. A. & Keasl<strong>in</strong>g, J. D. (1999) J. Theor. Biol. 201, 25–36.17. Gardner, T. S., Cantor, C. R. & Coll<strong>in</strong>s, J. J. (2000) Nature (London) 403,339–342.18. Elowitz, M. B. & Leibler, S. (2000) Nature (London) 403, 335–338.19. Chapon, C. (1982) EMBO J. 1, 369–374.20. Paulsson, J., Berg, O. G. & Ehrenberg, M. (2000) Proc. Natl. Acad. Soc. USA97, 7148–7153. (First Published June 13, 2000; 10.1073pnas.110057697)21. Paulsson, J. & Ehrenberg, M. (2000) Phys. Rev. Lett. 84, 5447–5450.22. DeHaseth, P. L., Zupancic, M. L. & Record, M. T., Jr. (1998) J. Bacteriol. 180,3019–3025.23. Schmitt, B. & Reiss, C. (1995) Biochem. J. 306, 123–128.24. McClure, W. R. (1985) Ann. Rev. Biochem. 54, 171–204.25. Schlax, P. J., Capp, M. W. & Record, M. T., Jr. (1995) J. Mol. Biol. 245, 331–350.26. Shea, M. A. & Ackers, G. K. (1985) J. Mol. Biol. 181, 211–230.27. Yarchuk, O., Jacques, N., Guillerez, J. & Dreyfus, M. (1992) J. Mol. Biol. 226,581–596.28. van Kampen, N. G. (1992) Stochastic Processes <strong>in</strong> Physics and Chemistry(North–Holland, Amsterdam).29. Gillespie, D. T. (1977) J. Phys. Chem. 81, 2340–2361.BIOPHYSICSThattai and van Oudenaarden PNAS July 17, 2001 vol. 98 no. 15 8619