National Studbook of Indian Wild Ass - Central Zoo Authority
National Studbook of Indian Wild Ass - Central Zoo Authority
National Studbook of Indian Wild Ass - Central Zoo Authority

You also want an ePaper? Increase the reach of your titles
YUMPU automatically turns print PDFs into web optimized ePapers that Google loves.
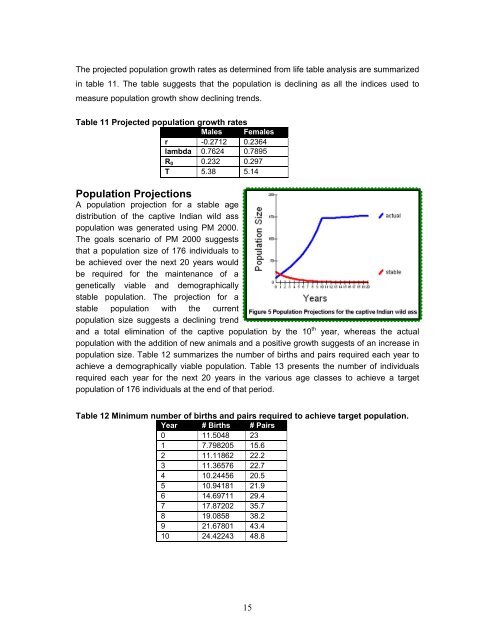
The projected population growth rates as determined from life table analysis are summarized<br />
in table 11. The table suggests that the population is declining as all the indices used to<br />
measure population growth show declining trends.<br />
Table 11 Projected population growth rates<br />
Males Females<br />
r -0.2712 0.2364<br />
lambda 0.7624 0.7895<br />
R0 0.232 0.297<br />
T 5.38 5.14<br />
Population Projections<br />
A population projection for a stable age<br />
distribution <strong>of</strong> the captive <strong>Indian</strong> wild ass<br />
population was generated using PM 2000.<br />
The goals scenario <strong>of</strong> PM 2000 suggests<br />
that a population size <strong>of</strong> 176 individuals to<br />
be achieved over the next 20 years would<br />
be required for the maintenance <strong>of</strong> a<br />
genetically viable and demographically<br />
stable population. The projection for a<br />
stable population with the current<br />
population size suggests a declining trend<br />
and a total elimination <strong>of</strong> the captive population by the 10 th year, whereas the actual<br />
population with the addition <strong>of</strong> new animals and a positive growth suggests <strong>of</strong> an increase in<br />
population size. Table 12 summarizes the number <strong>of</strong> births and pairs required each year to<br />
achieve a demographically viable population. Table 13 presents the number <strong>of</strong> individuals<br />
required each year for the next 20 years in the various age classes to achieve a target<br />
population <strong>of</strong> 176 individuals at the end <strong>of</strong> that period.<br />
Table 12 Minimum number <strong>of</strong> births and pairs required to achieve target population.<br />
Year # Births # Pairs<br />
0 11.5048 23<br />
1 7.798205 15.6<br />
2 11.11862 22.2<br />
3 11.36576 22.7<br />
4 10.24456 20.5<br />
5 10.94181 21.9<br />
6 14.69711 29.4<br />
7 17.87202 35.7<br />
8 19.0858 38.2<br />
9 21.67801 43.4<br />
10 24.42243 48.8<br />
15