Improving schools: full plan - Learning Wales - Welsh Government
Improving schools: full plan - Learning Wales - Welsh Government
Improving schools: full plan - Learning Wales - Welsh Government

Create successful ePaper yourself
Turn your PDF publications into a flip-book with our unique Google optimized e-Paper software.
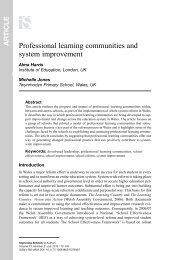
Figure 5: Absence in <strong>schools</strong> by local authority (2011)% school sessions missed, all absences (2011)11109876543210Source: Pupils' Attendance Recordprimary and specialsecondaryHow are we doing across our <strong>schools</strong>?Figure 6 shows that the percentage of Year 11 learners attaining the expected level atsecondary school typically decreases as the proportion of e-FSM learners in the schoolincreases (when looking left to right across the chart). Schools with less than five percente-FSM learners typically have over 70 per cent of their learners attaining the expected level.For <strong>schools</strong> with more than 30 per cent e-FSM learners, the percentage of learners attainingthis level is below 40 per cent. For any given percentage of e-FSM learners, performancevaries between <strong>schools</strong> (looking up and down the chart). For example, the performance of<strong>schools</strong> with 15 per cent e-FSM learners ranges from 40 per cent to 60 per cent: that is,<strong>schools</strong> with similar levels of challenge can have differences of up to 20 percentagepoints in learners attaining the expected level. The equivalent analysis for primary <strong>schools</strong>shows a similar pattern, albeit not as strong, with the percentage of Year 6 learnersattaining the expected level typically decreasing as the proportion of e-FSM learners in theschool increases.<strong>Improving</strong> <strong>schools</strong>9