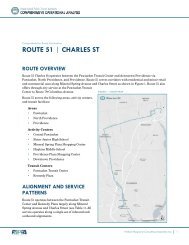
Sunday Ridership by TripMost Sunday trips carry 20 to 25 passengers (see Figure 7). The first several trips of the day before 9:00AM carry fewer than 10 passengers. Ridership is generally balanced between inbound and outbound trips,though Sunday exhibits a drop in inbound ridership during the evening (and this drop in evening inboundridership is evident across all service days).FIGURE 7 | SUNDAY RIDERSHIP PER TRIP5045403530SundayInboundOutboundRiders per Trip25201510506:507:308:259:0510:0010:4011:3512:1513:1013:5014:4515:2516:2017:0017:5518:35PERFORMANCERoute <strong>78</strong> is the best performing north-south route east of the Seekonk River. However, by most measures,it performs close to, but slightly below, average:• The route’s operating cost per passenger, at $3.43, is 10% higher than the system average.• The route carries 11% fewer passengers per revenue hour (29.5) than the system average.• The number of bus stops per mile is only slightly higher than average. However, stop spacingsvary considerably along the route and many areas have stops very closely spaced. For example,the School Street/Prospect Street pairs have over nine stops per mile.TABLE 4| PERFORMANCE MEASURESPERFORMANCE MEASURE <strong>ROUTE</strong> <strong>78</strong> SYSTEM<strong>AVE</strong>RAGEOperating Cost per Passenger $3.43 $3.12Passengers per Revenue Vehicle Hour 29.5 33.2Passengers per Revenue Vehicle Mile 1.9 2.5Total Vehicle Hours per Revenue Vehicle Hour 1.03 1.1Average Speed (mph) 15.2 13.4Bus Stops per Mile 5.9 5.6Performance data is from RIPTA.Nelson\Nygaard Consulting Associates Inc. | 8
OVERALL ASSESSMENTRoute <strong>78</strong> provides important north-south service through Pawtucket and East Providence, and performsfairly well. The route overlaps Route 35 Rumford along Newport Avenue in East Providence, but this is toserve the Narragansett Park Plaza shopping center, which is a major area activity center. The two routesalso run along the same alignment between Six Corners in East Providence and downtown Providence. Inthis area, the overall amount of service that the two routes provide appears warranted (an average ofapproximately every 25 minutes during peak periods). However, the schedules of the two routes are notcoordinated, and thus the benefits of the combined service frequencies are not fully realized.The route serves the major shopping areas in East Providence and the southeastern side of Pawtucket,which produces a somewhat indirect routing. However, ridership to and from these shopping centers ishigh and thus the existing alignment is appropriate.Although the route performs well overall, it does have two significant weaknesses. First, the deviations toPleasant Street and Rumford Towers, and the service via New Road serve virtually no riders,inconvenience many riders, produce gaps in the regular schedule, and prevent the scheduling of service atregular headways. Second, the route performs fairly well in spite of its infrequent service frequencies(every 45 to 52 minutes during peak periods). Relatively strong ridership levels in spite of infrequentservice indicates that more frequent service may be appropriate.SERVICE OPTIONSThere are a number of changes that could improve service and productivity:• Discontinue Underutilized Variant Services: As described above, Route <strong>78</strong> operates withthree variant services that carry few riders and undermine the overall effectiveness of the route.The elimination of these variants could provide more convenient service to most existing ridersand provide the ability to improve schedules, which would benefit existing riders and attract newriders:− Pleasant Street, which serves only one rider per weekday) and inconveniences theoverwhelming majority of riders who ride through the deviation.− Rumford Towers, which serves only one rider per weekday and inconveniences theoverwhelming majority of riders who ride through the stop. The low ridership activity doesnot justify the deviation and it could be discontinued.− Service via New Road, which serves only two riders per weekday and adds unnecessarycomplexity to the schedule.• Operate Weekday Service with Consistent Service Frequencies: On weekdays, servicelargely operates with consistent headways, but with exceptions. With the elimination of the lowridership variant services, weekday service could be provided consistently every 45 minutes(compared to every 45 to 52 minutes at present).• Interline Route 35 Rumford and <strong>78</strong> Peak Period Service: During peak periods, Routes35 and <strong>78</strong> operate with similar but different schedule (approximately every 50 minutes) but withslightly different schedules. The interlining of the two routes would allow regular headways to beprovided between Six Corners and Kennedy Plaza, and would likely reduce berth requirements atKennedy Plaza.• Operate Saturday Service with Consistent Service Frequencies: Saturday servicecurrently operates every 42 to 60 minutes. Service could be made more convenient by providingconsistent 45 minute headways throughout the day.Nelson\Nygaard Consulting Associates Inc. | 9