Detection of reactive oxygen species by flow ... - ResearchGate
Detection of reactive oxygen species by flow ... - ResearchGate
Detection of reactive oxygen species by flow ... - ResearchGate

Create successful ePaper yourself
Turn your PDF publications into a flip-book with our unique Google optimized e-Paper software.
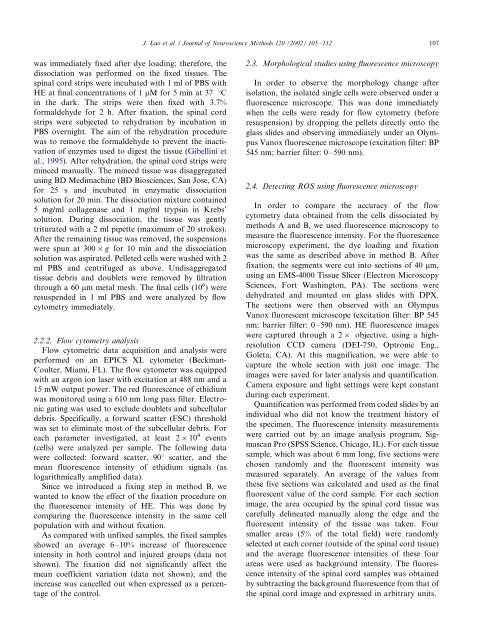
J. Luo et al. / Journal <strong>of</strong> Neuroscience Methods 120 (2002) 105/112 107was immediately fixed after dye loading; therefore, thedissociation was performed on the fixed tissues. Thespinal cord strips were incubated with 1 ml <strong>of</strong> PBS withHE at final concentrations <strong>of</strong> 1 mM for 5 min at 37 8Cin the dark. The strips were then fixed with 3.7%formaldehyde for 2 h. After fixation, the spinal cordstrips were subjected to rehydration <strong>by</strong> incubation inPBS overnight. The aim <strong>of</strong> the rehydration procedurewas to remove the formaldehyde to prevent the inactivation<strong>of</strong> enzymes used to digest the tissue (Gibellini etal., 1995). After rehydration, the spinal cord strips wereminced manually. The minced tissue was disaggregatedusing BD Medimachine (BD Biosciences, San Jose, CA)for 25 s and incubated in enzymatic dissociationsolution for 20 min. The dissociation mixture contained5 mg/ml collagenase and 1 mg/ml trypsin in Krebs’solution. During dissociation, the tissue was gentlytriturated with a 2 ml pipette (maximum <strong>of</strong> 20 strokes).After the remaining tissue was removed, the suspensionswere spun at 300/g for 10 min and the dissociationsolution was aspirated. Pelleted cells were washed with 2ml PBS and centrifuged as above. Undisaggregatedtissue debris and doublets were removed <strong>by</strong> filtrationthrough a 60 mm metal mesh. The final cells (10 6 ) wereresuspended in 1 ml PBS and were analyzed <strong>by</strong> <strong>flow</strong>cytometry immediately.2.2.2. Flow cytometry analysisFlow cytometric data acquisition and analysis wereperformed on an EPICS XL cytometer (Beckman-Coulter, Miami, FL). The <strong>flow</strong> cytometer was equippedwith an argon ion laser with excitation at 488 nm and a15 mW output power. The red fluorescence <strong>of</strong> ethidiumwas monitored using a 610 nm long pass filter. Electronicgating was used to exclude doublets and subcellulardebris. Specifically, a forward scatter (FSC) thresholdwas set to eliminate most <strong>of</strong> the subcellular debris. Foreach parameter investigated, at least 2/10 4 events(cells) were analyzed per sample. The following datawere collected: forward scatter, 908 scatter, and themean fluorescence intensity <strong>of</strong> ethidium signals (aslogarithmically amplified data).Since we introduced a fixing step in method B, wewanted to know the effect <strong>of</strong> the fixation procedure onthe fluorescence intensity <strong>of</strong> HE. This was done <strong>by</strong>comparing the fluorescence intensity in the same cellpopulation with and without fixation.As compared with unfixed samples, the fixed samplesshowed an average 6/10% increase <strong>of</strong> fluorescenceintensity in both control and injured groups (data notshown). The fixation did not significantly affect themean coefficient variation (data not shown), and theincrease was cancelled out when expressed as a percentage<strong>of</strong> the control.2.3. Morphological studies using fluorescence microscopyIn order to observe the morphology change afterisolation, the isolated single cells were observed under afluorescence microscope. This was done immediatelywhen the cells were ready for <strong>flow</strong> cytometry (beforeresuspension) <strong>by</strong> dropping the pellets directly onto theglass slides and observing immediately under an OlympusVanox fluorescence microscope (excitation filter: BP545 nm; barrier filter: 0/590 nm).2.4. Detecting ROS using fluorescence microscopyIn order to compare the accuracy <strong>of</strong> the <strong>flow</strong>cytometry data obtained from the cells dissociated <strong>by</strong>methods A and B, we used fluorescence microscopy tomeasure the fluorescence intensity. For the fluorescencemicroscopy experiment, the dye loading and fixationwas the same as described above in method B. Afterfixation, the segments were cut into sections <strong>of</strong> 40 mm,using an EMS-4000 Tissue Slicer (Electron MicroscopySciences, Fort Washington, PA). The sections weredehydrated and mounted on glass slides with DPX.The sections were then observed with an OlympusVanox fluorescent microscope (excitation filter: BP 545nm; barrier filter: 0/590 nm). HE fluorescence imageswere captured through a 2/ objective, using a highresolutionCCD camera (DEI-750, Optronic Eng.,Goleta, CA). At this magnification, we were able tocapture the whole section with just one image. Theimages were saved for later analysis and quantification.Camera exposure and light settings were kept constantduring each experiment.Quantification was performed from coded slides <strong>by</strong> anindividual who did not know the treatment history <strong>of</strong>the specimen. The fluorescence intensity measurementswere carried out <strong>by</strong> an image analysis program, SigmascanPro (SPSS Science, Chicago, IL). For each tissuesample, which was about 6 mm long, five sections werechosen randomly and the fluorescent intensity wasmeasured separately. An average <strong>of</strong> the values fromthese five sections was calculated and used as the finalfluorescent value <strong>of</strong> the cord sample. For each sectionimage, the area occupied <strong>by</strong> the spinal cord tissue wascarefully delineated manually along the edge and thefluorescent intensity <strong>of</strong> the tissue was taken. Foursmaller areas (5% <strong>of</strong> the total field) were randomlyselected at each corner (outside <strong>of</strong> the spinal cord tissue)and the average fluorescence intensities <strong>of</strong> these fourareas were used as background intensity. The fluorescenceintensity <strong>of</strong> the spinal cord samples was obtained<strong>by</strong> subtracting the background fluorescence from that <strong>of</strong>the spinal cord image and expressed in arbitrary units.