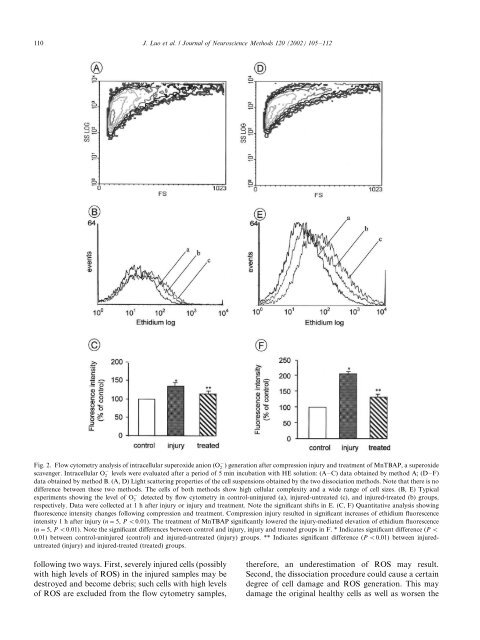
110J. Luo et al. / Journal <strong>of</strong> Neuroscience Methods 120 (2002) 105/112Fig. 2. Flow cytometry analysis <strong>of</strong> intracellular superoxide anion (O 2) generation after compression injury and treatment <strong>of</strong> MnTBAP, a superoxidescavenger. Intracellular O 2levels were evaluated after a period <strong>of</strong> 5 min incubation with HE solution: (A/C) data obtained <strong>by</strong> method A; (D/F)data obtained <strong>by</strong> method B. (A, D) Light scattering properties <strong>of</strong> the cell suspensions obtained <strong>by</strong> the two dissociation methods. Note that there is nodifference between these two methods. The cells <strong>of</strong> both methods show high cellular complexity and a wide range <strong>of</strong> cell sizes. (B, E) Typicalexperiments showing the level <strong>of</strong> O 2detected <strong>by</strong> <strong>flow</strong> cytometry in control-uninjured (a), injured-untreated (c), and injured-treated (b) groups,respectively. Data were collected at 1 h after injury or injury and treatment. Note the significant shifts in E. (C, F) Quantitative analysis showingfluorescence intensity changes following compression and treatment. Compression injury resulted in significant increases <strong>of</strong> ethidium fluorescenceintensity 1 h after injury (n/5, P B/0.01). The treatment <strong>of</strong> MnTBAP significantly lowered the injury-mediated elevation <strong>of</strong> ethidium fluorescence(n/5, P B/0.01). Note the significant differences between control and injury, injury and treated groups in F. * Indicates significant difference (P B/0.01) between control-uninjured (control) and injured-untreated (injury) groups. ** Indicates significant difference (P B/0.01) between injureduntreated(injury) and injured-treated (treated) groups.following two ways. First, severely injured cells (possiblywith high levels <strong>of</strong> ROS) in the injured samples may bedestroyed and become debris; such cells with high levels<strong>of</strong> ROS are excluded from the <strong>flow</strong> cytometry samples,therefore, an underestimation <strong>of</strong> ROS may result.Second, the dissociation procedure could cause a certaindegree <strong>of</strong> cell damage and ROS generation. This maydamage the original healthy cells as well as worsen the
J. Luo et al. / Journal <strong>of</strong> Neuroscience Methods 120 (2002) 105/112 111Fig. 3. Quantification <strong>of</strong> ethidium fluorescence intensity and itsinhibition at 1 h after injury as observed <strong>by</strong> the fluorescencemicroscope. The fluorescence intensity <strong>of</strong> the sample area was thenobtained <strong>by</strong> background subtraction. Values were expressed aspercentages <strong>of</strong> control groups with control as 100%. Compressioninjury caused significantly ethidium fluorescence intensity (n/5, *P B/0.05 as compared with control). Treatment <strong>of</strong> MnTBAP reducedethidium fluorescence intensity (n/5, **P B/0.05 as compared withinjury).Fig. 4. The change <strong>of</strong> LPO following compression and its inhibition 1h post-injury <strong>by</strong> MnTBAP. LPO (nmol/100 mg wet tissue) wasexpressed as mean9/SD (n/5 in each group, P B/0.01). * Indicatessignificant difference (P B/0.01) between control-uninjured (control)and injured-untreated (injury) groups. ** Indicates significant difference(P B/0.01) between injured-untreated (injury) and injured-treated(treated) groups.injured cells. Both can lead to increase <strong>of</strong> ROS, whichmay obscure the ROS generation caused <strong>by</strong> deliberateinjury. Obviously, the optimal dissociation method isthe one that causes only minimal cell damage. Currently,the commonly used methods are mechanical, enzymatic(biochemical), and the combination <strong>of</strong> both. Thesemethods have been widely and successfully applied inmany kinds <strong>of</strong> studies to dissociate single cells fromfresh, uninjured tissues (Kay and Wong, 1986; Groganand Collins, 1990; Watson, 1991; Visscher and Crissman,1994; Brewer, 1997; Diamond et al., 2000). Inpreliminary studies, we found that the combinationmethod works best with respect to the maximal cellyields and minimal cell damage during isolation (datanot shown). We also found that a relatively speedydissociation was achieved when using enzyme mixtures,as suggested <strong>by</strong> others (Pretlow and Pretlow, 1991). Inthis study, we used a mixture <strong>of</strong> trypsin and collagenase,considering trypsin to break intercellular linkage andcollagenase to break up stromal components (Pretlowand Pretlow, 1991). We also identified the optimalconcentrations <strong>of</strong> the enzymes to use and the propermechanical forces to be applied. Using this optimizeddissociation method, we are able to reduce the damagecaused <strong>by</strong> the dissociation process to some degree.However, it was still not certain that the damage caused<strong>by</strong> the dissociation process was minimal. It was clear tous that an extra step was needed to make a significantimprovement.In an attempt to solve this problem, we developed anew dissociation method (method B). In this method, weintroduced a fixation step after HE loading and beforedissociation. It is evident that this method is better thanmethod A in terms <strong>of</strong> ROS detection sensitivity. Sincethe cells are fixed before dissociation, the actual ROSlevel before dissociation is preserved and the possibility<strong>of</strong> ROS generation during dissociation is greatly minimized.Further, since all the cells, including injured andhealthy ones, in the samples are fixed and cellularstructures are preserved, they may have equal susceptibilityto the damage caused <strong>by</strong> the dissociation process.This reduces the possibility that more severely injuredcells with higher ROS levels are destroyed and excludedfrom <strong>flow</strong> cytometry analysis. Therefore, the resultsobtained <strong>by</strong> method B are presumably more accurate.Table 1Comparison <strong>of</strong> the data <strong>of</strong> ROS detected <strong>by</strong> different methodsFlow cytometry Fluorescence microscopy LPOMethod AMethod BSCI-induced ROS increases 35.1 108.2 101.2 209.5MnTBAP-treatment-induced ROS decreases 16.06 32.13 29.77 28.12The ‘SCI-induced ROS increases’ were expressed as [(data injury group data control group )/data control group ]100%; the ‘MnTBAP-treatment-inducedROS decreases’ were expressed as [(data injury group data treated group )/data injury group ]100%. Note that the <strong>flow</strong> cytometry data obtained frommethod B are in better agreement with those <strong>of</strong> fluorescence microscopy and LPO assays.