Human Sleep and Sleep EEG - Measurement Science Review
Human Sleep and Sleep EEG - Measurement Science Review
Human Sleep and Sleep EEG - Measurement Science Review

Create successful ePaper yourself
Turn your PDF publications into a flip-book with our unique Google optimized e-Paper software.
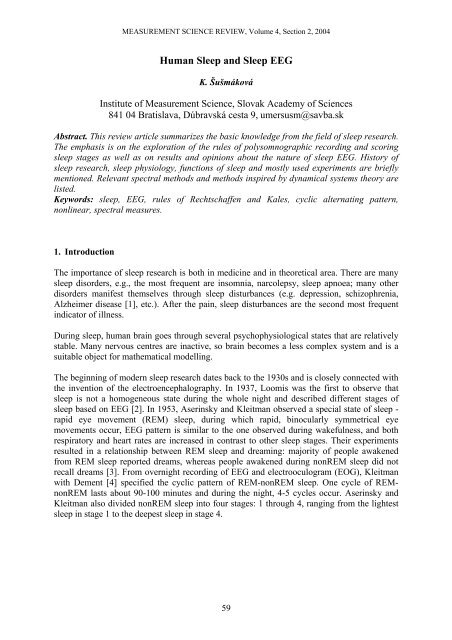
MEASUREMENT SCIENCE REVIEW, Volume 4, Section 2, 2004<strong>Human</strong> <strong>Sleep</strong> <strong>and</strong> <strong>Sleep</strong> <strong>EEG</strong>K. ŠušmákováInstitute of <strong>Measurement</strong> <strong>Science</strong>, Slovak Academy of <strong>Science</strong>s841 04 Bratislava, Dúbravská cesta 9, umersusm@savba.skAbstract. This review article summarizes the basic knowledge from the field of sleep research.The emphasis is on the exploration of the rules of polysomnographic recording <strong>and</strong> scoringsleep stages as well as on results <strong>and</strong> opinions about the nature of sleep <strong>EEG</strong>. History ofsleep research, sleep physiology, functions of sleep <strong>and</strong> mostly used experiments are brieflymentioned. Relevant spectral methods <strong>and</strong> methods inspired by dynamical systems theory arelisted.Keywords: sleep, <strong>EEG</strong>, rules of Rechtschaffen <strong>and</strong> Kales, cyclic alternating pattern,nonlinear, spectral measures.1. IntroductionThe importance of sleep research is both in medicine <strong>and</strong> in theoretical area. There are manysleep disorders, e.g., the most frequent are insomnia, narcolepsy, sleep apnoea; many otherdisorders manifest themselves through sleep disturbances (e.g. depression, schizophrenia,Alzheimer disease [1], etc.). After the pain, sleep disturbances are the second most frequentindicator of illness.During sleep, human brain goes through several psychophysiological states that are relativelystable. Many nervous centres are inactive, so brain becomes a less complex system <strong>and</strong> is asuitable object for mathematical modelling.The beginning of modern sleep research dates back to the 1930s <strong>and</strong> is closely connected withthe invention of the electroencephalography. In 1937, Loomis was the first to observe thatsleep is not a homogeneous state during the whole night <strong>and</strong> described different stages ofsleep based on <strong>EEG</strong> [2]. In 1953, Aserinsky <strong>and</strong> Kleitman observed a special state of sleep -rapid eye movement (REM) sleep, during which rapid, binocularly symmetrical eyemovements occur, <strong>EEG</strong> pattern is similar to the one observed during wakefulness, <strong>and</strong> bothrespiratory <strong>and</strong> heart rates are increased in contrast to other sleep stages. Their experimentsresulted in a relationship between REM sleep <strong>and</strong> dreaming: majority of people awakenedfrom REM sleep reported dreams, whereas people awakened during nonREM sleep did notrecall dreams [3]. From overnight recording of <strong>EEG</strong> <strong>and</strong> electrooculogram (EOG), Kleitmanwith Dement [4] specified the cyclic pattern of REM-nonREM sleep. One cycle of REMnonREMlasts about 90-100 minutes <strong>and</strong> during the night, 4-5 cycles occur. Aserinsky <strong>and</strong>Kleitman also divided nonREM sleep into four stages: 1 through 4, ranging from the lightestsleep in stage 1 to the deepest sleep in stage 4.59
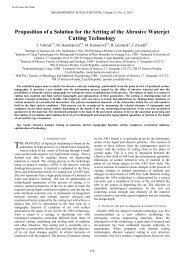
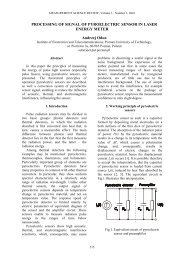
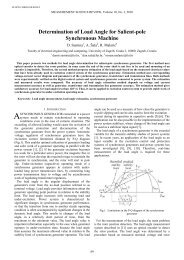
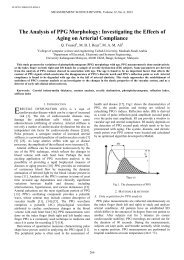
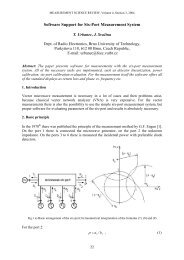
<strong>Measurement</strong> in Biomedicine • K. ŠušmákováFigure 1: Placement of electrodes of polysomnographic measurement2. <strong>Sleep</strong> Stages <strong>and</strong> the Rules of Rechtschaffen <strong>and</strong> KalesThe main states of vigilance are wakefulness, REM sleep <strong>and</strong> nonREM sleep. NonREM sleepis further divided into four Stages from the lightest Stage 1 to the deepest Stage 4. Stages 3<strong>and</strong> 4 are referred to as slow wave sleep (SWS). The frequency of sleep Stages alters duringthe night - in the early hours of sleep SWS dominates, whereas REM sleep occurs more oftenin the second part of sleep. The portion of REM sleep during night alters with age - in newbornbabies REM sleep lasts for 50%, in adults for 20%.An essential method in human clinical <strong>and</strong> basic sleep research is polysomnography. It iscomposed of measuring electroencephalogram (<strong>EEG</strong>), electrooculogram (EOG) <strong>and</strong>electromyogram (EMG), see Figure1. Electroencephalography is the basic method with anexcellent temporal resolution <strong>and</strong> lower spatial resolution of electrical activity of cerebralcortex. The quality of <strong>EEG</strong> recording depends on some technical parameters, see [5] fordetails.<strong>Sleep</strong> Stages are scored according to “A Manual of St<strong>and</strong>ardized Terminology, Techniques<strong>and</strong> Scoring System for <strong>Sleep</strong> Stages of <strong>Human</strong> Subject”, which was elaborated in 1968 by acommittee co-chaired by A.Rechtschaffen <strong>and</strong> A.Kales [6]. The purpose of these uniform <strong>and</strong>st<strong>and</strong>ard criteria was to increase the comparability <strong>and</strong> replicability of results from differentlaboratories. The Manual involves parameters, techniques <strong>and</strong> wave patterns ofpolysomnographic recordings. One channel of <strong>EEG</strong>, two channels of EOG <strong>and</strong> one channel ofEMG are recorded. The <strong>EEG</strong> derivations are C4/A1 or C3/A2 according to the 10-20electrode placement system (see Fig.2). The potentials for eyes movements recording aremeasured from 1 cm above <strong>and</strong> slightly lateral to the outher canthus of one eye <strong>and</strong> 1 cmbelow <strong>and</strong> lateral to the outer canthus of the second eye. The reference electrodes for botheyes are placed on the same ear lobe or mastoid. The EMG is recorded beneath the chin(mental, submental). The placement of electrodes of polysomnographic recording isillustrated on Fig. 1. The Stages are scored epoch-by-epoch in 20-30 s intervals.Waking (Stage W)There is a low voltage (10 − 30µV) <strong>and</strong> mixed frequency <strong>EEG</strong> during wakefulness (see Fig.3). Possible features are alpha activity in <strong>EEG</strong> <strong>and</strong> relatively high tonic EMG.60
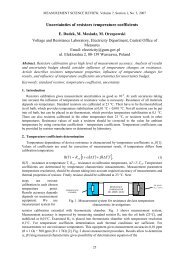
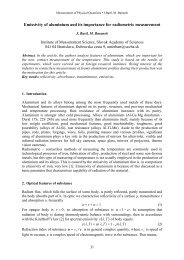
MEASUREMENT SCIENCE REVIEW, Volume 4, Section 2, 2004Movement TimeIf in more than half an epoch of the <strong>EEG</strong> or EMG signals are unclear due to amplifierblocking or muscle activity, the epoch is counted neither with sleep nor with waking, but islabelled as movement time. It is not the same as discrete body movements, which could bevery short. Body movements can be a part of a sleep Stage or the movement time.Figure 2: 10-20 electrode placement system for <strong>EEG</strong> measurementStage 1Stage 1 is characterized by low voltage, mixed frequency <strong>EEG</strong> with the highest amplitude in2-7 Hz range (see Fig. 3). The vertex sharp waves may occur; their amplitude can reach thevalue of about 200 µV. In Stage 1 after wakefulness slow eye movements can be present. TheEMG level is lower than in the wakefulness. Stage 1 is also scored when the epoch ischaracterized with alpha activity combined with mixed frequency <strong>EEG</strong> <strong>and</strong> the amount ofalpha activity is less than 50% of an epoch.Stage 2Stage 2 is characterized by wave patterns sleep spindles <strong>and</strong> K complexes <strong>and</strong> the absence ofslow waves (see Fig. 3). K complex is a sharp negative wave followed by a slower positiveone. <strong>Sleep</strong> spindles occur in 12-14 Hz frequency range. The duration of these patterns shouldbe 0.5 s at minimum. If the time between two succeeding occurrences of sleep spindles or Kcomplexes is lower than 3 min, this interval is scored as Stage 2, unless there are movementarousals or increased tonic activity. If the time interval is 3 min or more, it is scored as Stage1.Stage 320%-50% of the epoch of <strong>EEG</strong> record should contain waves with 2 Hz or slower <strong>and</strong> with theamplitudes above 75 µV if the epoch is scored as Stage 3, see Fig. 3. <strong>Sleep</strong> spindles <strong>and</strong> Kcomplexes may occur during Stage 3.61
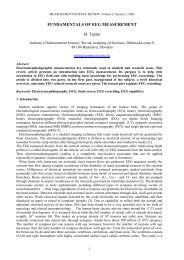
<strong>Measurement</strong> in Biomedicine • K. ŠušmákováStage 4Stage 4 has the same attributes as Stage 3, but waves with 2 Hz <strong>and</strong> slower with theamplitudes greater than 75 µV 50 appear more than 50% of the epoch.Stage REMStage REM shows low voltage <strong>and</strong> mixed frequency (similarly to Stage 1) of <strong>EEG</strong>, sawtoothwave pattern is often present (see Fig. 3). EMG reaches the lowest level <strong>and</strong> episodic rapideye movements occur (REMs).Figure 3: Wave pattern of different sleep StagesThere exist cases when no movement arousals are present, <strong>EEG</strong> exhibits a relatively lowvoltage <strong>and</strong> mixed frequency, <strong>and</strong> sleep spindles (K complexes) characteristic for Stage 2alternate with typical features of Stage REM (REMs, the lowest EMG level). Then scoringfollows these rules:1. Stage REM: EMG is at the lowest Stage REM level or the rapid eyes movements arepresent.2. Stage 2: interval between two sleep spindles or K complexes is less than 3 minutes. Therules of Rechtschaffen <strong>and</strong> Kales have been used for more than 35 years, but they have somedearths <strong>and</strong> disadvantages [7]:• They ignore events shorter than 30 seconds. If the interval contains features from morethan one Stage, it is scored as the Stage whose features have the longest duration.• They are designated for healthy adult people <strong>and</strong> hence, it is not possible to scoreatypical patterns in cases of ill people or children.• Some wave patterns (sleep spindles or K complexes) are not well defined, especiallywith respect to automated sleep scoring.62
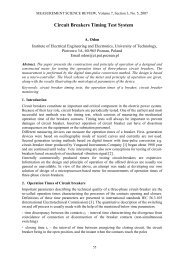
MEASUREMENT SCIENCE REVIEW, Volume 4, Section 2, 20043. Cyclic alternating patternThe alternation of the above defined sleep Stages represents the macrodynamics of brain. Inthe concrete sleep Stage the level of arousal is assumed to be stable [8]. Different approachgives the idea of cyclic alternating pattern (CAP). CAP is a “periodic <strong>EEG</strong> activity ofnonREM sleep, characterized by sequences of transient electrocortical events that are distinctfrom the background <strong>EEG</strong> activity <strong>and</strong> recur at up to 1 min intervals” [9]. CAP is functionallyconnected with fluctuation of arousal. CAP sequences occur in all Stages 1, 2, 3 <strong>and</strong> 4 <strong>and</strong> inpreference to 4 sleep onset, after awakeness during sleep <strong>and</strong> before the transition fromnonREM to REM sleep [8]. In normal REM sleep CAP does not occur. The rate time(CAP)/time(NREM) in young adults is about 23% <strong>and</strong> increases with age [8].Figure 4: Cyclic alternating pattern (C) in sleep Stage 2.A - phase A, B - phase B.<strong>EEG</strong> derivations after international electrode placement: top 6 channels from top to bottom:FP2-F4, F4-C4, C4-P4, P4-O2, F8-T4, T4-T6.OCULOG - oculogram.bottom 7 channels: FP1-F3, F3-C3, C3-P3, P3-O1, F7-T3, T3-T5, F2-C2.EKG - electrocardiogram 1CAP is composed of two phases - phase A <strong>and</strong> phase B (see Fig. 4). At least two CAP cycles haveto occur consecutively to be regarded as CAP sequence. Phase A represents events clearlyoutst<strong>and</strong>ing from the background rhythm - abrupt changes in frequency <strong>and</strong>/or amplitude. PhaseB is an intervening interval between phases A.1 Reprinted from <strong>Sleep</strong> Medicine 2, Terzano M. G. et al.: Atlas, rules, <strong>and</strong> recording techniques for the scoringof cyclic alternating pattern (CAP) in human sleep., 537-553, 2001 with permission from Elsevier63
<strong>Measurement</strong> in Biomedicine • K. ŠušmákováAccording to American <strong>Sleep</strong> Disorders Association CAP, sequences <strong>and</strong> microarousals mayindicate instability or sleep disturbances with detrimental effects on sleep. Halász, Terzano et al.[10] presented an opposing idea: microarousals <strong>and</strong> CAP sequences are natural parts of the sleeptexture. The physiological function of CAP could be protecting of reversibility of sleep <strong>and</strong> also inconnection between the sleeping brain <strong>and</strong> his surrounding space to adapt to potential changes <strong>and</strong>danger.4. Physiology of sleep<strong>Sleep</strong>-wake cycle is regulated by multiple sleep <strong>and</strong> wake promoting systems, which are spreadall over in the brain. <strong>Sleep</strong> begins with activation of the preoptic area of the anteriorhypothalamus. <strong>Sleep</strong> promoting neurons project to wake-promoting centers <strong>and</strong> inhibit them withγ-aminobutyric acid (GABA) as neurotransmitter. The inhibition of wake-promoting neuronsworks on other sleep-promoting neurons <strong>and</strong> activates them, which results in intensifying thesleep process [11].Figure 5: <strong>Sleep</strong> <strong>and</strong> waking centres. S - suprachiasmatic nucleus in hypothalamus, G –lateral geniculate nucleus in thalamus, LDT - laterodorsal tegmental nucleus, PPT –pedunculopontine tegmental nucleus, LDT, PPT in brain stemREM sleep is regulated mostly by the brain stem; the two most important nuclei are laterodorsal(LDT) <strong>and</strong> pedunculopontine (PPT) tegmental nuclei. LDT <strong>and</strong> PPT project to thalamus, basalforebrain <strong>and</strong> the cortex, which output the desynchronized <strong>EEG</strong> pattern. The descendingpathways to α motor neuron cause the skeletal muscle atonia [12]. Typical neuronal activitybefore the rapid eyes movements - PGO waves - rises from the pons <strong>and</strong> spreads through LGN(lateral geniculate nucleus) in thalamus to the occipital lobe [13, 12].The waking <strong>and</strong> arousal promoting centers are located in the posterior hypothalamus, basalforebrain, mesopontine tegmentum <strong>and</strong> contain cholinergic, noradrenergic, serotonergic <strong>and</strong>histaminergic neurotransmitters [11]. The arousal starts in reticular activating system (RAS),which receives collateral inputs from visceral, motor <strong>and</strong> sensory systems. RAS projects to theforebrain <strong>and</strong> cortex via thalamic <strong>and</strong> extrathalamic neural pathways.64
MEASUREMENT SCIENCE REVIEW, Volume 4, Section 2, 20045. Function of sleepFor long time people were interested why sleep is so essential for the life. There are manytheories, which try to explain functions <strong>and</strong> the purpose of sleep. Some of them satisfactorilyinterpret several facts, but broadly accepted theory that would explain all phenomena <strong>and</strong>experiments, does not exist till now. Here only the main theories are mentioned:1. Conservation of energy: the main arguments for the purpose of sleep as reservation ofenergy are that during the sleep deprivation the energy consumption is increased <strong>and</strong> viceversa during sleep the basal metabolism is decreased about 5-25% [14].2. Restoration of tissues <strong>and</strong> growth: during the first hours of sleep growth hormoneexcretion, cell mitosis <strong>and</strong> protein synthesis are increased. In the time of growth or aftermore laboured day the amount of NREM sleep is increased during the night. However J.Horne [15] criticized this theory. According to him cell mitosis occurs a few hours afterfood intake <strong>and</strong> has a circadian rhythm, the decreasing metabolic rate is in discrepancywith the protein synthesis that needs higher energy cost <strong>and</strong> the increased temperature ofhead after physical activity is the cause of increased rate of SWS.3. Thermoregulation: in experiments with rats, long-term sleep deprived rats showed thetemperature increased in about 10 degree [16], so sleep probably decreases thetemperature.4. Regulation of emotions [17]: in humans the sleep deprivation causes the disturbances ofemotional behavior (such as concentration, interest for distinct goal, etc.), particularlySWS deprivation induces depressive or hypochondriacal states. So NREM sleep is likelyto be involved in adjusting <strong>and</strong> regulating these emotions. This theory is supported byclinical observations that depressed patients show lower duration of NREM sleep as wellas that metabolic rates <strong>and</strong> neuronal discharge are higher in brain regions that take controlof emotions (limbic structures) during NREM sleep in contrast with waking state.5. Neural maturation: one part of theories about sleep functions is concerned with REMsleep. The percentage of REM sleep of total sleep time decreases with age - in about 6.month of prenatal phase the children spend about 80% of sleep in REM sleep, but youngadult people only 25% [14]. So it is assumed that during REM sleep the maturation ofbrain <strong>and</strong> myelinization of nerve fibers proceed.6. Memory <strong>and</strong> learning: both types of sleep NREM <strong>and</strong> REM play a key role in memoryconsolidation <strong>and</strong> learning. There is an information transfer between cortex <strong>and</strong>hippocampus during the sleep that realizes the fixation of memory traces or during REMsleep the insignificant bindings are abolished [18]. With this reprocessing of informationalso the learning process is related. Several papers refer the improvement of performanceperceptual or motor task after sleep [19, 20]. The improvement is due to sleep <strong>and</strong> not dueto time interval or circadian factors.65
<strong>Measurement</strong> in Biomedicine • K. Šušmáková6. ExperimentsIn research <strong>and</strong> also in medical care, it is necessary to perform investigations <strong>and</strong> experiments. Inmost experiments people are asked to refrain from alcohol, caffeine <strong>and</strong> other drugs that influencesleep during the study <strong>and</strong> have a regular sleep regime some time before.Polysomnographic recordings of <strong>EEG</strong>, EOG, EMG are taken during the whole night to score thesleep Stages <strong>and</strong> the course of the sleep. In clinical practice ECG, blood pressure, bloodoxygenation <strong>and</strong> breath rate are also measured.Typical features of many sleep disorders are extreme fatigue <strong>and</strong> sleepiness during the day. Inorder to reveal the tendency to sleep during the day, the Multiple <strong>Sleep</strong> Latency Test (MSLT) isused. After a normal night person is lying in a dark quiet room <strong>and</strong> is asked to fall asleep. Timefrom the beginning of the test to the first epoch of sleep - the latency of the sleep – is measured.This procedure is repeated 4-5 times in two hour intervals during the whole day. The sleep onsetis obtained on the basis of the polysomnographic measurements. The average sleep latency isevaluated. The value of average sleep latency less than 5 min is regarded as pathological [21]. Inconditions similar to MSLT, the Maintenance of Wakefulness Test (MWT) is performed, butpeople are asked to remain awake during soporific circumstances. Again, the average sleeplatency is evaluated <strong>and</strong> the value less than 11 min is taken as pathological [22].Other types of experiments are also used in research of sleep regulation. Effects of sleepdeprivation or daytime naps are investigated <strong>and</strong> forced desynchrony experiments are arranged.The night after sleep deprivation (or daytime naps) is compared with the baseline night, <strong>and</strong> thevariation in <strong>EEG</strong> between them is evaluated. The most significant difference is in the amount ofslow wave sleep. In the forced desynchrony protocol people are exposed to artificial length of theday, different from 24 hour cycles. They are deprived of external periodic light/dark cycle. Duringone third of the artificial cycle, the lights are turned off <strong>and</strong> people have the opportunity to sleep[23, 24].Let us mention another type of experiments - from theoretical area - models of artificial neuralnetworks (ANN), which are inspired by nervous system. Originally, the ANN were developed tosolve problems in technical area, but today they can also be applied to physiological data. In sleepresearch, ANN are used in automated scoring of sleep Stages [25, 26] <strong>and</strong> in classifying artefactsin <strong>EEG</strong> [27].7. Models of sleep regulationToday it is generally accepted that there are three processes that regulate sleep: a homeostaticprocess, a circadian process <strong>and</strong> an ultradian process [28].The homeostatic process takes control of the amount of sleep <strong>and</strong> wakefulness, so that thehomeostasis is reached. It increases the fatigue <strong>and</strong> sleep propensity during wakefulness <strong>and</strong>decreases it during sleep. The indicator of homeostatic process is SWS, which occurs more in thefirst part of sleep <strong>and</strong> its presence during the night gradually decreases. The SWS activity issignificantly enhanced during the recovery night after sleep deprivation [29]. In contrast, daytimenaps cause the attenuation of SWS [28]. Until now, physiological centre of the homeostaticprocess has not been identified.66
MEASUREMENT SCIENCE REVIEW, Volume 4, Section 2, 2004Circadian process reflects the influence of external events which oscillate with circadian rhythm.Circadian process represents the alternation of sleep propensity with cca 24 hours rhythm. Also,some other processes show circadian behavior - for example the core body temperature, plasmamelatonin or cortisol concentration [24]. In the forced desynchrony protocol the circadian <strong>and</strong>homeostatic processes can be unlike the homeostatic process, the brain structure of the circadianpacemaker is known - it is the suprachiasmatic nuclei of the hypothalamus [24] (see Fig. 5).Ultradian process administers the variation of nonREM <strong>and</strong> REM phases during the sleep.One of the basic models is the two-process model of sleep regulation [23, 28]. It assumes theinteraction of the homeostatic <strong>and</strong> circadian processes. The homeostatic variable S (sleeppropensity) rises exponentially during wakefulness until it reaches the upper threshold H – thebeginning of the sleep. During sleep, S decreases, un till it reaches the lower threshold Lcharacteristic for the arousal. Both thresholds H <strong>and</strong> L change according to the phase of the day.The exponential function is fitted through 3 data points: the relative slow wave activity at the endof a normal night, after normal waking <strong>and</strong> after 40 hours of sleep deprivation.Other models of sleep regulation propose variant interaction between homeostatic <strong>and</strong> circadianprocess or add other components, for review see [28].8. Linear <strong>and</strong> nonlinear measuresSpectral theory is conventional <strong>and</strong> the most used linear tool in the analysis of biosignals. Spectralanalysis is used to investigate the signal’s power in the various frequency b<strong>and</strong>s <strong>and</strong> also themutual relationships between more signals. It is based on Fourier transform which displays signalin the frequency domain [30]:Xk=N 1∑ −j=0xje2πijk/ Nk= 0, K,N −1(1)where x 1 , ..., x i , ...x N is the measured signal in the time domain, X k is the amplitude correspondingto the k th frequency <strong>and</strong> N is the number of values.The power of particular frequency b<strong>and</strong> is computed as the sum of modulus-square amplitudesbelonging to this b<strong>and</strong>. Here is an example of the power in alpha b<strong>and</strong> (8Hz-12Hz):P α=k=k12 Hz∑k=k8 HzC k2(2)where k 8Hz is the lower limit of alpha b<strong>and</strong> <strong>and</strong> k 12Hz is the upper limit of alpha b<strong>and</strong>.Another often computed index is coherence that reflects the degree of synchrony between signalsfrom different derivations (brain areas). It is calculated as the ratio between crossspectrum of twosignals <strong>and</strong> a product of their autospectra:67
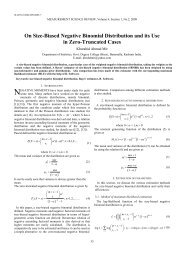
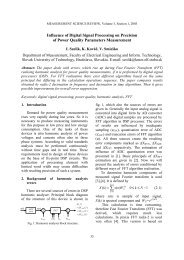
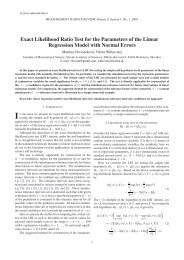
<strong>Measurement</strong> in Biomedicine • K. ŠušmákovácohAB ( f ) =( f )P ( f ) PAPABB2( f )(3)where PAB is the cross-spectral density of signals A,B <strong>and</strong> PA, PB are the autospectral density ofthese signals.The principal assumption for using spectral theory in stochastic processes is the stationarity of theprocess. This property is never exactly fulfilled in the case of <strong>EEG</strong> [31], but can be approximatedon very short time intervals (several seconds). For more details about assumptions <strong>and</strong> algorithmsfrom spectral theory see [30, 31]. Some results of applying spectral analysis to sleep <strong>EEG</strong> areincorporated in the Rechtschaffen <strong>and</strong> Kales rules for scoring sleep Stages [6].Dumermuth et al. [32, 33] have computed power <strong>and</strong> coherence spectra of all-night sleep <strong>EEG</strong>. Inaccordance with their results the integrated power <strong>and</strong> integrated coherence (0.1-7.0 Hz <strong>and</strong> 7.1-12.0 Hz) increases during SWS with regard to wakefulness. During REM phase the powerdecreases, but the coherence between hemispheres increases or maintaines at the same level, it ismost evident in the biparietal area [32]. The average power in frequency b<strong>and</strong> 0-6 Hz is maximalin Stage 4; in the b<strong>and</strong> 6-10 Hz it is in Stage 4 or in the Stage 3; in 12-14 Hz b<strong>and</strong> in Stage 2 <strong>and</strong>in the b<strong>and</strong> 14-30 Hz it is in the Stage 1 [33], see Figure 6. The shape of power spectra is similarin every Stage - the higher power is in the lower frequencies <strong>and</strong> vice versa. The range of power,e.g. the difference between highest <strong>and</strong> lowest power, varies with Stages, the lowest range is inStage 1 (12-14 dB) <strong>and</strong> increases with the depth of sleep to Stage 4 (29-32 dB). In Stage REM therange of power is between Stages 1 - 2 <strong>and</strong> in waking it is similar as in Stage 1. Coherence in thelow frequencies (0-8 Hz) is maximal in REM sleep, in the middle frequencies (8-14 Hz) in Stage3 or 4 <strong>and</strong> in the highest frequencies (14-30 Hz) again in REM sleep, it is most pronouncedbetween symmetrical interhemisferic derivations.Achermann et al. have done more precise coherence analysis of sleep <strong>EEG</strong> [34]. They haveevaluated Stage-dependent <strong>and</strong> topographic-dependent (intrahemisferic, interhemisferic -homologous <strong>and</strong> non-homologous comparisons) coherence spectra. Coherence spectra betweenhomologous derivations have declining frequency-dependent shape, in contrast with all othersderivations with flat, low-level spectra. In NREM sleep the coherence spectra show outst<strong>and</strong>ingpeak in sigma b<strong>and</strong> (13-14 Hz) in all derivations <strong>and</strong> smaller peaks in alpha <strong>and</strong> low delta b<strong>and</strong>s.In coherence spectra in REM sleep these peaks are attenuated.Merica <strong>and</strong> Blois [35] have compared the power in different frequency b<strong>and</strong>s in NREM versusREM sleep episodes within sleep cycle as well as during the course of the night. Within NREMepisode the power in β(14.75Hz-30Hz) b<strong>and</strong> changes reciprocally to the slower b<strong>and</strong>s (δ (0.5 Hz-3.75 Hz), θ (3.75 Hz-6.75 Hz)). In the last quarter before REM phase powers in all b<strong>and</strong>s but βdecreases <strong>and</strong> β power increases. The decrease of α (6.75 Hz-12.5 Hz), σ (12.5 Hz-14.75 Hz), θ<strong>and</strong> δ powers persists also on the first 30 % of time of REM phase <strong>and</strong> then the powers are stable.β power remains at the same level as on the end of NREM phase. The power of slower frequencyb<strong>and</strong>s (α, θ <strong>and</strong> δ) in NREM decreases during the night. Power of delta b<strong>and</strong> decreases inaccordance with the homeostatic process. The evolution of beta <strong>and</strong> sigma powers during thenight differ from the slower b<strong>and</strong>s: after the second episode of NREM sleep their power increase.The course of powers of all b<strong>and</strong>s in REM sleep is similar - it increases in all cases.68
MEASUREMENT SCIENCE REVIEW, Volume 4, Section 2, 2004Figure 6: Power spectra density in different sleep Stages <strong>and</strong> in wakefulness, the <strong>EEG</strong>derivation is Fpz-Cz, all signals are from the first episode of NREM-REM sleep cycle.0dB = 1µV 2 /0.25Hz. In the low-frequency part of the spectra (0-10 Hz) the maximal poweris in the SWS, in the 12-14 Hz b<strong>and</strong> the power is maximal in the Stage 2 <strong>and</strong> in the fastfrequencyb<strong>and</strong> the power is maximal in wakefulness.Ferri et al. [36] have focused on the analysis of high-frequency b<strong>and</strong>s: β(15-25 Hz), γ1 (25-35 Hz)<strong>and</strong> γ2 (35-45 Hz). The powers in these frequency b<strong>and</strong>s do not show significant changes, but thepeaks of ratios of β/γ2 <strong>and</strong> γ1/γ2 are highly correlated with occurrence REM sleep, during theNREM phases these ratios decrease. The delta power displays reciprocal activity with these tworatios.However, brain as the highest control system with many feedbacks appears to be a suitable objectfor nonlinear theory. Many methods of nonlinear theory are based on reconstruction of the phasespace. According to Taken’s theorem [37] it is possible to reconstruct a phase space topologicallyequivalent with the original one from a single observable variable. The reconstruction is done bytime delay embedding (or related methods). From single variable X we obtain vectors in m-dimensional phase space: x i = (X i ,X i+τ¿ ,X i+2τ , ...,X i+(m−1)τ ) , τ is the time delay, m is theembedding dimension. Since we have only limited amount of data, the proper choice of m <strong>and</strong> τ iscrucial for the good reconstruction. The irregular nonperiodic time series that are neverthelessdeterministic <strong>and</strong> are just slightly predictable are called chaotic time series. Two main propertiesof chaotic systems are self-similarity <strong>and</strong> sensitive dependence on initial conditions. Thesefeatures can be treated by computing correlation dimension D 2 <strong>and</strong> Lyapunov exponent λ.69
<strong>Measurement</strong> in Biomedicine • K. ŠušmákováFirst attempts to apply variables from nonlinear theory to <strong>EEG</strong> appeared after publication of theGrassberger-Procaccia algorithm (GPA) for computing the correlation dimension D 2 . D 2 is ameasure of a complexity of the system. For deterministic systems D 2 reaches finite values(suffcient embedding dimension must be specified), especially for chaotic systems it is nonintegervalue <strong>and</strong> for stochastic systems it is determined as high as the embedding dimension m. Thefinite estimate of D 2 determines the number of effective degrees of freedom of the deterministicdynamical system. GPA is based on computation of the correlation sum [38]:2C ( ε ) =( N)(N −1)2 ∑∑NNi= 0 j>iΘ(ε −x i− x j)(4)where x i , x j are vectors in the phase space, N is the number of vectors <strong>and</strong> Θ(ε−||x i − x j| |))| is theHeaviside function, which is equal one if the pair of vectors x i , x j are less than a geometricaldistance ε <strong>and</strong> zero otherwise. D 2 is defined as:D2ln C2( ε )= lim limε →0N →∞ln( ε )(5)C 2 is computed for several values of embedding dimension m. For deterministic signals C 2 (ε)shows a power-law behavior, so if we take the local slope of ln C2 against ln ε, then the value ofthe plateau is taken as the estimate of D 2 . In the case of <strong>EEG</strong> there are some factors whichinfluence the exactness of the result: the number of the data, the signal to noise ratio <strong>and</strong> thestationarity of the data. It is necessary to find a compromise of the data size, which is of sufficientlength, but the stationarity can be assumed. Another characteristic, often used in analyses ofphysiological data, is the largest Lyapunov exponent λ - the measure of the exponentialdivergence of trajectories in the phase space [38]:δ≅ δλn 0e ∆n∆(6)where δ 0 is the beginning distance between two close trajectories in the phase space <strong>and</strong> δ ∆n is thisdistance after ∆n time steps. Positive value of λ implies the presence of chaos behind the timeseries. Likewise as D 2 , the precise value of λ is not easy to compute for <strong>EEG</strong>, there are the samesources of problems, including stationarity level <strong>and</strong> noise corruption.In 1985, Babloyantz et al. [39] predicted the existence of the low-dimensional chaotic attractor inthe sleep Stages 2 <strong>and</strong> 4 (for Stage 2, D 2 = 5.03, for Stage 4 D 2 = 4.05, λ ∈ (0.3, 0.8)). Otherresults also conclude that D 2 in sleep are smaller than in awake <strong>EEG</strong>. D 2 seems to be highest inREM sleep <strong>and</strong> smallest in the Stage 4 [40, 41]. Similarly, the deeper the sleep, the lower thevalues of λ [42]. However, the finite estimates of D 2 of <strong>EEG</strong> were received with skepticism bymany researchers from the area of nonlinear dynamics [41]. They pointed to some crucial detailsof the algorithm <strong>and</strong> assumptions, which may not hold (e.g. stationarity, the sufficient data size,proper embedding). Theiler et al. [43] have demonstrated that also for time series with insufficientlength from autocorrelated Gaussian noise GPA gives spurious estimations of D 2 <strong>and</strong> proposed toomit those pairs of vectors which are closer than autocorrelation time. The re-examination of theprevious results using this correction [44] showed that the low-dimensional estimate of D 2 in <strong>EEG</strong>was the artefact of the temporal autocorrelation.Another approach to investigate the nonlinear nature of signals is to compare them with surrogatedata. Surrogate data are created by preserving one discriminatory property, while other properties70
MEASUREMENT SCIENCE REVIEW, Volume 4, Section 2, 2004are changed. It is a statistical test that aims at finding out whether the data from different classesof processes could give similar values of the chosen property [41]. If the nonlinearity of the signalis assumed, the null hypothesis is stated that it is linear stochastic process <strong>and</strong> a set of stochasticsurrogate data is made. If the value of computed property of the original signal is significantlydifferent from the values of surrogates, the null hypothesis can be rejected. In opposite case it ispossible to look for a new discriminatory property. More information about surrogate data methodcan be find in [45, 41, 38]. In testing the surrogate data, D 2 does not appear to be the bestdiscriminatory measure to distinguish between deterministic <strong>and</strong> stochastic nature of <strong>EEG</strong> [41].Pereda et al. [46] have computed the fractal exponent β <strong>and</strong> the D 2 of sleep Stages using surrogatedata in order to reveal whether finite estimates of D 2 are due to the nonlinear character of <strong>EEG</strong>, orwhether <strong>EEG</strong> is better described as linearly-correlated noise. The power spectra of stochasticprocesses show the power-low decrease with frequency (1/f β ). Following their results, only SWSdisplays nonlinear structure (D 2 of original <strong>EEG</strong> differs significantly from surrogate data), <strong>EEG</strong>spectra of the Stages 1, 2 <strong>and</strong> REM sleep show a frequency power-low dependence 1/f β with βbetween 1 <strong>and</strong> 3. For β holds the more complex signal the lower value of β. Between β <strong>and</strong> D 2there is a negative linear relationship in Stages I, II, REM <strong>and</strong> in wakefulness. Both indexesestimate the complexity of signal, however β is preferable to D 2 due to its less time dem<strong>and</strong>ingcomputation.Olbrich et al. [47] used autoregressive modeling of <strong>EEG</strong> during sleep <strong>and</strong> surrogate testing. Thenull hypothesis of linearly correlated noise has to be rejected if less than 2 % of segments havelength of 1s for every Stage of sleep. As a consequence of nonstationarity, the percentage ofrejection rose with the length of segments.For detection of mutual relationship between more signals nonlinear methods can be used as well.Pereda et al. [48] have applied multivariate nonlinear time series analysis to investigate theinterdependencies between channels C3/A2 <strong>and</strong> C4/A1 during all sleep Stages. The results werevery sensitive to used parameters, the significance of results were checked by surrogate data.According to their results the interdependencies between these channels increased with depth ofsleep <strong>and</strong> were mostly of linear type.The question whether <strong>EEG</strong> is deterministic or chaotic is still open, although the chance that theprocess behind <strong>EEG</strong> is low-deterministic is small. However, nonlinear measures could bebeneficial in effort to find appropriate variables for characterizing <strong>and</strong> describing variouspsychophysiological states of the brain. Today we do not expect that the values of D 2 will tell usthe number of differential equations needed to describe the dynamical system. D 2 is interpreted asa measure of the system ”complexity”.Fell, Röschke et al. [49] used several spectral <strong>and</strong> nonlinear measures in order to find the 12 bestvariables for discriminating the sleep Stages. The best discrimination is achieved with thecombination of spectral entropy, λ, entropy of amplitudes, D 2 <strong>and</strong> spectral edge. If the number ofvariables is limited to 2 or 3, the lowest error is obtained by combining λ, entropy of amplitudes<strong>and</strong> D 2 . Complexity measures related to the concept of entropy rates estimation were reported byRosipal [50] as appropriate indicators in classification of brain states. This suggests that nonlinearmeasures may offer additional information about the brain state.71
<strong>Measurement</strong> in Biomedicine • K. Šušmáková5. Conclusion<strong>Sleep</strong> is traditionally classified into sleep Stages that are scored after a system of rules ofRechtschaffen <strong>and</strong> Kales (RKS). It is based on wave patterns <strong>and</strong> characteristics ofpolysomnographic recordings. RKS has been used from 1968 <strong>and</strong> became the basic method forvisual sleep analysis.In current research, big effort is spent on developing new systems suitable for automated scoringof sleep Stages. Many variables are tested for describing subtle changes in psychophysiologicalstate of the brain. In the community of <strong>EEG</strong> researchers there are supporters of classical spectralmethods <strong>and</strong> also their opponents from nonlinear group. It is unlikely that <strong>EEG</strong> can be regarded asstemming from a purely deterministic system, although brain certainly must contain deterministicfeatures. In spite of some unresolved problems, the new nonlinear measure seems to besuccessful, if the main dem<strong>and</strong> is to distinguish between normal <strong>and</strong> pathological states. In thiseffort the simultaneous usage of linear <strong>and</strong> nonlinear approaches appears to be more powerfulthan preferring only one of them.AcknowledgementThis work was supported by Slovak Grant Agency for <strong>Science</strong> (grant No 2/4026/04).References[1] P. N. Prinz, L. H. Larsen, K. E. Moe, <strong>and</strong> M. V. Vitiello. <strong>EEG</strong> markers of earlyAlzheimer’s disease in computer selected tonic REM sleep. Electroencephalogr. Clin.Neurophysiol., 83:36–43, 1992.[2] A.L. Loomis, E.N. Harvey, <strong>and</strong> G.A Hobart. Cerebral States During <strong>Sleep</strong>, as Studiedby <strong>Human</strong> Brain Potentials. J. Exp. Psychol., 21:127–144, 1937.[3] E. Aserinsky <strong>and</strong> N. Kleitman. Regularly Occuring Periods of Eye Motility, <strong>and</strong>Concomitant Phenomena, During <strong>Sleep</strong>. <strong>Science</strong>, 118:273–274, 1953.[4] W.C. Dement <strong>and</strong> N. Kleitman. Cyclic Variations in <strong>EEG</strong> During <strong>Sleep</strong> <strong>and</strong> theirRelation to Eye Movements. Body Motility <strong>and</strong> Dreaming. Electroencephalogr. Clin.Neurophysiol., 9:673–390, 1957.[5] M. Teplan. Fundamentals of <strong>EEG</strong> measurement. <strong>Measurement</strong> <strong>Science</strong> <strong>Review</strong>, 2:1–11,2002.[6] A. Rechtschaffen, A. Kales, <strong>and</strong> (Eds.). A Manual of St<strong>and</strong>ardized Terminology,Techniques <strong>and</strong> Scoring System for <strong>Sleep</strong> Stages of <strong>Human</strong> Subject. US GovernmentPrinting Office, National Institute of Health Publication, Washington DC, 1968.[7] S.-L. Himanen. A New Visual Adaptive Scoring System for <strong>Sleep</strong> Recordings.Electronic dissertation, Acta Electronica Universitatis Tamperensis, 61, 2000.[8] M. G. Terzano, L. Parrino, <strong>and</strong> M. C Spaggiari. The cyclic alternating pattern sequencesin the dynamic organisation of sleep. Electroencephalogr. Clin. Neurophysiol., 69:437–447, 1988.[9] M. G. Terzano et al. Altas, rules, <strong>and</strong> recording techniques for the scoring of cyclicalternating pattern (CAP) in human sleep. <strong>Sleep</strong> Medicine, 2:537–553, 2001.[10] P. Halász, M. G. Terzano, L. Parrino, <strong>and</strong> R. Bódisz. The nature of arousal in sleep.J.<strong>Sleep</strong> Res., 13:1–23, 2004.72
MEASUREMENT SCIENCE REVIEW, Volume 4, Section 2, 2004[11] K. Sakai <strong>and</strong> S. Crochet. A neural mechanism of sleep <strong>and</strong> wakefulness. <strong>Sleep</strong> <strong>and</strong>Biological Rhythms, 1:29–42, 2003.[12] WWW. <strong>Sleep</strong> Study URL: http://www.sleepstudy.org.[13] H. L. Atwood <strong>and</strong> W. A. MacKay. Essentials of Neurophysiology. B.C. Decker Inc,1989.[14] S. Nevšímalová, K. Šonka, et al. Poruchy spánku a bdění. Maxdorf/Jessenius, Praha,1997.[15] J. Horne. The Phenomena of <strong>Human</strong> <strong>Sleep</strong>. Karger Gazette, 1997.[16] A. Rechtschaffen <strong>and</strong> J. M. Siegel. <strong>Sleep</strong> <strong>and</strong> Dreaming. In: Principles of Neuroscience.Edited by E. R. K<strong>and</strong>el, J. H. Swartz <strong>and</strong> T. M. Jessel. McGraw-Hill, New York, 2000.[17] Zi-Jian Cai. The Function of <strong>Sleep</strong>: Further Analysis. Physiology Behavior, 50:53–60,1989.[18] R. Stickgold. <strong>Sleep</strong>: off-line memory reprocessing. Trends in Cognitive <strong>Science</strong>s, 2, No.12:484–492, 1998.[19] R. Stickgold, James L. T., <strong>and</strong> J. A. Hobson. Visual discrimination learning requiressleep after training. Nature Neurosci., 3:1237–1238, 2000.[20] R. Huber, Ghilardi M.F., M. Massimini, <strong>and</strong> G. Tononi. Local sleep <strong>and</strong> learning.Nature, 430 (6995):78–81, 2004.[21] Gary S. Richardson, Mary A. Carskadon, et al. Excessive Daytime <strong>Sleep</strong>iness in Man:Multiple <strong>Sleep</strong> Latency <strong>Measurement</strong> in Narcoleptic <strong>and</strong> Control Subjects .Electroncephalogr. Clin. Neurophysiol., 45:621–627, 1978.[22] K. Doghramnji, M. Mitler, et al. A Normative Study of the Maintenance of WakefulnessTest (MWT). Electroncephalogr. Clin. Neurophysiol., 103:554–562, 1997.[23] S. Daan, D. G. M. Beersma, <strong>and</strong> A. A. Borb´ely. Timing of human sleep: recoveryprocess gated by a circadian pacemaker. Am. J. Physiol., 246:161–178, 1984.[24] Ch. Cajochen <strong>and</strong> D. J. Dijk. Electroencephalographic activity during wakefulness, rapideye movement <strong>and</strong> non-rapid eye movement sleep in humans: Comparison of theircircadian <strong>and</strong> homeostatic modulation. <strong>Sleep</strong> <strong>and</strong> Biological Rhythms, 1:85–95, 2003.[25] S. Roberts <strong>and</strong> L. Tarassenko. New method of automated sleep quantification. Med.Biol. Eng. Comput., 30:509–517, 1992.[26] E. Oropesa, H. Cycon, <strong>and</strong> M. Jobert. <strong>Sleep</strong> Stage Classification using WaveletTransform <strong>and</strong> Neural Network. Technical Report, 8, 1999.[27] P.J. Durka, R. Ksiyk, <strong>and</strong> K.J. Blinowska. Neural networks <strong>and</strong> wavelet analysis in <strong>EEG</strong>artefact recognition. II Konferencja Sieci Neuronowe i Ich Zastosowania, Szczyrk, page1996, 1999.[28] P. Achermann <strong>and</strong> A. A. Borbély. Mathematical Models of <strong>Sleep</strong> Regulation. Frontiersin Bioscience, 8:683–693, 2003.[29] A. A. Borbély, F. Baumann, D. Br<strong>and</strong>eis, I. Strauch, <strong>and</strong> D. Lehmann. <strong>Sleep</strong>Deprivation: Effect on <strong>Sleep</strong> Stages <strong>and</strong> <strong>EEG</strong> Power Density in Man.Electroencephalogr. Clin. Neurophysiol., 51:483–493, 1981.[30] W. H. Press et al. Numerical Recipes in C. Cambridge University Press, 1988.[31] A. S. Gevins <strong>and</strong> A. Rémond. H<strong>and</strong>book of Electroencephalography <strong>and</strong> clinicalNeurophysiology. Methods of Analysis of Brain Electrical <strong>and</strong> Magnetic Signals.Elsevier, Amsterdam, 1987.[32] G. Dumermuth <strong>and</strong> D. Lehmann. <strong>EEG</strong> Power <strong>and</strong> Coherence during Non-REM <strong>and</strong>REM Phases in <strong>Human</strong>s in All-Night <strong>Sleep</strong> Analyses. 1981.[33] G. Dumermuth, B Lange, D. Lehmann, et al. Spectral Analysis of All-Nigth <strong>Sleep</strong> <strong>EEG</strong>in Healthy Adults. European Neurology, 22:322–339, 1983.[34] P. Achermann <strong>and</strong> A. A. Borbély. Coherence analysis of the human sleepelectroencephalogram. Neuroscience, 85:1195–1208, 1998.73
<strong>Measurement</strong> in Biomedicine • K. Šušmáková[35] H. Merica <strong>and</strong> R. Blois. Relationship between the time courses of power in thefrequency b<strong>and</strong>s of human sleep <strong>EEG</strong>. Neurophysiol Clin, 27:116–128, 1997.[36] R. Ferri, M. Elia, S. A. Musumeci, <strong>and</strong> S. Pettinato. The time course of frequency b<strong>and</strong>s(15-45 Hz) in all-night spectral analysis of sleep <strong>EEG</strong>. Clinical Neurophysiology,111:1258– 1265, 2000.[37] F. Takens. Detecting strange attractors in fluid turbulence. In D. R<strong>and</strong> <strong>and</strong> L.S. Young,editors, Dynamical systems <strong>and</strong> turbulence. Springer, Berlin, 1981.[38] H. Kantz <strong>and</strong> Schreiber T. Nonlinear Time Series Analyses. Cambridge UniversityPress, 1997.[39] A. Babloyantz <strong>and</strong> J. M. Salazar. Evidence of Chaotic Dynamics of Brain ActivityDuring the <strong>Sleep</strong> Cycle. Phys. Lett. A, 111:152–156, 1985.[40] T. Kobayashi, K. Misaki, et al. Non-linear analysis of the sleep <strong>EEG</strong>. Psychiatry <strong>and</strong>Clinical Neurosciences, 53:159–162, 1999.[41] Galka A. Topics in Nonlinear Time Series Analysis. World Scientific, 2000.[42] J. Röschke, J. Fell, <strong>and</strong> P. Beckmann. The calculation of the first positive Lyapunovexponent in sleep <strong>EEG</strong> data. Electroencephalogr. Clin. Neurophysiol., 86:348–352,1993.[43] J. Theiler. Spurious dimension from correlation algorithms applied to limited time-seriesdata. Phys. Rev. A, 34:2427–2432, 1986.[44] J. Theiler <strong>and</strong> P. E. Rapp. Re-examination of the evidence for low-dimensional,nonlinear structure in the human electroencephalogram. Electroencephalogr. Clin.Neurophysiol., 98:213–222, 1996.[45] T. Schreiber <strong>and</strong> A. Schmitz. Surrogate time series. Physica D, 142:346–382, 2000.[46] E. Pereda, A. Gamundi, R. Rial, <strong>and</strong> J. González. Non-linear behaviour of human <strong>EEG</strong>:fractal exponent versus correlation dimension in awake <strong>and</strong> sleep stages. NeuroscienceLetters, 250:91–9, 1998.[47] E. Olbrich, P. Achermann, <strong>and</strong> P. F. Meier. Dynamics of human sleep <strong>EEG</strong>.Neurocomputing, 52-54:857–862, 2003.[48] E. Pereda, R. Rial, Gamundi A., <strong>and</strong> J. Gonzáles. Assessment of changinginterdependencies between human electroencephalograms using nonlinear methods.Physica D, 148:147–158, 2001.[49] J. Fell, J. Röschke, K. Mann, <strong>and</strong> C. Schaffner. Discrimination of sleep stages: acomparison between spectral <strong>and</strong> nonlinear <strong>EEG</strong> measures. Electroencephalogr. Clin.Neurophysiol., 98:401–410, 1996.[50] R. Rosipal. Kernel-Based Regression <strong>and</strong> Objective Nonlinear Measures to Assess BrainFunctionnig, PhD thesis. University of Paisley, Scotl<strong>and</strong>, 2001.74