Evolution and Biodiversity Laboratory Systematics and Taxonomy
Evolution and Biodiversity Laboratory Systematics and Taxonomy
Evolution and Biodiversity Laboratory Systematics and Taxonomy

You also want an ePaper? Increase the reach of your titles
YUMPU automatically turns print PDFs into web optimized ePapers that Google loves.
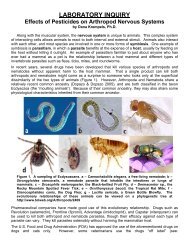
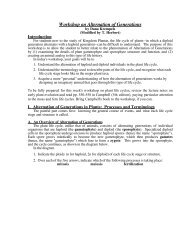
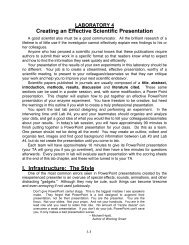
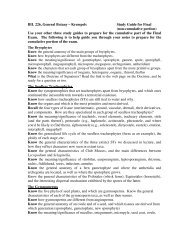
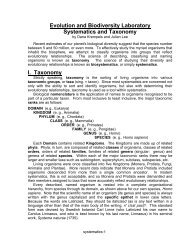
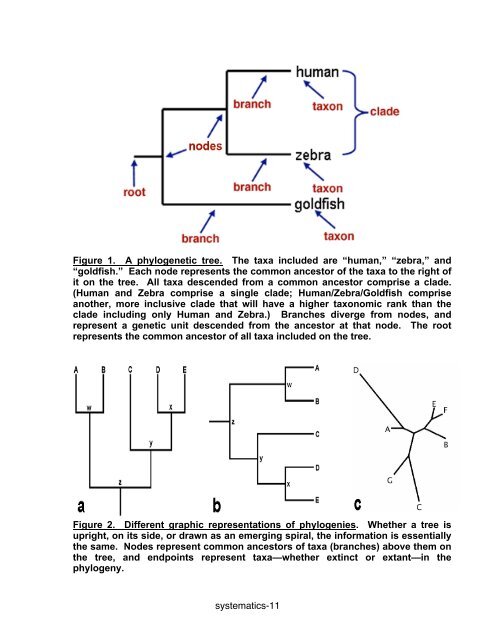
Figure 1. A phylogenetic tree. The taxa included are “human,” “zebra,” <strong>and</strong>“goldfish.” Each node represents the common ancestor of the taxa to the right ofit on the tree. All taxa descended from a common ancestor comprise a clade.(Human <strong>and</strong> Zebra comprise a single clade; Human/Zebra/Goldfish compriseanother, more inclusive clade that will have a higher taxonomic rank than theclade including only Human <strong>and</strong> Zebra.) Branches diverge from nodes, <strong>and</strong>represent a genetic unit descended from the ancestor at that node. The rootrepresents the common ancestor of all taxa included on the tree.Figure 2. Different graphic representations of phylogenies. Whether a tree isupright, on its side, or drawn as an emerging spiral, the information is essentiallythe same. Nodes represent common ancestors of taxa (branches) above them onthe tree, <strong>and</strong> endpoints represent taxa—whether extinct or extant—in thephylogeny.systematics-11