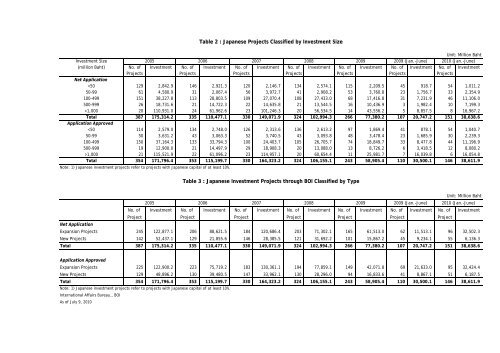
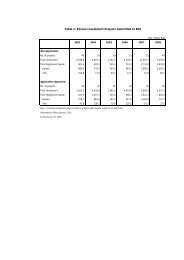
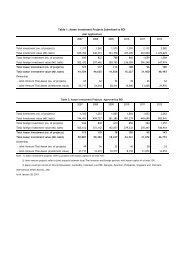
Table 2 : <strong>Japan</strong>ese Projects Classified by <strong>Investment</strong> SizeUnit: Million Baht<strong>Investment</strong> Size200520062007200820092009 (Jan.-June) 2010 (Jan.-June)(million Baht) No. <strong>of</strong> <strong>Investment</strong> No. <strong>of</strong> <strong>Investment</strong> No. <strong>of</strong> <strong>Investment</strong> No. <strong>of</strong> <strong>Investment</strong> No. <strong>of</strong> <strong>Investment</strong> No. <strong>of</strong> <strong>Investment</strong> No. <strong>of</strong> <strong>Investment</strong>Projects Projects Projects Projects Projects Projects ProjectsNet Application1,000 20 110,931.0 24 61,962.6 23 101,246.3 20 56,534.5 14 43,556.2 5 8,857.5 8 16,967.2Total 387 175,314.2 335 110,477.1 330 149,071.9 324 102,994.3 266 77,380.2 107 20,747.2 151 38,638.6Application Approved1,000 21 115,521.9 22 61,096.2 23 114,957.1 20 60,654.4 11 25,981.7 7 16,039.8 6 16,054.8Total 354 171,796.4 353 115,199.7 330 164,323.2 324 106,155.1 243 58,905.4 110 30,500.1 146 38,611.9Note: 1) <strong>Japan</strong>ese investment projects refer to projects with <strong>Japan</strong>ese capital <strong>of</strong> at least 10%.Table 3 : <strong>Japan</strong>ese <strong>Investment</strong> Projects through BOI Classified by TypeUnit: Million Baht200520062007200820092009 (Jan.-June) 2010 (Jan.-June)No. <strong>of</strong> <strong>Investment</strong> No. <strong>of</strong> <strong>Investment</strong> No. <strong>of</strong> <strong>Investment</strong> No. <strong>of</strong> <strong>Investment</strong> No. <strong>of</strong> <strong>Investment</strong> No. <strong>of</strong> <strong>Investment</strong> No. <strong>of</strong> <strong>Investment</strong>Project Project Project Project Project Project ProjectNet ApplicationExpansion Projects 245 122,877.1 206 88,621.5 184 120,686.4 203 71,302.1 165 61,513.0 62 11,513.1 96 32,502.3New Projects 142 52,437.1 129 21,855.6 146 28,385.5 121 31,692.2 101 15,867.2 45 9,234.1 55 6,136.3Total 387 175,314.2 335 110,477.1 330 149,071.9 324 102,994.3 266 77,380.2 107 20,747.2 151 38,638.6Application ApprovedExpansion Projects 225 122,900.2 223 75,719.2 183 130,361.1 194 77,859.1 149 42,071.8 69 21,633.0 95 32,424.4New Projects 129 48,896.2 130 39,480.5 147 33,962.1 130 28,296.0 94 16,833.6 41 8,867.1 51 6,187.5Total 354 171,796.4 353 115,199.7 330 164,323.2 324 106,155.1 243 58,905.4 110 30,500.1 146 38,611.9Note: 1) <strong>Japan</strong>ese investment projects refer to projects with <strong>Japan</strong>ese capital <strong>of</strong> at least 10%.International Affairs Bureau., BOIAs <strong>of</strong> July 9, 2010
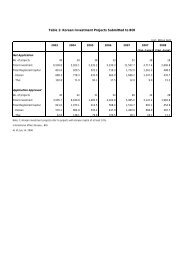
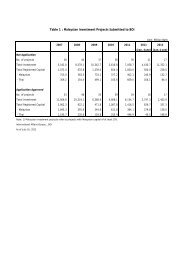
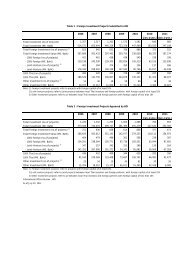
Table 4 : <strong>Japan</strong>ese <strong>Investment</strong> Projects Applying for Promotion Classified by SectorUnit: Million BahtYear200520062007200820092009 (Jan.-June) 2010 (Jan.-June)Sector No. <strong>of</strong> <strong>Investment</strong> No. <strong>of</strong> <strong>Investment</strong> No. <strong>of</strong> <strong>Investment</strong> No. <strong>of</strong> <strong>Investment</strong> No. <strong>of</strong> <strong>Investment</strong> No. <strong>of</strong> <strong>Investment</strong> No. <strong>of</strong> <strong>Investment</strong>Projects Projects Projects Projects Projects Projects ProjectsAgricultural Products 9 4,146.2 7 3,019.9 14 3,998.6 12 10,628.0 15 5,928.1 5 2,451.9 9 2,909.5Minerals and Ceramics 13 3,843.8 10 15,487.3 11 5,001.9 12 6,740.1 2 600.1 2 310.6 3 802.5Light Industries/Textiles 9 2,288.2 9 2,459.1 10 1,253.3 11 3,394.3 12 1,078.8 5 275.2 1 68.0Metal Products and Machinery 167 128,111.6 132 36,478.5 121 88,439.6 128 56,805.3 100 16,667.2 44 9,781.1 63 17,032.0Electric and Electronic Products 82 21,529.7 72 35,355.7 51 21,156.3 53 15,284.9 49 36,179.4 16 2,051.4 31 9,872.9Chemicals and Paper 49 9,016.5 32 8,375.4 47 20,638.7 37 5,497.9 26 6,841.2 10 3,095.8 19 4,843.0Services 58 6,378.2 73 9,301.2 76 8,583.5 71 4,643.8 62 10,085.4 25 2,781.2 25 3,110.7Total 387 175,314.2 335 110,477.1 330 149,071.9 324 102,994.3 266 77,380.2 107 20,747.2 151 38,638.6Note: 1) <strong>Japan</strong>ese investment projects refer to projects with <strong>Japan</strong>ese capital <strong>of</strong> at least 10%.Table 5 : <strong>Japan</strong>ese <strong>Investment</strong> Projects Approved by BOI Classified by SectorUnit: Million BahtYear200520062007200820092009 (Jan.-June) 2010 (Jan.-June)Sector No. <strong>of</strong> <strong>Investment</strong> No. <strong>of</strong> <strong>Investment</strong> No. <strong>of</strong> <strong>Investment</strong> No. <strong>of</strong> <strong>Investment</strong> No. <strong>of</strong> <strong>Investment</strong> No. <strong>of</strong> <strong>Investment</strong> No. <strong>of</strong> <strong>Investment</strong>Projects Projects Projects Projects Projects Projects ProjectsAgricultural Products 11 3,787.2 6 1,585.0 12 5,498.9 14 4,800.2 12 10,166.8 3 7,102.8 7 2,898.3Minerals and Ceramics 11 2,693.4 9 1,527.4 10 17,355.3 15 8,441.0 6 2,813.5 5 2,213.5 2 340.5Light Industries/Textiles 10 2,202.1 9 1,671.2 11 2,147.1 10 3,416.7 8 1,234.4 4 522.1 4 305.8Metal Products and Machinery 145 127,119.0 160 45,359.8 118 77,071.9 120 64,189.2 98 19,756.3 47 12,876.7 56 13,071.3Electric and Electronic Products 73 20,131.3 69 33,515.9 59 32,111.1 49 14,271.2 38 15,874.1 18 3,670.0 34 12,710.0Chemicals and Paper 48 11,851.2 38 26,129.6 44 18,683.2 39 7,257.9 23 5,174.0 9 1,063.2 18 3,054.5Services 56 4,012.2 62 5,410.8 76 11,455.7 77 3,778.9 58 3,886.3 24 3,051.8 25 6,231.5Total 354 171,796.4 353 115,199.7 330 164,323.2 324 106,155.1 243 58,905.4 110 30,500.1 146 38,611.9Note: 1) <strong>Japan</strong>ese investment projects refer to projects with <strong>Japan</strong>ese capital <strong>of</strong> at least 10%.International Affairs Bureau., BOIAs <strong>of</strong> July 9, 2010