Japan - The Board of Investment of Thailand
Japan - The Board of Investment of Thailand
Japan - The Board of Investment of Thailand

You also want an ePaper? Increase the reach of your titles
YUMPU automatically turns print PDFs into web optimized ePapers that Google loves.
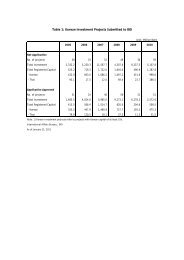
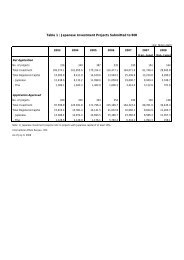
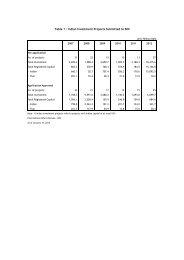
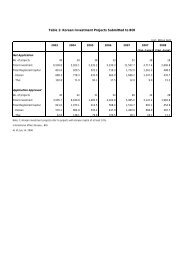
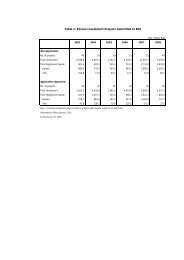
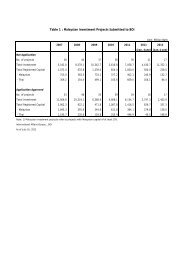
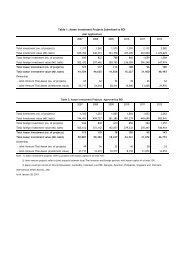
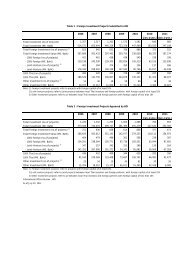
Table 7 : <strong>Japan</strong>ese <strong>Investment</strong> Projects through BOI Classified by Factory LocationUnit: Million BahtYear200520062007200820092009 (Jan.-June) 2010 (Jan.-June)Location No. <strong>of</strong> <strong>Investment</strong> No. <strong>of</strong> <strong>Investment</strong> No. <strong>of</strong> <strong>Investment</strong> No. <strong>of</strong> <strong>Investment</strong> No. <strong>of</strong> <strong>Investment</strong> No. <strong>of</strong> <strong>Investment</strong> No. <strong>of</strong> <strong>Investment</strong>Project Project Project Project Project Project ProjectNet ApplicationZone 1 101 43,516.4 102 23,660.6 117 18,816.8 99 9,521.8 82 27,684.8 31 3,228.8 43 3,261.8Zone 2 242 118,309.6 184 71,262.8 181 123,674.7 186 84,737.9 150 43,429.0 59 14,959.4 91 32,103.2Zone 3 44 13,488.2 49 15,553.7 32 6,580.4 39 8,734.6 34 6,266.4 17 2,559.0 17 3,273.6Total 387 175,314.2 335 110,477.1 330 149,071.9 324 102,994.3 266 77,380.2 107 20,747.2 151 38,638.6Application ApprovedZone 1 85 39,661.0 99 20,503.5 109 29,023.6 103 7,375.0 70 9,607.1 26 1,632.2 47 6,902.5Zone 2 227 120,115.4 210 81,124.9 174 124,601.2 191 91,398.3 144 44,140.5 68 26,771.8 80 28,279.6Zone 3 42 12,020.0 44 13,571.3 47 10,698.4 30 7,381.8 29 5,157.8 16 2,096.1 19 3,429.8Total 354 171,796.4 353 115,199.7 330 164,323.2 324 106,155.1 243 58,905.4 110 30,500.1 146 38,611.9Note: 1) <strong>Japan</strong>ese investment projects refer to projects with <strong>Japan</strong>ese capital <strong>of</strong> at least 10%.Table 8: <strong>Japan</strong>ese Export-Oriented <strong>Investment</strong> Projects through BOIUnit: Million Baht200520062007200820092009 (Jan.-June)2010 (Jan.-June)No. <strong>of</strong> <strong>Investment</strong> No. <strong>of</strong> <strong>Investment</strong> No. <strong>of</strong> <strong>Investment</strong> No. <strong>of</strong> <strong>Investment</strong> No. <strong>of</strong> <strong>Investment</strong> No. <strong>of</strong> <strong>Investment</strong> No. <strong>of</strong> <strong>Investment</strong>Project Project Project Project Project Project ProjectNet ApplicationExport >= 80% 106 41,259.9 100 46,365.8 85 57,852.0 77 39,488.5 70 42,164.7 29 7,443.5 44 9,295.8Total 387 175,314.2 335 110,477.1 330 149,071.9 324 102,994.3 266 77,380.2 107 20,747.2 151 38,638.6Application ApprovedExport >= 80% 134 73,516.9 121 58,018.1 92 60,508.3 91 52,890.4 73 26,067.0 33 8,303.0 42 12,720.4Total 354 171,496.4 353 115,199.7 330 164,323.2 324 106,155.1 243 58,905.4 110 30,500.1 146 38,611.9Note: 1) <strong>Japan</strong>ese investment projects refer to projects with <strong>Japan</strong>ese capital <strong>of</strong> at least 10%.International Affairs Bureau., BOIAs <strong>of</strong> July 9, 2010