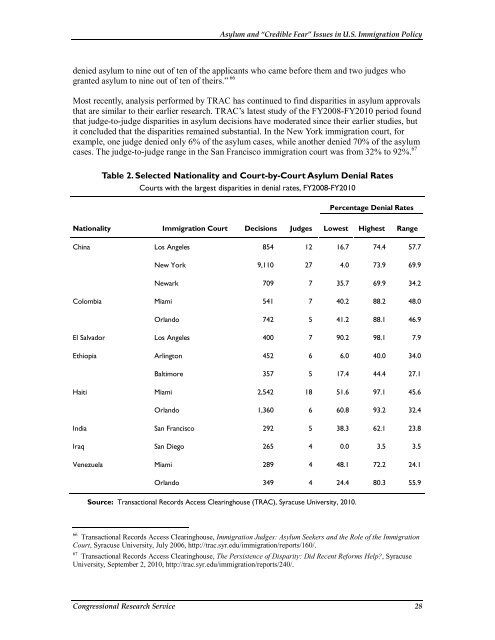
<strong>Asylum</strong> <strong>and</strong> “<strong>Credible</strong> Fear” <strong>Issues</strong> <strong>in</strong> U.S. <strong>Immigration</strong> <strong>Policy</strong>denied asylum to n<strong>in</strong>e out of ten of the applicants who came before them <strong>and</strong> two judges whogranted asylum to n<strong>in</strong>e out of ten of theirs.” 66Most recently, analysis performed by TRAC has cont<strong>in</strong>ued to f<strong>in</strong>d disparities <strong>in</strong> asylum approvalsthat are similar to their earlier research. TRAC’s latest study of the FY2008-FY2010 period foundthat judge-to-judge disparities <strong>in</strong> asylum decisions have moderated s<strong>in</strong>ce their earlier studies, butit concluded that the disparities rema<strong>in</strong>ed substantial. In the New York immigration court, forexample, one judge denied only 6% of the asylum cases, while another denied 70% of the asylumcases. The judge-to-judge range <strong>in</strong> the San Francisco immigration court was from 32% to 92%. 67Table 2. Selected Nationality <strong>and</strong> Court-by-Court <strong>Asylum</strong> Denial RatesCourts with the largest disparities <strong>in</strong> denial rates, FY2008-FY2010Percentage Denial RatesNationality <strong>Immigration</strong> Court Decisions Judges Lowest Highest RangeCh<strong>in</strong>a Los Angeles 854 12 16.7 74.4 57.7New York 9,110 27 4.0 73.9 69.9Newark 709 7 35.7 69.9 34.2Colombia Miami 541 7 40.2 88.2 48.0Orl<strong>and</strong>o 742 5 41.2 88.1 46.9El Salvador Los Angeles 400 7 90.2 98.1 7.9Ethiopia Arl<strong>in</strong>gton 452 6 6.0 40.0 34.0Baltimore 357 5 17.4 44.4 27.1Haiti Miami 2,542 18 51.6 97.1 45.6Orl<strong>and</strong>o 1,360 6 60.8 93.2 32.4India San Francisco 292 5 38.3 62.1 23.8Iraq San Diego 265 4 0.0 3.5 3.5Venezuela Miami 289 4 48.1 72.2 24.1Orl<strong>and</strong>o 349 4 24.4 80.3 55.9Source: Transactional Records Access Clear<strong>in</strong>ghouse (TRAC), Syracuse University, 2010.66 Transactional Records Access Clear<strong>in</strong>ghouse, <strong>Immigration</strong> Judges: <strong>Asylum</strong> Seekers <strong>and</strong> the Role of the <strong>Immigration</strong>Court, Syracuse University, July 2006, http://trac.syr.edu/immigration/reports/160/.67 Transactional Records Access Clear<strong>in</strong>ghouse, The Persistence of Disparity: Did Recent Reforms Help?, SyracuseUniversity, September 2, 2010, http://trac.syr.edu/immigration/reports/240/.Congressional Research Service 28
<strong>Asylum</strong> <strong>and</strong> “<strong>Credible</strong> Fear” <strong>Issues</strong> <strong>in</strong> U.S. <strong>Immigration</strong> <strong>Policy</strong>Notes: In order to be <strong>in</strong>cluded <strong>in</strong> this TRAC analysis, the court had to have at least four judges who made 50 ormore asylum decisions <strong>in</strong> each time period.The disparities were also evident when immigration court decisions were analyzed by the asylumseeker’s country of orig<strong>in</strong>. As Table 2 <strong>in</strong>dicates, TRAC analysis of decisions on PRC asylumseekers cont<strong>in</strong>ued to show wide disparities <strong>in</strong> the New York court, rang<strong>in</strong>g from 4% to 74%denial rates. The denial rates of Iraq asylum seekers were the lowest, spann<strong>in</strong>g from zero to 4%,<strong>and</strong> their variation was also the lowest at 4%. In contrast, the denial rates of Salvadoran asylumseekers were the highest, spann<strong>in</strong>g 90% to 98%, with only a 8% variation. 68Selected <strong>Issues</strong>Although there are many who would revise U.S. asylum law, those advocat<strong>in</strong>g change havedivergent perspectives. Some cite the seem<strong>in</strong>gly <strong>in</strong>explicable disparities <strong>in</strong> asylum approvals rates<strong>and</strong> urge broad-based adm<strong>in</strong>istrative reforms. Others argue that given the religious, ethnic, <strong>and</strong>political violence <strong>in</strong> various countries around the world, it has become more difficult todifferentiate the persecuted from the persecutors. Some express concern that U.S. sympathies forthe asylum seekers caught up <strong>in</strong> the current political upris<strong>in</strong>gs <strong>in</strong> the Middle East, northern Africa,<strong>and</strong> South Asia could <strong>in</strong>advertently facilitate the entry of terrorists. Others ma<strong>in</strong>ta<strong>in</strong> that currentlaw does not offer adequate protections for people flee<strong>in</strong>g human rights violations or genderbasedabuses that occur around the world. Some assert that asylum has become an alternativepathway for immigration rather than humanitarian protection provided <strong>in</strong> extraord<strong>in</strong>ary cases. Atthe crux of the issue is the extent to which an asylum policy forged dur<strong>in</strong>g the Cold War isadapt<strong>in</strong>g to the compet<strong>in</strong>g priorities <strong>and</strong> turbulence of the 21 st century. Some of these issues arehighlighted below.U.S. National InterestsSome have asserted that U.S. asylum policy attracts asylum seekers who have weak or bogusclaims <strong>and</strong> that additional safeguards are needed to curb abuses <strong>and</strong> protect U.S. national<strong>in</strong>terests. One critic has concluded that the “U.S. asylum system has become the hole <strong>in</strong> the fencefor millions of dubious claimants—<strong>and</strong> a major immigration magnet <strong>in</strong> itself.” Others havema<strong>in</strong>ta<strong>in</strong>ed that migration “push” factors, such as rapid population growth, poverty, <strong>and</strong> political<strong>in</strong>stability <strong>in</strong> the send<strong>in</strong>g countries of asylum seekers, are factors over which the United States haslittle control. Some have warned of “the ongo<strong>in</strong>g separation of asylum from any ground<strong>in</strong>g <strong>in</strong> thenational <strong>in</strong>terest” <strong>and</strong> argued for a serious exam<strong>in</strong>ation of the forces that propel asylum seekers. 69In contrast, others have asserted that the United States should re-calibrate asylum policy toprovide more protections for asylum seekers, ma<strong>in</strong>ta<strong>in</strong><strong>in</strong>g that it is <strong>in</strong> the United States’ national<strong>in</strong>terest to set an example. These proponents have expressed a desire for the United States toreaffirm its welcome to those who have fled persecution as well as its commitment tohumanitarian efforts. They have argued that some of the statutory revisions <strong>in</strong> 1996 <strong>and</strong> 200568 Ibid.69 David Simcox, Humanitarian <strong>Immigration</strong>: Third World “Persecution” Swamps the West, Negative PopulationGrowth, NPG Forum Paper, 2004, http://www.npg.org/forum_series/spr<strong>in</strong>g04fp.html; <strong>and</strong> Don Barnett, The Com<strong>in</strong>gConflict Over <strong>Asylum</strong>: Does America Need a New <strong>Asylum</strong> <strong>Policy</strong>?, Center for <strong>Immigration</strong> Studies, March 2002,http://www.cis.org/articles/2002/back102.html.Congressional Research Service 29