Iron, Phytoplankton Growth, and Carbon Cycle - Stanford School of ...
Iron, Phytoplankton Growth, and Carbon Cycle - Stanford School of ...
Iron, Phytoplankton Growth, and Carbon Cycle - Stanford School of ...

Create successful ePaper yourself
Turn your PDF publications into a flip-book with our unique Google optimized e-Paper software.
12 The Malverns, Cherry Orchard Lane, Salisbury SP2 7JG, U.K.Telephone: +44(0)1722 414282Facsimile: +44(0)1722 414288email: mail@techset.co.ukwebsite: www.techset.co.ukUse this as the cover page to fax corrections to your chapterDate:TO:Paul Beaneyfax: 44(0) 1722 414288email: pbeaney@techset.co.ukFROM: ...........................................................BOOK TITLE: Sigel: Metal Ions in Biological Systems, Volume 43 (ISBN 0-0000-0000-0)CHAPTER NUMBER: 07Author: Please list page numbers <strong>of</strong> pages requiring correction, <strong>and</strong> record answers toqueries <strong>and</strong> any special instructions here:Author: Please indicate the preferred mailing address for your complimentary copy <strong>of</strong> thefinished book <strong>and</strong> special promotions or discounts reserved for Dekker authors.International Publishing Services with <strong>of</strong>fices in Salisbury, London & ChennaiRegistered in Engl<strong>and</strong>, no. 2420700
0000-0-Sigel-ch07_R1_12100412345678910111213141516171819202122232425262728293031323334353637383940414243447<strong>Iron</strong>, <strong>Phytoplankton</strong> <strong>Growth</strong>,<strong>and</strong> the <strong>Carbon</strong> <strong>Cycle</strong>Joseph H. Street <strong>and</strong> Adina PaytanDepartment <strong>of</strong> Geological <strong>and</strong> Environmental Sciences, Braun Hall,<strong>Stanford</strong> University, <strong>Stanford</strong>, California, USA1. <strong>Iron</strong>, an Essential Nutrient for Marine Organisms 1541.1. <strong>Iron</strong> Function in Cells 1541.2. Cellular Uptake Mechanisms 1551.3. Chemical <strong>and</strong> Physical Limits on Uptake Rates 1561.4. Expression <strong>of</strong> Stress 1572. <strong>Iron</strong> Chemistry in Seawater 1582.1. Chemical Forms 1582.2. Speciation <strong>and</strong> Redox Chemistry 1592.3. Interaction with Organic Compounds 1593. <strong>Iron</strong> Distribution <strong>and</strong> Cycling in the Ocean 1603.1. External <strong>Iron</strong> Sources 1603.1.1. Atmospheric Dust Deposition 1603.1.2. River Input 1623.1.3. Hydrothermal Sources 1633.1.4. Mobilization in Sediments 1633.2. <strong>Iron</strong> Cycling in the Ocean 1643.2.1. Upwelling <strong>and</strong> Advection 1643.2.2. Biological Cycling, Export, <strong>and</strong> Regeneration 1653.2.3. Particle Scavenging 1663.3. Patterns in the Distribution <strong>of</strong> <strong>Iron</strong> in the Ocean 1663.3.1. Dissolved <strong>Iron</strong> in the Open Ocean 167153
0000-0-Sigel-ch07_R1_121004154 Street <strong>and</strong> Paytan45464748495051525354555657585960616263646566676869707172737475767778798081828384858687883.3.2. Dissolved <strong>Iron</strong> in the Coastal Ocean, ShallowSeas, <strong>and</strong> Semi-enclosed Basins 1693.3.3. Particulate <strong>Iron</strong> 1693.3.4. Suboxic/Anoxic Zones 1694. <strong>Iron</strong> Limitation <strong>of</strong> Marine Primary Productivity <strong>and</strong> Control onEcosystem Structure 1704.1. Evidence for the Role <strong>of</strong> <strong>Iron</strong> in Regulating Productivityin High Nutrient Low Chlorophyll Regions 1704.1.1. Bottle Incubation Experiments 1714.1.2. Mesoscale Enrichment Experiments 1734.1.3. Evidence <strong>of</strong> <strong>Iron</strong> Limitation from Other Regions 1764.2. Interaction <strong>of</strong> <strong>Iron</strong> with Other Limiting Factors 1774.3. <strong>Carbon</strong> Export <strong>and</strong> <strong>Iron</strong> Fertilization 1805. The Role <strong>of</strong> <strong>Iron</strong> in Regulating Atmospheric CO 2 1805.1. The <strong>Iron</strong> Hypothesis 1805.2. Changes in Dust Input <strong>and</strong> Productivity in Glacial Periods 1815.3. Consequences for Atmospheric CO 2 <strong>and</strong> Global Climate 1826. Summary <strong>and</strong> Conclusions 183Acknowledgments 184Abbreviations 184References 1851. IRON, AN ESSENTIAL NUTRIENT FOR MARINE ORGANISMS1.1. <strong>Iron</strong> Function in Cells<strong>Iron</strong> is an essential nutrient supporting the growth <strong>and</strong> metabolism <strong>of</strong> marineorganisms. <strong>Iron</strong>-bearing molecules are involved in photosynthetic <strong>and</strong> respiratoryelectron transport, nitrate <strong>and</strong> nitrite reduction, N 2 -fixation, sulfate reduction,<strong>and</strong>, as enzyme components, in the detoxification <strong>of</strong> reactive oxygen speciessuch as O 2 2 <strong>and</strong> H 2 O 2 [1].Relative to other nutrients, iron is disproportionately utilized in cell metabolismover cell structure. As a result, cellular Fe : C ratios tend to vary with Feavailability (<strong>and</strong>, by extension, metabolic rate), in contrast to the more or lessfixed ratios <strong>of</strong> C : N : P measured in marine phytoplankton [2,3]. Fe : C ratiosmeasured in pelagic phytoplankton <strong>and</strong> marine particulate matter range from1 : 3000 to 1 : 500,000 [3–7]. This variation in cellular Fe content is intrinsic todifferent classes <strong>of</strong> phytoplankton as has been shown in culture experiments[8]. In particular, because iron is present in the catalytic centers <strong>of</strong> nitrate- <strong>and</strong>nitrite-reductase enzymes, in reducing equivalent molecules (NADPH,ferredoxin) <strong>and</strong> in the N 2 -fixing enzyme nitrogenase, organisms assimilating
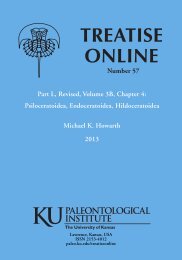
0000-0-Sigel-ch07_R1_121004<strong>Iron</strong>, <strong>Phytoplankton</strong> <strong>Growth</strong>, <strong>and</strong> <strong>Carbon</strong> <strong>Cycle</strong> 1558990919293949596979899100101102103104105106107108109110111112113114115116117118119120121122123124125126127128129130131132nitrate as a nitrogen source or fixing N 2 from the atmosphere require much morecellular iron to support growth than those utilizing reduced nitrogen species[1,9–12].1.2. Cellular Uptake MechanismsBy almost any measure, iron is vanishingly scarce in seawater, <strong>and</strong> much <strong>of</strong> theiron that is present exists in forms not directly accessible to organisms (Sections 2<strong>and</strong> 3). Marine phytoplankton are for the most part restricted to the uptake <strong>of</strong> dissolvedFe species although Fe can be solubilized from particles or colloids.Marine phytoplankton have evolved several strategies for efficiently acquiringiron <strong>and</strong> transporting it across the hydrophobic, semi-impermeable lipid bilayermembrane surrounding most cells. The general mechanism involves the use <strong>of</strong>cell-regulated membrane transport proteins (“transporters”), but prokaryotic<strong>and</strong> eukaryotic cells have each developed distinct variations on this approach.Prokaryotic microorganisms, including marine phototrophic <strong>and</strong> heterotrophicbacteria, are known to acquire Fe(III) by means <strong>of</strong> siderophore-basedtransport systems. In these systems, cells under Fe stress synthesize <strong>and</strong>release low-mass, high-affinity Fe(III)-chelating molecules (“siderophores”)into the surrounding seawater, where they capture <strong>and</strong> solubilize otherwise unavailableFe species (e.g., oxide minerals, particle-bound, organic complexes)[13–16]. The Fe-siderophore chelates are then taken up via chelate-specifictransporters, which move the complex across the membrane <strong>and</strong> release Feinside the cell via reduction to Fe(II) or degradation <strong>of</strong> the siderophore itself.Seawater surveys indicated that a large fraction <strong>of</strong> the bacteria were capable <strong>of</strong>producing strong Fe-binding chelators (probably siderophores) [17–20]. Siderophoretransport systems, sometimes utilizing novel chelating agents, have beendescribed in many cyanobacteria [11,21,22] (Fig. 1).In contrast to marine bacteria, there is little evidence for the production <strong>of</strong>siderophores by eukaryotic marine phytoplankton [23,24]. Rather, eukaryotesappear to utilize transporters that directly capture dissolved inorganic iron atthe cell membrane. Experiments with two diatoms <strong>and</strong> a coccolithophorefound that for these organisms Fe uptake depends on the concentration <strong>of</strong>labile inorganic Fe <strong>and</strong> is independent <strong>of</strong> the concentration <strong>of</strong> total iron[5,23,25]. Tracer experiments have shown that phytoplankton will make use <strong>of</strong>iron bound to siderophores or other organic lig<strong>and</strong>s only after photo- or biologically-mediateddissociation from the lig<strong>and</strong> [15]. It is likely that the transportersinvolved in Fe uptake are transmembrane proteins, powered by ATP or crossmembraneelectrochemical gradients, <strong>and</strong> controlled by a DNA switch thatrepresses gene transcription <strong>and</strong> hence synthesis <strong>of</strong> transport proteins whenintracellular Fe concentrations become elevated [1,25,26].Certain classes <strong>of</strong> photosynthetic protozoan marine algae are able todirectly ingest cells or abiotic particles as supplementary sources <strong>of</strong> fixedcarbon <strong>and</strong> essential nutrients, including the bulk <strong>of</strong> the iron required tosupport photosynthesis <strong>and</strong> respiration [27]. These “mixotrophic” organismsF1; Q1
0000-0-Sigel-ch07_R1_121004156 Street <strong>and</strong> Paytan133134135136137138139140141142143144145146147148149150151152153154155156157158159160161162163164165166167168169170171172173174175176Figure 1 (A) Heme, one <strong>of</strong> several iron-bearing porphyrin compounds, occurring incytochromes <strong>and</strong> other metabolic proteins in marine microorganisms; (B) Alterobactin,a siderophore produced by marine bacteria. Reproduced from Ref. [283] by courtesy <strong>of</strong>the American Society <strong>of</strong> Limnology <strong>and</strong> Oceanography; (C) Chelation <strong>of</strong> Fe 3þ by a hydroxamatesiderophore. Adapted from Ref. [284] by courtesy <strong>of</strong> Marcel Dekker, Inc.have been shown to be able to sustain moderate growth rates (35–70% <strong>of</strong>maximum) using only ingested mineral colloids as Fe sources in seawater thathas been artificially depleted in dissolved iron [28].1.3. Chemical <strong>and</strong> Physical Limits on Uptake Rates<strong>Iron</strong> uptake rates for most phytoplankton species appear to be limited by the rate<strong>of</strong> cross-membrane transport, itself a function <strong>of</strong> lig<strong>and</strong> exchange kinetics <strong>and</strong> theamount <strong>of</strong> space available on the outer cell membrane for transporter proteins
0000-0-Sigel-ch07_R1_121004<strong>Iron</strong>, <strong>Phytoplankton</strong> <strong>Growth</strong>, <strong>and</strong> <strong>Carbon</strong> <strong>Cycle</strong> 157177178179180181182183184185186187188189190191192193194195196197198199200201202203204205206207208209210211212213214215216217218219220[1,23,29]. This conclusion is born out by experiments with coastal diatoms <strong>and</strong>din<strong>of</strong>lagellates <strong>of</strong> a range <strong>of</strong> cell sizes (3.5–32 mm), which show that cellsurface- <strong>and</strong> volume-normalized Fe uptake rates, as well as specific growthrates, flatten out with increasing dissolved Fe concentrations. Although part <strong>of</strong>this effect may have resulted from Fe-hydroxide precipitation at high Fe concentrations,cell surface normalized Fe uptake was similar for all species, regardless<strong>of</strong> size, consistent with the notion <strong>of</strong> uptake rates near their physical <strong>and</strong> chemicallimits [30]. This finding was replicated in a comparison <strong>of</strong> an oceanic diatom(Thalassiosira oceanica) with a related coastal diatom (T. pseudonana) [1].However, in spite <strong>of</strong> identical surface-normalized uptake rates, the oceanicdiatom grew much faster than the coastal species at low Fe concentrations.These results suggest that oceanic species have adapted to the low iron conditions<strong>of</strong> the open ocean by increasing their Fe-use efficiency <strong>and</strong> reducing their growthrequirement for iron by up to sixfold compared to coastal phytoplankton, whichhave adapted to higher ambient Fe concentrations [4,5,10].Large cells with low surface : volume ratios are at a disadvantage withregard to iron uptake, especially in iron-poor environments. In the experimentsdiscussed earlier, the din<strong>of</strong>lagellate Prorocentrum micans (30 mm) achievedsurface-normalized uptake rates similar to those <strong>of</strong> smaller species, but lowervolume-normalized uptake rates because <strong>of</strong> its larger size. This translated intolower intracellular Fe : C ratios <strong>and</strong> lower growth rates relative to the smallerspecies, especially at low Fe concentrations [30]. Moreover, for large cells(.60 mm), diffusion <strong>of</strong> bioavailable Fe species to the cell surface becomes a significantfactor limiting uptake rates [29]. The cumulative effect <strong>of</strong> these physicallimits is perhaps most clearly illustrated by the widespread observation thatsmall-celled phytoplankton communities dominate the iron-limited, high nutrientlow chlorophyll (HNLC) regions <strong>of</strong> the ocean [31–35].Models <strong>of</strong> carrier-mediated Fe uptake indicate that the transport process isalso limited by the rate <strong>of</strong> reaction <strong>of</strong> labile Fe binding to the membrane transporter[1,23]. Observed rates <strong>of</strong> this reaction closely match those for the reaction <strong>of</strong>dissolved Fe(III), abbreviated here as Fe(III) 0 , with microbial siderophores[36,37] <strong>and</strong> with the naturally-occurring strong organic lig<strong>and</strong>s in the surfaceocean [36,38–40]. Because Fe-chelates <strong>and</strong> colloids have slow lig<strong>and</strong> exchangekinetics, it follows that these forms would be essentially unavailable for directuptake by phytoplankton [1]. Experiments indicate that Fe(III) 0 are the speciesactually taken up by phytoplankton, hinting at the existence <strong>of</strong> an auto-oxidationstep following the binding <strong>of</strong> Fe(II) to the membrane transporter [23].1.4. Expression <strong>of</strong> StressCells growing under suboptimal iron conditions undergo a number <strong>of</strong> physiological<strong>and</strong> functional changes, some <strong>of</strong> which can be measured as indicators <strong>of</strong> ironstress. <strong>Iron</strong>-stressed phytoplankton are less photosynthetically efficient than theiriron-replete counterparts [41,42], a response that has been clearly demonstrated
0000-0-Sigel-ch07_R1_121004158 Street <strong>and</strong> Paytan221222223224225226227228229230231232233234235236237238239240241242243244245246247248249250251252253254255256257258259260261262263264in the many Fe enrichment studies conducted in low iron regions <strong>of</strong> the ocean(Section 4). In iron-stressed communities, average cell volumes decline, <strong>and</strong>cellular ratios <strong>of</strong> major elements (C, N, P, Si) to Fe <strong>and</strong> to one another willchange [5,10,43]. Not coincidentally, chronically iron-limited ecosystems aredominated by small species with high Fe-use efficiencies (Section 4).Many iron-stressed microorganisms, including diatoms, replace the Fecontainingredox protein ferredoxin with flavodoxin, a redox protein <strong>of</strong> similarfunction containing rib<strong>of</strong>lavin 5 0 -phosphate as a c<strong>of</strong>actor instead <strong>of</strong> Fe[44–46]. This substitution <strong>of</strong> proteins lowers the intracellular iron requirements<strong>of</strong> diatoms [47], <strong>and</strong> provides oceanographers with a potentially powerful probefor identifying iron-limited ocean regions <strong>and</strong> teasing apart differences in ironstress among different phytoplankton taxa. Flavodoxin abundances (relative tototal protein) in diatom extracts have been used to trace a gradient <strong>of</strong> increasingiron stress moving from coastal to open ocean areas in the eastern subarcticPacific, providing further confirmation <strong>of</strong> iron limitation in this region [47].2. IRON CHEMISTRY IN SEAWATER<strong>Iron</strong> is the fourth most abundant element in the Earth’s crust, yet is scarce as adissolved element in seawater to the point <strong>of</strong> limiting primary productivity inmany parts <strong>of</strong> the ocean. Although biological uptake greatly intensifies this scarcity,iron availability in seawater is ultimately limited by the inorganic chemistry<strong>of</strong> Fe in the oxic, slightly basic (pH 8) conditions that dominate the modernocean.2.1. Chemical Forms<strong>Iron</strong> occurs in seawater in multiple forms, particulate <strong>and</strong> dissolved, organic <strong>and</strong>inorganic, over a wide range <strong>of</strong> physical size classes. Particulate Fe, commonlydefined as that fraction removed by filtration through 0.2 or 0.4 mm pore sizefilters, is contained in particles <strong>of</strong> alumino-silicate clays, the intact cells <strong>of</strong>marine microorganisms, <strong>and</strong> a variety <strong>of</strong> biogenic detritus, ranging in sizefrom submicron to .100 mm in diameter [48]. Dissolved Fe (,0.2–0.4 mm)consists largely <strong>of</strong> iron complexed with organic molecules, including severalclasses <strong>of</strong> organic chelators, cell lysis products, <strong>and</strong> humic compounds[36,38,49–51]. Inorganic iron hydroxides comprise a small but important fraction<strong>of</strong> the dissolved Fe pool, while free iron (Fe 3þ ,Fe 2þ ) is all but absent.A significant portion <strong>of</strong> operationally defined “dissolved Fe” actually consists<strong>of</strong> small (0.02–0.45 mm) colloidal particles, ranging from ,10% <strong>of</strong> totaldissolved Fe in open ocean samples to 90% in coastal waters [52–54]. It hastraditionally been assumed that dissolved Fe is equivalent to bioavailable Fe;this is complicated by lig<strong>and</strong> binding, which keeps Fe in solution but not in adirectly accessible form <strong>and</strong> by the large colloidal fraction <strong>of</strong> the dissolvedpool, which is not directly bioavailable [54].
0000-0-Sigel-ch07_R1_121004<strong>Iron</strong>, <strong>Phytoplankton</strong> <strong>Growth</strong>, <strong>and</strong> <strong>Carbon</strong> <strong>Cycle</strong> 1592652662672682692702712722732742752762772782792802812822832842852862872882892902912922932942952962972982993003013023033043053063073082.2. Speciation <strong>and</strong> Redox Chemistry<strong>Iron</strong> can exist in two oxidation states, Fe(III) or Fe(II), free or complexed withinorganic or organic lig<strong>and</strong>s. In oxic seawater, Fe(III) is the dominant state: thermodynamicallystable, highly reactive with respect to hydrolysis, adsorption <strong>and</strong>complex formation, <strong>and</strong> as a result largely unavailable as dissolved, free Fe 3þ .The inorganic speciation <strong>of</strong> iron is dominated by a host <strong>of</strong> low solubilityFe(III) hydrolysis products [“Fe(III) 0 ”] [1,37,55–57]. Over time these speciesundergo progressive dehydration <strong>and</strong> crystallization to more insoluble forms,eventually leading to the formation <strong>of</strong> stable, insoluble iron oxide minerals [1].The Fe hydrolysis species precipitate as hydroxides at concentrations <strong>of</strong>0.7 nM [5]; as they age their solubility decreases further to levels in therange <strong>of</strong> 0.1–0.3 nM [56–58]. Fe(III) 0 will also adsorb to particle surfaces withhigh affinity, <strong>and</strong> hence are readily scavenged from the water column duringparticle settling [1].Species <strong>of</strong> the more soluble <strong>and</strong> kinetically labile Fe(II) redox state areintermittently present in seawater as a result <strong>of</strong> Fe(III) reduction by a variety<strong>of</strong> processes in different ocean environments. Chemical <strong>and</strong>/or microbialreduction <strong>of</strong> Fe(III) 0 occurs on a large scale in anoxic basins <strong>and</strong> sediments(Sections 3.1.4 <strong>and</strong> 3.3.4) <strong>and</strong> on a microscopic scale within the fecal pellets<strong>of</strong> zooplankton. In the surface ocean reduction occurs via absorption <strong>of</strong> highvisible-low UV light (photo-reduction) [51,59–65], <strong>and</strong> via biologicallymediatedreactions at cell surfaces [12,66–68].In contrast to their Fe(III) counterparts, inorganic Fe(II) species [“Fe(II) 0 ”]are very soluble <strong>and</strong> Fe(II)–organic complexes only weakly bound [1]; theimmediate result <strong>of</strong> the various reduction processes is intermittent increases inthe availability <strong>of</strong> dissolved, labile Fe species. Once released in oxic waters,however, dissolved Fe(II) 0 are quickly reoxidized by dissolved oxygen or H 2 O 2[69] <strong>and</strong> reprecipitated as Fe(III) hydroxides or reincorporated into complexeswith organic lig<strong>and</strong>s. Nonetheless, the net result <strong>of</strong> this iron redox cycling is toincrease the concentrations <strong>of</strong> dissolved Fe(II) 0 <strong>and</strong> Fe(III) 0 in seawater. Thesedissolved Fe species are the most important iron source to phytoplankton.2.3. Interaction with Organic CompoundsThe near-ubiquity <strong>of</strong> natural Fe-binding organic lig<strong>and</strong>s <strong>and</strong> the critical importance<strong>of</strong> organic complexation in controlling the speciation <strong>and</strong> distribution <strong>of</strong>dissolved iron have been among the more startling realizations in chemicaloceanography in the last decade. Measurements using competitive lig<strong>and</strong> equilibration/cathodicstripping voltammetry techniques have shown that .99% <strong>of</strong>dissolved Fe(III) 0 in seawater collected from a wide variety ocean regions isbound to organic chelators [36,38,49,50,70]. In the North Pacific, two distinctlig<strong>and</strong> classes <strong>of</strong> differing binding strengths were identified, with a total concentration(2 nM) far in excess <strong>of</strong> dissolved Fe concentrations [38]. These directmeasurements are supported by experimental work showing that Fe(III) 0
0000-0-Sigel-ch07_R1_121004160 Street <strong>and</strong> Paytan309310311312313314315316317318319320321322323324325326327328329330331332333334335336337338339340341342343344345346347348349350351352solubility is greater in natural seawater than in either artificial seawater or NaClsolution <strong>of</strong> equal ionic strength, presumably because <strong>of</strong> the Fe-binding lig<strong>and</strong>spresent in natural seawater [57]. Biogeochemical models <strong>of</strong> Fe cycling alsoseem to require organic chelators (or a functional equivalent) to explain theobserved distribution <strong>of</strong> dissolved iron in the ocean [71].Complexation with organic lig<strong>and</strong>s decreases the concentrations <strong>of</strong> reactiveFe(III) 0 , increasing Fe solubility (with respect to Fe-hydroxide formation) by asignificant, <strong>and</strong> perhaps biologically crucial, increment on the order <strong>of</strong>0.2–0.5 nM [56,57], <strong>and</strong> protects dissolved Fe from particle scavenging. Thebenefit derived by organisms from this state <strong>of</strong> affairs is obvious, <strong>and</strong> there isconsiderable evidence to suggest that many <strong>of</strong> the Fe-binding lig<strong>and</strong>s in seawaterhave been released by microorganisms, protozoa, <strong>and</strong> zooplankton [40,72].3. IRON DISTRIBUTION AND CYCLING IN THE OCEANThe distribution <strong>of</strong> dissolved <strong>and</strong> particulate iron in the ocean is highly heterogeneous,a complex function <strong>of</strong> spatially <strong>and</strong> temporally variable externalinputs, lateral <strong>and</strong> vertical redistribution by ocean currents, active biologicaluptake, recycling, <strong>and</strong> export, <strong>and</strong> a host <strong>of</strong> chemical <strong>and</strong> physical processesthat can add or remove iron from the dissolved, biologically-available pool.Measured dissolved iron concentrations in the ocean range over six orders <strong>of</strong>magnitude, from as low as 0.03 nM in the surface waters <strong>of</strong> open ocean HNLCregions to 3 mM in hydrothermal vent fluids, with all other marine environmentsfalling between these extremes.3.1. External <strong>Iron</strong> SourcesExternal sources <strong>of</strong> iron to the ocean include atmospheric dust deposition, riverinput, hydrothermal vents, <strong>and</strong> release from marine sediments via reductive dissolution<strong>and</strong> resuspension. The magnitudes <strong>of</strong> these sources are highly uneven inspace <strong>and</strong> time, <strong>and</strong> for chemical <strong>and</strong> physical reasons, only a small fraction <strong>of</strong>the iron they deliver is retained to become bioavailable in the surface waters<strong>of</strong> the open ocean.3.1.1. Atmospheric Dust DepositionAtmospheric deposition <strong>of</strong> continentally-derived particles (“aerosols”, “dust”) isa major external input <strong>of</strong> iron to the oceans. In some open ocean areas, includingthe iron-limited subarctic Pacific, dust deposition is the dominant iron source tothe surface layer. The atmospheric iron source is composed largely <strong>of</strong> aluminosilicateminerals derived from arid <strong>and</strong> semi-arid mid-latitude regions in theNorthern Hemisphere [73–75]; the exception to this rule is downwind <strong>of</strong>heavily populated areas, where a significant fraction <strong>of</strong> aerosol iron may originatefrom anthropogenic sources [76–78].
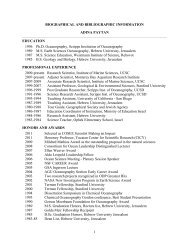
0000-0-Sigel-ch07_R1_121004<strong>Iron</strong>, <strong>Phytoplankton</strong> <strong>Growth</strong>, <strong>and</strong> <strong>Carbon</strong> <strong>Cycle</strong> 161353354355356357358359360361362363364365366367368369370371372373374375376377378379380381382383384385386387388389390391392393394395396Aerosol production rates vary in response to precipitation amount <strong>and</strong> windstrength [79–81]. Typically only relatively small particles (1–100 mm diameter)become entrained in the atmosphere. The largest atmospheric particlesare deposited quickly via gravitational settling near the source area, butsmaller size classes (,10 mm) reach high altitudes <strong>and</strong> can be transported hundredsor thous<strong>and</strong>s <strong>of</strong> kilometers before being deposited [82–84]. Depositionoccurs through either the direct “dry” settling <strong>of</strong> particles or the entrainment <strong>of</strong>particles in rainfall, termed “wet” deposition.Deposition fluxes are difficult to measure, <strong>and</strong> vary over space <strong>and</strong> time[82,85,86]. The relative importance <strong>of</strong> dry vs. wet deposition also varies seasonally<strong>and</strong> from place to place. For instance, wet deposition <strong>of</strong> aerosol iron dominatesin the Atlantic intertropical convergence zone (ITCZ) due to high rainfall[87], while most <strong>of</strong> the aerosol flux to the northwestern Pacific in the spring isin the form <strong>of</strong> dry deposition [88]. Ocean basins directly downwind <strong>of</strong> desertsource areas, notably the northwest Pacific, north Atlantic, <strong>and</strong> Arabian Sea,receive high aerosol fluxes [88–94]. In contrast, measured aerosol concentrationsat stations in the remote South Pacific, South Indian, <strong>and</strong> Southern Oceans are1–3 orders <strong>of</strong> magnitude lower [95–99]. Even within high-flux basins, large latitudinal<strong>and</strong> longitudinal gradients exist, with aerosol concentrations, <strong>and</strong> henceiron fluxes, declining with distance from dust sources <strong>and</strong> primary wind-transportpathways [82,87,88,93,100]. For example, aerosol observations using TOMS <strong>and</strong>METEOSAT satellites over the period 1979–1997 reveal extreme interannualvariability in the emission <strong>and</strong> transport <strong>of</strong> Saharan dust over the Atlantic,especially from the fringing Sahel region [101,102] (Fig. 2).The fraction <strong>of</strong> iron in soils <strong>and</strong> rocks at the Earth’s surface varies, but generallyfalls between 2.9% <strong>and</strong> 4.8%, with a widely-used average <strong>of</strong> 3.5% [82,86].Figure 2 Atmospheric iron fluxes to the ocean, in mg m 22 year 21 . Adapted fromRef. [86], using an average Fe content for mineral dust <strong>of</strong> 3.5% [82].F2; Q1
0000-0-Sigel-ch07_R1_121004162 Street <strong>and</strong> Paytan397398399400401402403404405406407408409410411412413414415416417418419420421422423424425426427428429430431432433434435436437438439440Similar fractions have been measured in aerosol particles [103,104]. Applying thisaverage composition to an estimated total aerosol flux <strong>of</strong> 472 10 12 gyear 21 [82],the total global atmospheric flux <strong>of</strong> iron to the oceans is on the order <strong>of</strong>16–32 10 12 gyear 21 .Only a small fraction <strong>of</strong> the atmospheric flux <strong>of</strong> iron to the oceans everbecomes bioavailable, largely because <strong>of</strong> the low solubility <strong>of</strong> the particulate<strong>and</strong> colloidal Fe(III) phases that comprise the bulk <strong>of</strong> aerosol iron species. Nonetheless,bottle incubation experiments have shown that aerosol addition is anefficient stimulator <strong>of</strong> chlorophyll <strong>and</strong> biomass production in phytoplankton cultures[105,106], emphasizing the need to underst<strong>and</strong> the factors <strong>and</strong> processescontrolling the chemical speciation <strong>and</strong> solubility <strong>of</strong> aerosol iron before <strong>and</strong>after deposition.Most aerosol particles in the atmosphere are exposed to low pH conditions(pH 1–5.5) during cycles <strong>of</strong> cloud formation <strong>and</strong> evaporation, which mayenhance the release <strong>of</strong> dissolved Fe species from the particles [77,107–109]<strong>and</strong> facilitate high rates <strong>of</strong> photoreductive dissolution <strong>of</strong> particulate <strong>and</strong> colloidalFe(III) 0 [59,110–112]. The net result is a significant, sometimes dominant component<strong>of</strong> Fe(II) species in atmospheric, solution-phase iron [77,108,109]. Complexation<strong>of</strong> Fe(III) with organic species in atmospheric water (e.g., oxalate,acetate, formate, humic compounds) may also increase the solubility <strong>and</strong> photoreactivity<strong>of</strong> aerosol iron [59,111,113–115]. During wet deposition, entrainedaerosol iron is exposed to more neutral conditions, first in rainwater (pH 4–7)<strong>and</strong> then upon mixing with seawater (pH . 8), after which an estimated 0.3–6.8% <strong>of</strong> the aerosol iron remains in the dissolved phase. In theory, the high pH<strong>and</strong> ionic strength <strong>of</strong> seawater should promote a more complete conversion toparticulate phases [1]; the observed solubility may be the result <strong>of</strong> organic complexationin the atmosphere or in seawater immediately after deposition. In contrastto wet deposited iron, the solubility <strong>of</strong> dry deposited iron in seawater isgenerally low (1%) [77,103,108]. <strong>Iron</strong> derived from anthropogenicallyinfluenced“urban” or coastal aerosols is more soluble (up to 12%)[78,108,112] than mineral aerosol iron due to a larger fraction <strong>of</strong> labile,exchangeable Fe, including Fe(II) [76,77,108,116].In summary, it appears that though the atmospheric iron input to the globalocean is dominated by dry deposition (70%), the input <strong>of</strong> soluble, bioavailableiron comes largely through wet deposition. Jickells <strong>and</strong> Spokes [82] combinethese observations to estimate an overall solubility <strong>of</strong> atmospheric iron inseawater <strong>of</strong> 0.8–2.1% <strong>of</strong> the total Fe deposition flux, resulting in a soluble,bioavailable iron flux to the oceans <strong>of</strong> 13–67 10 10 g year 21 . This accountsfor a large fraction <strong>of</strong> the iron input at many locations in the ocean [117–121].3.1.2. River InputThe rivers <strong>and</strong> streams <strong>of</strong> the world discharge, on average, 37 10 12 m 3 year 21<strong>of</strong> water, carrying 4.6 10 15 gyear 21 <strong>of</strong> dissolved constituents <strong>and</strong>
0000-0-Sigel-ch07_R1_121004<strong>Iron</strong>, <strong>Phytoplankton</strong> <strong>Growth</strong>, <strong>and</strong> <strong>Carbon</strong> <strong>Cycle</strong> 16344144244344444544644744844945045145245345445545645745845946046146246346446546646746846947047147247347447547647747847948048148248348420 10 15 gyear 21 <strong>of</strong> suspended sediment. As with aerosol flux, river dischargeis highly seasonal <strong>and</strong> geographically uneven. A large fraction <strong>of</strong> the globaldischarge is to the central Atlantic Ocean due to the action <strong>of</strong> very large rivers(Amazon, Orinoco, Congo, Mississippi); most <strong>of</strong> the global sediment load isbornebyriversdrainingtheHimalayas[122,123].Measured values <strong>of</strong> dissolved Fe in rivers vary widely, as illustrated by theAmazon <strong>and</strong> Danube, which have concentrations <strong>of</strong> 800–1000 <strong>and</strong> 21–156 nM,respectively [124,125]. Using an estimated riverine dissolved Fe concentration <strong>of</strong>720 nM, de Baar <strong>and</strong> de Jong calculate a global flux <strong>of</strong> 26 10 9 mol dissolvedFe/year to the coastal zone [7]. However, experiments have shown that up to90% <strong>of</strong> the “dissolved” fraction actually consists <strong>of</strong> small colloid particles(,0.4 mm) that tend to flocculate with organic matter to form larger particleswhen brought into contact with seawater, <strong>and</strong> are efficiently removed during estuarinemixing [126–128]. As a result, the dissolved Fe concentration <strong>of</strong> water thatactually reaches the ocean is closer to 40 nM [126], yielding a global flux <strong>of</strong> only1.5 10 9 mol Fe year 21 [7]. Likewise, most <strong>of</strong> the large riverine load <strong>of</strong> particulateiron (13 10 12 mol year 21 ) is deposited in deltas <strong>and</strong> estuaries <strong>and</strong> neverreaches the open ocean [7].3.1.3. Hydrothermal SourcesFluids released from hydrothermal vents at mid-ocean ridges <strong>and</strong> in back-arcbasins contain high concentrations <strong>of</strong> reduced iron acquired via reductive dissolutionduring circulation through basaltic rocks at high temperatures (350–4008C)<strong>and</strong> pressures (300–400 bar) [129–133]. Typical concentrations <strong>of</strong> dissolvedFe are 1–3 mmol L 21 , <strong>and</strong> at least at certain vents the Fe flux is dominatedby Fe(III) oxyhydroxides. Though the gross hydrothermal input <strong>of</strong> iron to thedeep ocean is large, an estimated 30–90 10 9 mol year 21 [7], most <strong>of</strong> thereduced Fe species in vent fluids are rapidly oxidized <strong>and</strong> precipitated uponmixing with cold ambient bottom water (28C) [134]. The net result is largeferromanganese deposits close to venting sites but a negligible flux <strong>of</strong> iron todeep ocean water [7].3.1.4. Mobilization in SedimentsThe flux <strong>of</strong> iron from marine sediments, though poorly constrained, is probablyon the same order as the atmospheric flux, <strong>and</strong> is likely to be an important sourceterm in ocean regions where dust input is low. A clear signal <strong>of</strong> this source is thestrong increasing gradient <strong>of</strong> iron concentrations moving toward the continentalmargins [7,135]. Both deep marine clays <strong>and</strong> coastal <strong>and</strong> shelf muds are enrichedin iron relative to crustal abundances, with average iron contents <strong>of</strong> 6% [7].Roughly half <strong>of</strong> this iron exists in forms susceptible to reductive dissolution(oxide coatings, organics) <strong>and</strong> includes a component exported from overlyingwaters [136–139]. Diagenetic alteration <strong>of</strong> these iron-rich sediments releaseshigh concentrations (10–100 mM) <strong>of</strong> Fe(II) into sediment pore waters
0000-0-Sigel-ch07_R1_121004164 Street <strong>and</strong> Paytan485486487488489490491492493494495496497498499500501502503504505506507508509510511512513514515516517518519520521522523524525526527528[136,140–143]. The vast majority <strong>of</strong> dissolved pore water iron diffusing throughthe sediment column will be immobilized, either through oxidation to insolubleFe(III) species in oxic sediment layers or through sulfide mineral precipitationunder euxinic conditions [144–146]. The small fraction that reaches thesediment–water interface is nonetheless enough to increase dissolved Fe concentrationsat this boundary to 1–100 nM, well above the mean oceanic value. Much<strong>of</strong> this remaining dissolved Fe(II) 0 will then be reprecipitated as Fe(III) 0 or scavengedonto particles upon mixing with bottom water [138], with the remaindercontributing to the dissolved iron inventory <strong>of</strong> deep waters [7]. The importance <strong>of</strong>the benthic flux as a source <strong>of</strong> iron to surface waters has been demonstrated forseveral parts <strong>of</strong> the ocean, especially along continental shelves [135,139,147–149]. The spatial distribution <strong>of</strong> benthic iron sources is unknown, but isprobably related to sedimentary oxygen pr<strong>of</strong>iles, which control the degree <strong>of</strong>Fe(II) production <strong>and</strong> escape from sediments [7].3.2. <strong>Iron</strong> Cycling in the Ocean3.2.1. Upwelling <strong>and</strong> AdvectionOcean currents <strong>and</strong> other mixing processes play a central role in redistributingiron horizontally <strong>and</strong> vertically throughout the ocean [150]. The effect <strong>of</strong> advectivetransport <strong>of</strong> iron from a source area to an iron limited area can be clearly seenin the equatorial Pacific in the vicinity <strong>of</strong> the Galapagos Isl<strong>and</strong>s: Very low dissolvedFe concentrations (0.05 nM) are measured east or up-current <strong>of</strong> theisl<strong>and</strong>s, while concentrations down-current <strong>of</strong> <strong>and</strong> within the isl<strong>and</strong> group itselfare much higher (1–3 nM) [151,152]. In the coastal waters <strong>of</strong> California,which receive non-negligible river <strong>and</strong> dust inputs, pulses <strong>of</strong> shelf-derived Feiron in spring upwelling events appear to influence the productivity <strong>and</strong> pattern<strong>of</strong> summer diatom blooms [147,153,154]. Even in iron-limited regions theadvective action <strong>of</strong> mesoscale eddies can produce scattered patches <strong>of</strong> relativelyFe-enriched waters [155].In remote regions <strong>of</strong> the open ocean that receive little atmospheric input,the vertical transport <strong>of</strong> iron-rich deep waters is particularly important[73,156]. The primary source <strong>of</strong> iron to the Fe-limited Southern Ocean is entrainment<strong>of</strong> Fe-enriched water during deep winter mixing, augmented by the summerupwelling <strong>of</strong> circumpolar deep water at the Polar Front <strong>and</strong> the southern front <strong>of</strong>the Antarctic Circumpolar Current [119,155,157].Attempts to estimate global upwelling fluxes <strong>of</strong> iron to the euphotic zonehave yielded sharply divergent results. The model <strong>of</strong> Fung et al. [120] calculateda total upwelling flux <strong>of</strong> 0.7 10 9 mol Fe year 21 , a small fraction <strong>of</strong> a globalsource term dominated by atmospheric dust input. Even in the dust-starvedSouthern Ocean, upwelling provided only 3.3% <strong>of</strong> the Fe input [120]. In contrast,Moore et al. estimated iron input to the surface layer from a variety <strong>of</strong> physicalprocesses, including upwelling, entrainment, <strong>and</strong> turbulent mixing, <strong>and</strong> arrived at
0000-0-Sigel-ch07_R1_121004<strong>Iron</strong>, <strong>Phytoplankton</strong> <strong>Growth</strong>, <strong>and</strong> <strong>Carbon</strong> <strong>Cycle</strong> 165529530531532533534535536537538539540541542543544545546547548549550551552553554555556557558559560561562563564565566567568569570571572a much larger global flux <strong>of</strong> 14 10 9 mol Fe year 21 , although inclusion <strong>of</strong>physical loss terms significantly reduces this flux [121].Watson’s Fe budget for the HNLC regions attributes a relatively large fraction(19–99%) <strong>of</strong> the total Fe input to the surface ocean to upwelling processes,especially in the equatorial Pacific <strong>and</strong> Southern Ocean [156]. The iron cyclemodels <strong>of</strong> Archer <strong>and</strong> Johnson predict that 55–85% <strong>of</strong> oceanic carbon exportproduction is supported by upwelled <strong>and</strong> entrained iron [154]. The differencesamong the estimates reflect the great uncertainty in these calculations, but allanalyses suggest an important role for upwelled Fe, especially in the equatorialPacific <strong>and</strong> Southern Ocean HNLC regions, where aerosol inputs are low relativeto the rest <strong>of</strong> the ocean.3.2.2. Biological Cycling, Export, <strong>and</strong> RegenerationThe high biological dem<strong>and</strong> for iron relative to its abundance in the surface oceanresults in a biogeochemical cycle that, at least in surface waters, is dominated byorganisms. Fe uptake by prokaryotic <strong>and</strong> eukaryotic photosynthesizers, diazotrophs,<strong>and</strong> heterotrophic bacteria in the mixed layer is the largest single flux<strong>of</strong> the element in the ocean system, amounting to 21–26 (10 9 ) mol Feyear 21 [120,121]. Globally, the largest fraction <strong>of</strong> this Fe uptake appears to beperformed by small phytoplankton (73%), followed by diatoms (22%) <strong>and</strong>diazotrophs (5%). The large Fe uptake by diazotrophs relative to theircontribution to primary production (1%) reflects the high Fe requirements <strong>of</strong>N-fixation [121].<strong>Iron</strong> taken up by microorganisms is subject to intense recycling in thesurface layer, carried out predominately by a more or less perennial “smallfood web” <strong>of</strong> nanoplankton <strong>and</strong> microzooplankton that is based on the efficientreuse <strong>of</strong> nutrient resources [158–161,162]. The remineralization <strong>of</strong> iron isenhanced by passage through the digestive tracts <strong>of</strong> zooplankton, where lowpH conditions promote iron dissolution [161,163]. Seasonally, or when favorableconditions <strong>of</strong> light <strong>and</strong> nutrient supply coincide, the background communities inmany marine ecosystems are augmented by blooms <strong>of</strong> large eukaryotic phytoplankton,notably diatoms. These intermittent “large food webs” support the secondaryproduction <strong>of</strong> large zooplankton <strong>and</strong> higher trophic levels. It is during <strong>and</strong>after large phytoplankton blooms that most export production <strong>of</strong> carbon, iron, <strong>and</strong>other nutrients to the deep ocean occurs, driven by the direct sinking <strong>of</strong> largedeceased phytoplankton (e.g., diatom frustules) or the indirect pathwaythrough zooplankton fecal pellets [7,164,165]. Though much <strong>of</strong> the nutrient detritus<strong>of</strong> a phytoplankton bloom will be recycled within the mixed layer, at leastsome fraction will pass into the deep ocean. Export production is <strong>of</strong>ten enhancedby the diurnal migration <strong>of</strong> zooplankton from surface feeding zones down todepth (500–1000 m), where most defecation occurs. Moore et al. have estimatedthat 78% <strong>of</strong> the global iron uptake by phytoplankton is remineralized within thesurface mixed layer, with the remainder lost to detrital sinking, mixed layershoaling, <strong>and</strong> turbulent mixing [121].
0000-0-Sigel-ch07_R1_121004166 Street <strong>and</strong> Paytan5735745755765775785795805815825835845855865875885895905915925935945955965975985996006016026036046056066076086096106116126136146156163.2.3. Particle ScavengingThe Fe(III) species that make up the bulk <strong>of</strong> the free dissolved iron in the oceanare highly particle reactive <strong>and</strong> are readily scavenged from seawater by settlingmineral particles <strong>and</strong> biogenic debris [7,71,166,167]. These particles may containstrong adsorptive agents, such as ferromanganese coatings, clay minerals, ororganic functional groups with particular affinity for hydrolyzed trace metalspecies [7,167,168]. The rate <strong>of</strong> particle scavenging depends on the dissolvediron concentration <strong>and</strong> the abundance <strong>and</strong> size distribution <strong>of</strong> adsorptiveparticles.Fine particles (,10 mm), with long residence times <strong>and</strong> minimal settlingvelocities, will scavenge Fe but remain more or less stationary in the watercolumn, allowing for the development <strong>of</strong> a competitive equilibrium betweenFe in adsorbed <strong>and</strong> dissolved states. Coarse particles are largely biogenic inorigin <strong>and</strong> associated with phytoplankton blooms [7,169]. Relatively infrequent“rains” <strong>of</strong> large biogenic particles, with settling velocities <strong>of</strong> tens to hundreds<strong>of</strong> meters per day, have been observed to sweep out most <strong>of</strong> the small particlesin the water column, along with the particle-bound iron [7,164,165]. Comparablescavenging events have been observed during <strong>and</strong> after heavy mineral dust depositionin ocean regions near dust sources [76,108,116,170,171]. Below the photiczone, particle scavenging is the major removal process for dissolved iron.Scavenging counterbalances Fe regeneration by the decomposition <strong>of</strong> organicmatter, <strong>and</strong> sets a limit on dissolved iron concentrations <strong>and</strong> residence time inthe deep ocean. It has been suggested that scavenging loss <strong>of</strong> Fe is responsiblefor the low deep water Fe : P ratios (relative to Fe : P in sinking organic matter)observed in both the Atlantic <strong>and</strong> the Pacific. Where these low Fe : P watersare ventilated at the surface, they may play a role in the development <strong>of</strong> ironlimited, HNLC conditions [172].3.3. Patterns in the Distribution <strong>of</strong> <strong>Iron</strong> in the OceanThe global coverage <strong>of</strong> observations <strong>of</strong> iron concentrations in the open ocean issparse <strong>and</strong> unevenly spread, <strong>and</strong> even in the better-sampled areas sampling isseldom adequate to capture the short-order spatial <strong>and</strong> temporal variability thatcharacterizes much <strong>of</strong> the ocean. In coastal areas, especially along the AtlanticRim <strong>and</strong> in the semi-enclosed seas <strong>of</strong> Europe the range <strong>and</strong> variation in iron distributionhas been better characterized. The North Atlantic <strong>and</strong> North Pacificbasins have been sampled relatively frequently, in different seasons <strong>and</strong> undera variety <strong>of</strong> conditions, whereas vast tracks <strong>of</strong> ocean, especially in the SouthernHemisphere, are routinely characterized based on just a h<strong>and</strong>ful <strong>of</strong> measurements.The exception to this north–south imbalance is the Southern Ocean,where investigation <strong>of</strong> iron limitation in high nutrient, low chlorophyll watershas resulted in extensive sampling. In spite <strong>of</strong> these shortcomings, enough trustworthydata has been collected to identify the dominant patterns in the distribution<strong>of</strong> iron in the ocean. De Baar <strong>and</strong> de Jong, among others, provide an
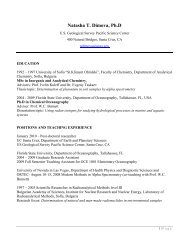
0000-0-Sigel-ch07_R1_121004<strong>Iron</strong>, <strong>Phytoplankton</strong> <strong>Growth</strong>, <strong>and</strong> <strong>Carbon</strong> <strong>Cycle</strong> 167617618619620621622623624625626627628629630631632633634635636637638639640641642643644645646647648649650651652653654655656657658659660exhaustive compilation <strong>of</strong> iron observations from around the world [7]; for thepurposes <strong>of</strong> this chapter, only general patterns will be discussed.3.3.1. Dissolved <strong>Iron</strong> in the Open OceanThe vertical distribution <strong>of</strong> dissolved iron in the vast majority <strong>of</strong> the ocean issimilar to that <strong>of</strong> other biologically-assimilated nutrients, notably nitrate <strong>and</strong>phosphate, <strong>and</strong> characterized by the following key features: (a) depletion at thesurface, driven by biological uptake; (b) a mid-depth maximum, correlated tothe rate <strong>of</strong> export production from the photic zone <strong>and</strong> the result <strong>of</strong> microbialregeneration <strong>of</strong> exported material; (c) reasonably stable, invariant concentrationsat depth [71]. <strong>Iron</strong>, however, differs from the macronutrients in notable, sometimessurprising ways, which raise basic questions about how its “nutrientlike”pr<strong>of</strong>ile is maintained (Fig. 3).Dissolved iron concentrations in the surface waters <strong>of</strong> the open ocean arethe net result <strong>of</strong> the suite <strong>of</strong> dynamic source, removal, <strong>and</strong> cycling processes discussedin previous sections. The combined effects <strong>of</strong> biological uptake, particlescavenging, <strong>and</strong> the low solubility <strong>of</strong> Fe(III) 0 restrict dissolved iron to nanomolarconcentrations nearly everywhere; Fe recycling, mediated by zooplanktongrazing <strong>and</strong> the microbial food web, along with Fe-binding organic lig<strong>and</strong>s<strong>and</strong> the diurnal process <strong>of</strong> photoreduction, partially counterbalance the removalprocesses. Nonetheless, the residence time <strong>of</strong> dissolved iron in the surfacelayer is very short, on the order <strong>of</strong> 1–2 months [7]. Dissolved iron concentrationgradients are evident moving toward or away from external sources. A classicexample is the subarctic Pacific, where iron concentrations generally decreasefrom east to west as the strength <strong>of</strong> the Asian dust source declines [118]. Thestrong increasing gradient moving onshore toward isl<strong>and</strong>s, coastlines, <strong>and</strong> continentalshelves is a related pattern, a particularly dramatic example being the12 nM increase in dissolved Fe measured in a Southern Ocean transectmoving from open water toward the Kerguelen Isl<strong>and</strong> shelf [173]. Entire oceanregions with strong iron sources, such as the tropical <strong>and</strong> subtropical Atlantic,display elevated surface concentrations (0.4–1.4 nM) [156] relative to otherswith weak sources, such as the eastern equatorial Pacific, where dissolved ironis <strong>of</strong>ten ,0.1 nM [151,152,174,175]. In summary, the majority <strong>of</strong> open oceanmeasurements <strong>of</strong> dissolved iron concentration fall between 0.03 <strong>and</strong> 1.0 nM [7].Dissolved iron concentrations in the deep ocean, below the nutricline, aretypically higher (0.3–1.2 nM) [7] <strong>and</strong> more stable than in the surface ocean, withan average concentration <strong>of</strong> 0.7 nM [7,71]. This observation makes sense atfirst glance: the net effect <strong>of</strong> biological export from the surface <strong>and</strong> remineralizationat depth would be a transfer <strong>of</strong> dissolved Fe to the deep water. <strong>Iron</strong>, however,is chemically much more similar to particle reactive metals such as manganese,aluminum, <strong>and</strong> lead than to nitrate or phosphate, <strong>and</strong> by this reasoning ought to bedepleted at depth, not enriched, as a result <strong>of</strong> particle scavenging [7,71,166,167].By the same token, the residence time <strong>of</strong> iron in the deep ocean is on the order <strong>of</strong>F3; Q1
0000-0-Sigel-ch07_R1_121004168 Street <strong>and</strong> Paytan661662663664665666667668669670671672673674675676677678679680681682683684685686687688689690691692693694695696697698699700701702703704Figure 3 Vertical distribution <strong>of</strong> dissolved Fe <strong>and</strong> nitrate in the central Subarctic Pacificat Ocean Station Papa, 508N, 1458W. Adapted from Ref. [118].15–150 years [7,176,177], far shorter than the residence times <strong>of</strong> nutrientelements (10 3 –10 5 years) [166]. One probe <strong>of</strong> this apparent paradox is to lookfor interocean fractionation <strong>of</strong> deep water dissolved iron concentrations.Because deep water moves from the Atlantic to the Pacific via thermohaline circulationon a timescale <strong>of</strong> 1000 years, nutrient elements tend to be enriched in thePacific relative to the Atlantic [71]. Scavenged elements tend to be depleted in thePacific because their water column removal rates greatly exceed the rate <strong>of</strong>thermohaline circulation [166,178].
0000-0-Sigel-ch07_R1_121004<strong>Iron</strong>, <strong>Phytoplankton</strong> <strong>Growth</strong>, <strong>and</strong> <strong>Carbon</strong> <strong>Cycle</strong> 169705706707708709710711712713714715716717718719720721722723724725726727728729730731732733734735736737738739740741742743744745746747748<strong>Iron</strong> shows only minor interocean fractionation [7], fitting the pr<strong>of</strong>ile <strong>of</strong>neither a nutrient nor a scavenged element. Some have suggested that this behavioris the result <strong>of</strong> the widespread organic complexation <strong>of</strong> iron (Section 2.3),which would maintain dissolved iron concentrations <strong>and</strong> discourage particlescavenging below a certain concentration [55,71,179].3.3.2. Dissolved <strong>Iron</strong> in the Coastal Ocean, Shallow Seas, <strong>and</strong>Semi-enclosed BasinsConcentrations <strong>of</strong> dissolved iron in the coastal ocean, shallow seas overlying thecontinental shelves, <strong>and</strong> semi-enclosed basins are typically several orders <strong>of</strong>magnitude higher (1–100 nM) than in the open ocean, thanks in large part tothe close proximity <strong>of</strong> major continentally-derived sources. Recent surveys <strong>of</strong>the western Mediterranean Sea have revealed significant, order <strong>of</strong> magnitudevariations in both dissolved (0.13–4.8 nM) <strong>and</strong> particulate (0.8–14.5 nM)surface water iron concentrations between autumn <strong>and</strong> spring as a result <strong>of</strong> seasonalvariations in aeolian deposition [180]. <strong>Iron</strong> concentrations in much <strong>of</strong> thecoastal ocean can be expected to mirror the seasonal <strong>and</strong> episodic nature <strong>of</strong>source processes <strong>and</strong> biological activity.Despite generally elevated Fe concentrations, a high degree <strong>of</strong> small-scalespatial heterogeneity has been documented in parts <strong>of</strong> the coastal ocean, notablyin the central California upwelling zone (Section 4.2.3), where Fe-replete patchesoccur nearby other areas where Fe has been shown to limit phytoplankton growth[153,181]. Low iron concentrations, potentially limiting or near-limiting forcoastal species, have at times been measured in other coastal regions[180,182,183], but widespread iron limitation in the coastal ocean has not beendemonstrated.3.3.3. Particulate <strong>Iron</strong>The distribution <strong>of</strong> non-colloidal particulate iron (.0.4 nM) in the surface oceanis similar to that <strong>of</strong> dissolved iron, with strong increasing gradients movingtowards the coast <strong>and</strong> continental shelf. Particulate concentrations are <strong>of</strong>tenseveral orders <strong>of</strong> magnitude greater than dissolved concentrations, rangingfrom extreme lows <strong>of</strong> 0.1 nM in the remote gyres to 100–800 nM in coastalareas [7]. A majority <strong>of</strong> particulate iron (50–90%) is considered refractory,while the remainder (10–50%) is leachable with dilute acid, <strong>and</strong> may be moreeasily converted to bioavailable forms [7]. Processes such as photoreduction<strong>and</strong> zooplankton-mediated dissolution <strong>of</strong> biogenic may result in daily or episodicvariations in particulate Fe abundance in the euphotic zone [59–65,161].3.3.4. Suboxic/Anoxic Zones<strong>Iron</strong> chemistry <strong>and</strong> distribution in a h<strong>and</strong>ful <strong>of</strong> suboxic <strong>and</strong> anoxic marineenvironments st<strong>and</strong> in marked contrast to conditions prevailing the predominantlyoxic ocean. As oxygen levels decline toward zero, there is a gradual
0000-0-Sigel-ch07_R1_121004170 Street <strong>and</strong> Paytan749750751752753754755756757758759760761762763764765766767768769770771772773774775776777778779780781782783784785786787788789790791792shift in the relative stability <strong>of</strong> Fe(II) <strong>and</strong> Fe(III), <strong>and</strong> a concomitant increase indissolved iron concentrations as solid Fe(III)–hydroxides undergo reductivedissolution. At only mildly euxinic conditions (10 mM sulfide), the ratio <strong>of</strong>Fe(II) : Fe(III) has undergone a pr<strong>of</strong>ound shift relative to oxic conditions, from10 210 to 10 7 [7]. Reduced Fe(II) species dominate, <strong>and</strong> dissolved iron concentrationsincrease because <strong>of</strong> the higher solubility <strong>of</strong> this redox state.Under stronger euxinic conditions, concentrations <strong>of</strong> both iron <strong>and</strong> hydrogensulphide increase until solid FeS phases precipitate, removing Fe from thewater column. A prime example <strong>of</strong> this iron regime is found in the Black Sea[184,185]. Here oxic surface waters support low iron concentrations (1 nM),increasing to 70 nM in the suboxic zone (100 m) <strong>and</strong> to a maximum <strong>of</strong>300 nM in the mildly anoxic conditions at 200 m. Fe concentrations atgreater depths decline to 40 nM as a result <strong>of</strong> FeS precipitation. Similar pr<strong>of</strong>ileshave been found in other anoxic basins, such as silled fjords [185,186] <strong>and</strong> theBaltic Sea during the summer [187].4. IRON LIMITATION OF MARINE PRIMARY PRODUCTIVITYAND CONTROL ON ECOSYSTEM STRUCTUREPrevious sections <strong>of</strong> this chapter have discussed the biological requirement foriron, the chemical <strong>and</strong> physical limits on bioavailable iron supply, <strong>and</strong> thesources <strong>and</strong> internal cycling processes that determine the highly heterogeneousdistribution <strong>of</strong> iron in the oceans. Although it is perhaps possible to make qualitativepredictions about the primary productivity <strong>of</strong> various ocean regions basedon iron distributions alone, primary productivity is a function <strong>of</strong> many factors,<strong>and</strong> it does not necessarily follow that the productivity <strong>of</strong> Fe-impoverishedregions (such as the ocean gyres) is iron limited. To determine the extent towhich iron limitation controls primary productivity, <strong>and</strong> hence carbon exportto the deep ocean, it is necessary to consider the biogeochemical cycles <strong>of</strong>other major, potentially limiting plant nutrients (N, P, Si) <strong>and</strong> the processesthat control their distributions (e.g., remineralization, circulation), as well asother limiting factors, such as light <strong>and</strong> zooplankton grazing (Section 4.2).4.1. Evidence for the Role <strong>of</strong> <strong>Iron</strong> in Regulating Productivity inHigh Nutrient Low Chlorophyll RegionsZero or near-zero nitrate concentrations <strong>and</strong> very low phosphate concentrationshave been measured in summer in the subtropical gyres <strong>of</strong> all the major oceans<strong>and</strong> in the equatorial Atlantic <strong>and</strong> Indian Oceans, implying widespread N limitation<strong>of</strong> new production [156,188]. Other parts <strong>of</strong> the ocean, such as the NorthAtlantic above 508N, the Arabian Sea, <strong>and</strong> various coastal upwelling regions,have elevated nutrient concentrations (.2 mMNO 2 3 ) but also support high chlorophyllconcentrations (.0.5 mg m 23 ). In contrast to both the highly productive<strong>and</strong> the nutrient depleted ocean regions mentioned earlier, some 20–40% <strong>of</strong> the
0000-0-Sigel-ch07_R1_121004<strong>Iron</strong>, <strong>Phytoplankton</strong> <strong>Growth</strong>, <strong>and</strong> <strong>Carbon</strong> <strong>Cycle</strong> 171793794795796797798799800801802803804805806807808809810811812813814815816817818819820821822823824825826827828829830831832833834835836surface ocean is characterized by the year-round presence <strong>of</strong> nitrate (.2 mM) <strong>and</strong>phosphate combined with low chlorophyll concentrations (,0.5 mg L 21 ). Thesehigh nutrient, low chlorophyll (“HNLC”) conditions characterize areas <strong>of</strong> theeastern equatorial Pacific, subarctic Pacific, <strong>and</strong> the Southern Ocean. Each <strong>of</strong>these otherwise very different ocean regions occurs in a zone <strong>of</strong> divergentupwelling, which provides enough nutrients to support much higher levels <strong>of</strong>new production than are currently observed in these regions [34,151,189–193].HNLC regions are dominated by “small” ecosystems made up <strong>of</strong> pico- <strong>and</strong>nanophytoplankton (,5 mm) supported largely by recycled nutrients[34,151,191,194,195]. The availability <strong>of</strong> reduced N species (NH þ 4 , urea) limitsthe uptake <strong>of</strong> nitrate by phytoplankton, contributing to the large st<strong>and</strong>ingstocks <strong>of</strong> NO 2 3 that are the first indicator <strong>of</strong> HNLC conditions. Grazing communitiesin HNLC regions are typically comprised <strong>of</strong> microzooplankton capable <strong>of</strong>rapid doubling-rates, along with a smaller mesozooplankton component[156,191]. Not surprisingly, carbon cycling in HNLC ecosystems is characterizedby intense recycling in the euphotic zone <strong>and</strong> low f-ratios (0.07–0.2 in the EquatorialPacific) [196]. The relatively small export fluxes in these regions occurduring episodic diatom blooms [191,197–202].It has long been suggested that iron limitation plays a role in the HNLCregions [203,204]. The development <strong>of</strong> trace metal clean sampling techniquesin the 1980s made it possible to investigate this hypothesis. New, accuratemeasurements indeed revealed that iron concentrations in the HNLC regionswere extremely low, especially in the equatorial Pacific <strong>and</strong> Southern Ocean[34,151,152,174,175,205]. Other tell-tale signs included the distinct high productivity/lownitrate “wakes” seen downstream <strong>of</strong> l<strong>and</strong> features (such as theGalapagos Isl<strong>and</strong>s) in the HNLC regions, suggesting that some factor associatedwith l<strong>and</strong> was stimulating productivity [105,152,206]. The first experimental evidence<strong>of</strong> the importance <strong>of</strong> iron in controlling the productivity came from bottleincubation experiments conducted in the subarctic Pacific in the late 1980s[117,118]. These initial efforts have been confirmed with numerous additionalbottle incubations <strong>and</strong> exp<strong>and</strong>ed to include six mesoscale iron enrichment experimentscovering each <strong>of</strong> the three major HNLC regions (Fig. 4).4.1.1. Bottle Incubation ExperimentsEarly bottle incubation experiments in all three <strong>of</strong> the HNLC regions demonstratedthat nanomolar iron enrichment resulted in significant nutrient depletion,chlorophyll a increase, strong growth <strong>of</strong> larger phytoplankton, especiallydiatoms, <strong>and</strong> a somewhat delayed increase in net productivity, relative tocontrol samples [105,117,118,207–211]. Later studies confirmed <strong>and</strong> refinedthese results [106,158,212–219], documenting early physiological responsesby phytoplankton (increased 15 N uptake, nitrate reductase expression) to Feaddition [200,220], <strong>and</strong> showing that even picomolar additions <strong>of</strong> Fe couldproduce a measurable effect [174]. The incubation studies have demonstratedF4; Q1
0000-0-Sigel-ch07_R1_121004172 Street <strong>and</strong> Paytan837838839840841842843844845846847848849850851852853854855856857858859860861862863864865866867868869870871872873874875876877878879880Figure 4 The major high nitrate, low chlorophyll (HNLC) regions <strong>of</strong> the ocean. TheSouthern Ocean HNLC region is circumpolar.that the productivity <strong>and</strong> nutrient drawdown responses to Fe addition areaccompanied by large shifts in the phytoplankton flora, from communities dominatedby nano- <strong>and</strong> pico-sized phytoplankton, utilizing ammonium, to communitiesin which most <strong>of</strong> the biomass is composed <strong>of</strong> diatoms drawing on thelarge st<strong>and</strong>ing stocks <strong>of</strong> nitrate.In vitro incubations differ from actual ocean conditions in important waysthat limit the applicability <strong>of</strong> their results to marine ecosystems. The fixed lightintensity used in these experiments is a poor mimic <strong>of</strong> the variable conditions inthe ocean mixed layer, while the walls <strong>of</strong> the incubation bottles themselves mayprovide unnatural growth surfaces. Bottle experiments cannot hope to accuratelyrepresent that nature or scale <strong>of</strong> the community response [151]. The artificialrestriction on the abundance <strong>of</strong> grazers in bottle incubations, for instance, hasbeen <strong>of</strong>fered as an alternative (<strong>and</strong> confounding) explanation for the phytoplanktonblooms observed in these experiments [221–223]. In an effort to overcomethe limitations <strong>of</strong> bottle experiments, researchers have conducted a series <strong>of</strong>mesoscale in situ Fe enrichment experiments, in which large areas <strong>of</strong> thesurface ocean were seeded with iron <strong>and</strong> the ecosystem response measuredover many days.
0000-0-Sigel-ch07_R1_121004<strong>Iron</strong>, <strong>Phytoplankton</strong> <strong>Growth</strong>, <strong>and</strong> <strong>Carbon</strong> <strong>Cycle</strong> 1738818828838848858868878888898908918928938948958968978988999009019029039049059069079089099109119129139149159169179189199209219229239244.1.2. Mesoscale Enrichment ExperimentsTo date, seven in situ mesoscale iron enrichment experiments have been performedin the HNLC regions, each with its own acronym: IRONEX I <strong>and</strong> II inthe equatorial Pacific south <strong>of</strong> the Galapagos Isl<strong>and</strong>s; SOIREE, EisenEx, <strong>and</strong>SOFeX in various sectors <strong>of</strong> the Southern Ocean south <strong>of</strong> the Polar Front;SEEDS <strong>and</strong> SERIES in western <strong>and</strong> eastern gyres <strong>of</strong> the subarctic Pacific,respectively. The SOFeX experiment actually consisted <strong>of</strong> two separate enrichments,one in the high silica waters south <strong>of</strong> the Polar Front, the other in lowsilica waters to the north [224]. With important variations, the experimentshave followed the same basic approach: enrichment <strong>of</strong> a large patch(50–100 km 2 ) <strong>of</strong> low iron, HNLC surface water with enough ferrous sulfate toraise ambient iron concentrations to 1–4 nM, many times greater than preexperimentlevels; concurrent addition <strong>of</strong> the inert tracer sulfur hexaflouride(SF 6 ); monitoring <strong>of</strong> chemical, biological, <strong>and</strong> physical changes within theenriched patch for 2–4 weeks in comparison to nearby control areas.The ecosystem responses to iron enrichment in each <strong>of</strong> the experimentshave been dramatic, <strong>and</strong> strikingly similar to one another. After seven suchexperiments, a “classical” response to iron addition can now be outlined:(a) After the initial enrichment, dissolved iron concentrations declinerapidly, returning to pre-experiment levels within a few days unlessadditional enrichments are performed [33–35,151,224,225].(b) Photosynthetic efficiency, phytoplankton growth rate, chlorophyll aconcentration <strong>and</strong> primary productivity increase dramatically,reaching levels 2–6 times greater than those <strong>of</strong> control areas[33–35,151,224–227].(c) After a lag time <strong>of</strong> several days, a large, sustained, diatom-dominatedphytoplankton bloom develops, accounting for most <strong>of</strong> the observedincreases in primary productivity <strong>and</strong> new production [33–35,224,225,228,229].(d) Significant depletion <strong>of</strong> pCO 2 , [33–35,224,225,229–231] <strong>and</strong> majornutrients (nitrate, phosphate, silicate) [33–35,224,225,228] occurswithin surface waters <strong>of</strong> the patch.Based on these results, the mesoscale enrichment experiments have establishedthat iron plays a strong limiting role in each <strong>of</strong> the major HNLC regions <strong>of</strong> theocean. However, the apparent uniformity <strong>of</strong> the findings reported above masksimportant differences in the outcomes <strong>of</strong> the experiments—differences thatshed light on the structure <strong>and</strong> function <strong>of</strong> ecosystems in HNLC regions, <strong>and</strong>how they change in response to iron additions.4.1.2.1. Biological response: Unlike all the other enrichment experiments,IRONEX I did not stimulate a sustained phytoplankton bloom. Thebiological response, consisting <strong>of</strong> increases in photosynthetic efficiency,primary productivity, <strong>and</strong> chlorophyll a, was largely confined to an extant
0000-0-Sigel-ch07_R1_121004174 Street <strong>and</strong> Paytan925926927928929930931932933934935936937938939940941942943944945946947948949950951952953954955956957958959960961962963964965966967968“small” community dominated by Synechococcus bacteria, picoplankton, <strong>and</strong>autotrophic din<strong>of</strong>lagellates; diatoms comprised only a small component <strong>of</strong> thecommunity (17% <strong>of</strong> biomass), <strong>and</strong> increased in abundance only in proportionto other groups. The bloom had essentially ceased after day 3 <strong>of</strong> the experiment[151,226]. Similar initial responses (days 1–6) in the extant phytoplanktoncommunity were observed in other enrichment experiments, notably IRONEXII, but were eventually superseded by large diatom blooms.The early termination <strong>of</strong> the IRONEX I bloom was probably the result <strong>of</strong>several interrelated factors. The experiment’s single iron addition was more orless exhausted by day 3, at which time the enriched patch was subducted below alow-salinity front to a depth <strong>of</strong> .30 m, where it remained for the duration <strong>of</strong> thestudy. Under these conditions, a diatom bloom could not develop. At the sametime, stimulation <strong>of</strong> the extant phytoplankton community was met with a rapidresponse by microzooplankton grazers, which quickly <strong>and</strong> efficiently recycled theincreased productivity [151,156]. Similar food web effects were observed inother enrichment experiments. In SOIREE, for instance, small grazers effectivelylimited bacterial abundance, in spite <strong>of</strong> increased productivity. However, zooplanktonherbivory appears to have concentrated on cells <strong>of</strong> ,20 mm diameter, with littleimpact on the larger diatoms [34]. In experiments that used multiple additions tosustain elevated iron concentrations for more than a few days, significant diatomgrowth occurred in spite <strong>of</strong> increased grazing activity [33,34,224,225].Among the experiments that stimulated sustained blooms, initial differenceswithin the biological communities strongly influenced the character <strong>of</strong>the eventual bloom. The biological response in IRONEX II was quickly dominatedby fast-growing pennate diatoms [33], whereas in SOIREE the large(30–50 mm) chain-diatom Fragilariopsis kerguelenis accounted for 75% <strong>of</strong>primary productivity [34]. During EisenEx <strong>and</strong> SOFeX North, diatoms <strong>of</strong> thegenus Pseudonitzschia showed the largest increases in abundance [224,228].Prior to each <strong>of</strong> the experiments, these species, <strong>and</strong> diatoms in general, hadbeen minor components <strong>of</strong> the biota. In contrast, the subarctic Pacific region inwhich SEEDS was performed included a considerable contingent <strong>of</strong> microsizedspecies (36% <strong>of</strong> chlorophyll a), chiefly the pennate diatom Pseudonitzschiaturgidula, but the Fe-induced bloom was dominated by an entirely differentspecies, the chain-forming centric diatom Chaetoceros debilis, which had beenpresent but rare in the pre-addition assemblage. Despite cold water temperatures,C. debilis achieved a high net growth rate <strong>of</strong> 2.6 doublings/day at the peak <strong>of</strong> thebloom, almost twice the observed growth rate <strong>of</strong> the dominant pennate diatoms inIRONEX II <strong>and</strong> the net algal growth rate in SOIREE [33–35]. Although diatomblooms are now an expected response to sustained iron fertilization, the composition<strong>of</strong> such blooms, <strong>and</strong> any secondary ecological responses dependent onspecies composition, is not yet predictable.4.1.2.2. Biogeochemical response: The rapid loss <strong>of</strong> dissolved ironfollowing the first <strong>and</strong> only addition in IRONEX I, attributable to Fe(II)oxidation, physical mixing, particle scavenging, <strong>and</strong> biological uptake [151],
0000-0-Sigel-ch07_R1_121004<strong>Iron</strong>, <strong>Phytoplankton</strong> <strong>Growth</strong>, <strong>and</strong> <strong>Carbon</strong> <strong>Cycle</strong> 1759699709719729739749759769779789799809819829839849859869879889899909919929939949959969979989991000100110021003100410051006100710081009101010111012prompted the use <strong>of</strong> multiple-additions in subsequent studies [33,34,224,228]. InSOIREE, this strategy eventually resulted in a stable, elevated Fe concentration(1 nM) that lasted from the fourth addition on day 7 to the end <strong>of</strong> the experimenton day 13. These stable dissolved Fe concentrations may have beenrelated to a substantial increase in the concentrations <strong>of</strong> Fe-binding lig<strong>and</strong>sover the course <strong>of</strong> the experiment (3.5–8.5 nM) [34].The failure <strong>of</strong> a diatom bloom to develop in IRONEX I was matched by anegligible drawdown <strong>of</strong> nitrate, phosphate, <strong>and</strong> silicate within the enriched patch[151]. In contrast, the major blooms induced by the other experiments wereaccompanied by substantial macronutrient uptake, ranging from 10% to 30%depletion during EisenEx [228], through 55% depletion <strong>of</strong> nitrate in SEEDS[35], to 80% depletion <strong>of</strong> silicate in IRONEX II [33]. These results highlightthe importance <strong>of</strong> diatoms in controlling the biogeochemical outcomes <strong>of</strong> enrichmentexperiments. It is important to note, however, that Fe-induced macronutrientdrawdown in these experiments was in most cases incomplete. Thoughdepleted relative to controls, nitrate levels remained above limiting levels(3–25 mM) at the end <strong>of</strong> all <strong>of</strong> the experiments [33–35,151,224,225,228]. Secondarysilicate limitation may have played a role in suppressing the IRONEX II,SERIES, <strong>and</strong> SOFeX North diatom blooms, based on the near-limiting concentrations(1 mM) measured toward the ends <strong>of</strong> these experiments [33,224,225],but did not appear to play a role in the other experiments. By the end <strong>of</strong>SOIREE, none <strong>of</strong> the macronutrients appear to have been depleted to growthlimitinglevels, in spite <strong>of</strong> the fact that dissolved Fe concentrations in the patchremained ten times those in control areas. Meanwhile, diatoms were accumulatingflavodoxin at increasing levels [34]. This evidence suggests that even at theenriched concentrations achieved during SOIREE <strong>and</strong> the other enrichmentexperiments, bioavailable iron levels remained limiting.Notably absent from the list <strong>of</strong> general HNLC ecosystem responses to ironenrichments is an increase in the export <strong>of</strong> carbon from the surface layer. Each <strong>of</strong>the fully-developed Fe-enrichment responses has been characterized by CO 2uptake <strong>and</strong> increased POC concentrations in the surface layer [33–35,224,225,229,230]; however, in most experiments this did not translate into increasedexport flux relative to control areas. The exceptions, SOFeX, <strong>and</strong> SERIES,were the experiments monitored for the longest periods (4 weeks), implyingthat the export flux response is delayed, <strong>and</strong> may have gone unobserved in theaftermaths <strong>of</strong> the shorter experiments. In SOFeX South, a small but significantenhancement in particle export was measured. A rate <strong>of</strong> 10 mmol m 22 day 21inside the patch amounted to 2100 tons <strong>of</strong> POC exported to 100 m depth bythe end <strong>of</strong> the monitoring period [224,232]. An autonomous drifter employedin the SOFeX North experiment also observed significant, two- to sixfoldbuild-up <strong>and</strong> export <strong>of</strong> POC from the enriched patch, although vigorousmixing made this result difficult to interpret [233].During the SERIES bloom decline, the surface layer (,25 m) lost 75–79% <strong>of</strong>the POC <strong>and</strong> PSi inventories that had accumulated during the bloom. These declinescorresponded to an eightfold increase in the amount <strong>of</strong> material—mostly diatom
0000-0-Sigel-ch07_R1_121004176 Street <strong>and</strong> Paytan10131014101510161017101810191020102110221023102410251026102710281029103010311032103310341035103610371038103910401041104210431044104510461047104810491050105110521053105410551056cells, aggregates, <strong>and</strong> fecal pellets—reaching 50 m sediment traps. This export flux,totaling 47 mmol m 22 POC, nonetheless accounted for only 18% <strong>of</strong> the POC lossfrom the surface layer, <strong>and</strong> an even smaller fraction (8%) was detected below thepermanent thermocline at 125 m depth. The bulk <strong>of</strong> the particulate material producedby the bloom was lost to herbivory, dissolution (in the case <strong>of</strong> PSi), <strong>and</strong>above all, bacterial remineralization within <strong>and</strong> below the mixed layer [225] (Fig. 5).4.1.3. Evidence <strong>of</strong> <strong>Iron</strong> Limitation from Other RegionsAlthough most iron limitation studies have thus far focused on open ocean HNLCregions, a growing body <strong>of</strong> work suggests that iron availability can play acontrolling role in other marine systems. The strongest evidence for this role,surprisingly, comes from coastal <strong>and</strong> near-coastal systems, which are generallyassumed to be Fe-rich thanks to their proximity to iron sources (rivers,Figure 5 Sea-Viewing Wide Field-<strong>of</strong>-View Sensor (SeaWiFS) satellite image <strong>of</strong> aniron-induced phytoplankton bloom in the Southern Ocean. The bloom is apparent as achlorophyll maximum near the center <strong>of</strong> the image (668S, 1728E); large, contiguouswhite areas represent cloud cover. The image was captured on day 20 <strong>of</strong> the SOFeXsouth patch experiment. Coordinates are degrees South <strong>and</strong> East. Courtesy <strong>of</strong> the NASASeaWiFS Project <strong>and</strong> the Goddard Earth Sciences Data <strong>and</strong> Information ServicesCenter/Distributed Active Archive Center.F5; Q1
0000-0-Sigel-ch07_R1_121004<strong>Iron</strong>, <strong>Phytoplankton</strong> <strong>Growth</strong>, <strong>and</strong> <strong>Carbon</strong> <strong>Cycle</strong> 17710571058105910601061106210631064106510661067106810691070107110721073107410751076107710781079108010811082108310841085108610871088108910901091109210931094109510961097109810991100continental shelves, continental dust sources, etc.). <strong>Iron</strong> stress, however, is a functionnot only <strong>of</strong> ambient iron concentration but also the cellular iron requirements<strong>of</strong> phytoplankton species. In coastal regions, where many phytoplankton speciesare known to require relatively large amounts <strong>of</strong> iron to support optimal growth[5], iron stress can occur at concentrations that in open ocean regions would beconsidered replete.Recent work in the California coastal upwelling region demonstrates thatvariation in iron distribution on fairly small geographic scales plays a criticalrole in determining community structure <strong>and</strong> the development <strong>of</strong> phytoplanktonblooms. Hutchins et al. used field observations to define a spectrum <strong>of</strong> ecosystemtypes in the coastal zone (10–20 km <strong>of</strong>fshore) based on Fe availability <strong>and</strong> phytoplanktonassemblage, ranging from Fe-replete regimes in which diatom bloomsdominate primary production to regimes under severe iron stress in whichdiatoms are absent, <strong>and</strong> the growth <strong>of</strong> even the smaller size classes is inhibited[181]. Other studies have related this heterogeneous Fe distribution to thepresence or absence <strong>of</strong> a continental shelf iron source for upwelled water[148,234], while others explored seasonal variations in the delivery <strong>of</strong> iron tothe surface in upwelled water, demonstrating that low iron conditions in thesummer result in HNLC-like conditions in <strong>of</strong>fshore areas [153] <strong>and</strong> that highdissolved Fe concentrations in upwelled water influences the extent <strong>of</strong> macronutrientdrawdown in subsequent phytoplankton blooms [147].Elsewhere, Hutchins et al. performed shipboard iron incubation experimentsin the high-nutrient eastern boundary current regime <strong>of</strong>f the west coast<strong>of</strong> South America, measuring low ambient iron concentrations (0.1 nM) <strong>and</strong>demonstrating that a broad range <strong>of</strong> indicators, including photosynthetic efficiency,macronutrient depletion, <strong>and</strong> chlorophyll a increased in proportion tothe amount <strong>of</strong> iron added [235]. Low, near-limiting concentrations <strong>of</strong> iron havebeen measured in the summer in the North Atlantic under stratified, postbloomconditions [71], <strong>and</strong> <strong>of</strong>f the Oregon coast [183], while Fe has beenshown to affect fluorescence patterns <strong>and</strong> photochemical quantum efficiencyamong phytoplankton in the South Pacific gyre [236]. Combined with the evidencefrom the coastal upwelling systems, this has given rise to speculationthat iron limitation, at least seasonally, is more widespread than previouslyassumed [156].4.2. Interaction <strong>of</strong> <strong>Iron</strong> with Other Limiting FactorsEven in the HNLC regions, it is unlikely that iron alone limits phytoplankton production.A more accurate conceptual model <strong>of</strong> ocean productivity will probablyinvolve co-limitation by multiple factors, several <strong>of</strong> which are discussed here.Within the pico- <strong>and</strong> nanophytoplankton-dominated recycling ecosystems<strong>of</strong> the HNLC regions, microzooplankton populations have been observed toachieve very high growth rates, matching or exceeding those <strong>of</strong> their foodsources [223]. As a result, these grazers can respond to <strong>and</strong> quickly decimate
0000-0-Sigel-ch07_R1_121004178 Street <strong>and</strong> Paytan11011102110311041105110611071108110911101111111211131114111511161117111811191120112111221123112411251126112711281129113011311132113311341135113611371138113911401141114211431144nanophytoplankton blooms, as appears to have been the case in IRONEX I [151].While iron is undoubtedly a limiting factor for these “small” phytoplankton, ashas been clearly demonstrated in enrichment experiments [33–35,151,226,227], in many cases it is possible that microzooplankton grazing is the directlimit on the abundance <strong>of</strong> the dominant members <strong>of</strong> the extant community. Bythis line <strong>of</strong> reasoning, iron limitation, with its disproportionate suppression <strong>of</strong>the larger members <strong>of</strong> the phytoplankton flora, in effect creates an ecosystemin which grazing is the immediate limitation on productivity, if not new production.An addition <strong>of</strong> iron to this type <strong>of</strong> system would, among other things,stimulate the growth <strong>of</strong> diatoms, which are too large to be easily grazed by thefast-acting microzooplankton grazers; a bloom develops, <strong>and</strong> cannot be fullycontained by the slower-responding mesozooplankton grazers [156].The polar darkness that prevails for much <strong>of</strong> the year is the overwhelmingfeature <strong>of</strong> the Southern Ocean environment, the factor to which all other limits onphytoplankton growth are merely additive. Even in the Antarctic summer, whenthe sun is out for much <strong>of</strong> the 24 h period, the deep, turbulent mixed layer,frequent cloud cover, <strong>and</strong> low angle <strong>of</strong> the sun can combine to impose somedegree <strong>of</strong> light limitation on Southern Ocean <strong>and</strong> subantarctic ecosystems[237–239]. To a lesser extent, light limitation is a limiting factor in the subarcticPacific, especially in the winter [67]. <strong>Iron</strong> limitation compounds the growth limitingeffect <strong>of</strong> low light conditions because <strong>of</strong> the importance <strong>of</strong> Fe in electrontransfer <strong>and</strong> the synthesis <strong>of</strong> chlorophyll. <strong>Iron</strong>-stressed cells exhibit lower photosyntheticcompetence, <strong>and</strong> are less able to utilize limited light resources [156].Conversely, it has been noted in several studies that iron use efficiency is proportionalto illumination [30,217,240], implying that ambient iron concentrationsthat are adequate under high light conditions may be suboptimal in a low-lightregime. In this way iron <strong>and</strong> light limitation can be expected to reinforce oneanother in situations where they coincide.Low silicate concentrations have been measured in several HNLC regions,notably the eastern equatorial Pacific <strong>and</strong> subantarctic Southern Ocean north <strong>of</strong>the Polar Front [188,224,239,241,242], giving rise to the theory that silicateavailability limits diatom growth, primary productivity, <strong>and</strong> carbon export fluxin these regions [242,243]. The case for silicate rests on the special importance<strong>of</strong> diatoms, which construct their mineral shells from dissolved silicate, in controllingparticle fluxes from otherwise efficient recycling ecosystems. As resistant,largely undigestable hard parts, siliceous frustules are likely be packagedwith other recalcitrant materials into zooplankton fecal pellets or be directlyexported, unrecycled, from the surface layer, resulting in a differential loss <strong>of</strong> silicatefrom the system [241]. Dugdale <strong>and</strong> Wilkerson [242] found that the magnitude<strong>of</strong> new production in the eastern equatorial Pacific upwelling zone is afunction <strong>of</strong> silicate supply in upwelled waters rather than nitrate supply, <strong>and</strong>almost entirely supported by diatom growth. The authors suggest that silicatelimits new production in the primary upwelling zone, a narrow b<strong>and</strong> along theequator, while iron is the limiting factor in the equatorial currents to the north
0000-0-Sigel-ch07_R1_121004<strong>Iron</strong>, <strong>Phytoplankton</strong> <strong>Growth</strong>, <strong>and</strong> <strong>Carbon</strong> <strong>Cycle</strong> 17911451146114711481149115011511152115311541155115611571158115911601161116211631164116511661167116811691170117111721173117411751176117711781179118011811182118311841185118611871188<strong>and</strong> south, including the region occupied in the IRONEX experiments [242].Bottle enrichments with silica performed in conjunction with the SOFeX NorthFe experiment in the Subantarctic Southern Ocean stimulated massive increasesin silica uptake, indicating that Si limitation in this low-silicate region (,5 mM)contributed to relatively low diatom abundance (,50%) in the Fe-inducedphytoplankton bloom [224]. The growth <strong>of</strong> other, non-siliceous groups was notlimited, however, <strong>and</strong> it is unclear what effect bloom composition had onobserved carbon export [224,233].The intriguing prospect <strong>of</strong> Fe–Si co-limitation is supported by the observationthat diatoms under iron stress <strong>of</strong>ten have Si : N ratios well above those<strong>of</strong> diatoms grown in Fe-rich conditions [43,156]. If this observation holds, it isconceivable that low iron conditions could induce silicate limitation, or conversely,high silicate availability could permit diatoms to grow at Fe concentrationsthat would otherwise be limiting [156]. Secondary limitation by silica appears tohave played a part in the decline <strong>of</strong> iron-induced diatom blooms in the IRONEXII <strong>and</strong> SERIES enrichment experiments [33,225], but not, surprisingly, in SOFeXNorth, where a small but consistent silicate source to the Fe-enriched patch fromphysical mixing allowed the bloom to persist for .50 days [224].The high iron requirement for nitrogen fixation <strong>and</strong> diazotrophic growth(Section 1.1) has led to the theory that iron limitation explains the low abundance<strong>of</strong> Trichodesmium spp. cyanobacteria (the dominate N-fixer in the ocean) in lownitrate, low chlorophyll ocean areas, such as the South Pacific gyre, which are farremoved from atmospheric iron sources [244]. More generally it has been proposedthat iron availability limits N-fixation on a global scale [244–246], withlarge impacts on the net flux <strong>of</strong> CO 2 into the oceans [244]. Recent evidencefor this theory includes the 100-fold increase in Trichodesmium biomassmeasured after a summer dust storm in waters <strong>of</strong> the West Florida Shelf [247]<strong>and</strong> the low cellular iron quotas, quantum yields, <strong>and</strong> N-fixation rates measuredin Trichodesmium cultures grown under low Fe-conditions [248]. Berman-Frank et al. further estimate that iron availability limits nitrogen fixation byTrichodesmium over 75% <strong>of</strong> the ocean [248].The evidence presented in the preceding sections leads to the conclusionthat iron limitation <strong>of</strong> productivity in the oceans is both more <strong>and</strong> less than ithas been made out to be in previous accounts. <strong>Iron</strong> limitation is more widespreadthan once imagined, playing a critical role in not only the HNLC regions but alsoin many other ocean regions through interactions with other limiting factors. Atthe same time, it is clear that even within the HNLC regions, iron limitation is butone <strong>of</strong> several factors determining the character <strong>of</strong> an ecosystem, exerting agreater or lesser influence depending on conditions (light, availability <strong>of</strong> othernutrients, weather <strong>and</strong> currents, ecology) that may vary greatly over short distances<strong>and</strong> timescales. Moreover, iron enrichment experiments have demonstratedthat iron limitation is inextricably linked to the composition <strong>and</strong>function <strong>of</strong> dynamic biological communities, adapted to low iron conditions,that both respond to <strong>and</strong> modulate the availability <strong>of</strong> iron.
0000-0-Sigel-ch07_R1_121004180 Street <strong>and</strong> Paytan118911901191119211931194119511961197119811991200120112021203120412051206120712081209121012111212121312141215121612171218121912201221122212231224122512261227122812291230123112324.3. <strong>Carbon</strong> Export <strong>and</strong> <strong>Iron</strong> FertilizationIn contrast to the primary productivity response, export production in HNLCregions appears to increase only modestly as a result <strong>of</strong> iron additions. Only inthe more recent, longer-term enrichment studies (SERIES, SOFeX) did ironstimulation <strong>of</strong> primary productivity result in measurable increases in export productionwithin the timeframe <strong>of</strong> the experiments. During a six day span towardthe end <strong>of</strong> SERIES, POC export flux reached 47 mmol m 22 at 50 m <strong>and</strong>21 mmol m 22 at 125 m [225], translating into an export efficiency <strong>of</strong> 8% thatis in many cases smaller than those following naturally-occurring blooms inHNLC regions [249,250]. If the measured POC flux at 125 m is extrapolated tothe entire 1000 m 2 SERIES enriched patch, the total C export over the 6 dayperiod is only 252 tons C. During SOFeX South, a total addition <strong>of</strong> 1.3 tons <strong>of</strong>Fe resulted in 2100 tons C exported to 100 m, an Fe-addition to C exportratio <strong>of</strong> only 1.3 10 24 [232].This is bad news for geoengineering proposals see Ref. [251] to sequesteranthropogenic carbon dioxide through iron fertilization <strong>of</strong> HNLC regions, whichhave relied on lab-based Fe : C ratios two orders <strong>of</strong> magnitude lower to bolstertheir claims <strong>of</strong> potential CO 2 uptake. Extrapolating from the SOFeX ratios,Buesseler <strong>and</strong> Boyd estimate that an ocean area <strong>of</strong> 1 billion km 2 , larger thanthe entire Southern Ocean, would have to be fertilized with over 1 million tons<strong>of</strong> Fe to transfer enough POC to 100 m to <strong>of</strong>fset 30% <strong>of</strong> annual anthropogeniccarbon emissions [231]. A further blow to proponents <strong>of</strong> iron fertilization camefrom the work <strong>of</strong> Law <strong>and</strong> Ling, who in the aftermath <strong>of</strong> the SOIREE bloommeasured a substantial increase in N 2 O production, enough to <strong>of</strong>fset a significantportion <strong>of</strong> the radiactive forcing (if any) resulting from Fe-stimulated carbonfixation [252]. Putting aside for a moment the host <strong>of</strong> serious <strong>and</strong> unpredictableecological side effects <strong>of</strong> large-scale iron fertilization [251], the practical, economic,<strong>and</strong> scientific barriers alone would make such an enterprise inadvisable.5. THE ROLE OF IRON IN REGULATING ATMOSPHERIC CO 25.1. The <strong>Iron</strong> HypothesisAs originally articulated by Martin [253] 15 years ago, the iron hypothesis is asimple but powerful theory, in two parts: (a) <strong>Phytoplankton</strong> growth, <strong>and</strong> hence,carbon export, in the HNLC regions is presently limited by the insufficient availability<strong>of</strong> iron; (b) Increased delivery <strong>of</strong> iron via more vigorous transport <strong>and</strong>deposition <strong>of</strong> atmospheric dust, particularly to the Southern Ocean, enhanced biologicalproductivity during past ice ages, <strong>and</strong> caused or contributed to the lowCO 2 concentrations <strong>and</strong> cold climates inferred for these glacial periods. Thatiron availability, directly <strong>and</strong> through its control <strong>of</strong> ecosystem structure, limitsproductivity in many parts <strong>of</strong> the ocean has been convincingly established innumerous studies, <strong>and</strong> the more recent enrichment experiments have demonstratedat least a modest effect on export production (Section 4.3). The second
0000-0-Sigel-ch07_R1_121004<strong>Iron</strong>, <strong>Phytoplankton</strong> <strong>Growth</strong>, <strong>and</strong> <strong>Carbon</strong> <strong>Cycle</strong> 18112331234123512361237123812391240124112421243124412451246124712481249125012511252125312541255125612571258125912601261126212631264126512661267126812691270127112721273127412751276tenet <strong>of</strong> Martin’s hypothesis, however, is more problematic, <strong>and</strong> remains at thecenter <strong>of</strong> debate among those studying glacial–interglacial climate changes.This section will introduce aspects <strong>of</strong> the debate, <strong>and</strong> evaluate the iron hypothesisas a driver <strong>of</strong> global change.5.2. Changes in Dust Input <strong>and</strong> Productivity in Glacial PeriodsRecords <strong>of</strong> atmospheric dust input to the ocean over glacial–interglacial cycles,from marine sediments, loess deposits, <strong>and</strong> cores from continental <strong>and</strong> polar icesheets, are in better agreement with one another, revealing far greater aerosolgeneration, transport, <strong>and</strong> deposition during glacial maxima than interglacials[254–257]. Based on an extensive global compilation <strong>of</strong> marine sedimentrecords, Rea argued that these increases in dust deposition were restrictedlargely to the northern hemisphere, with little transport to the southern hemispherefrom northern dust sources through the wet deposition belt <strong>of</strong> the ITCZ[256]. Nonetheless, Petit et al. have reconstructed substantial increases in dustdeposition to Antarctica during the last four glacial periods based on the420,000-year Vostock ice core records from East Antarctica [258]. Theseincreases were large, 20–40 times greater than interglacial backgrounds, <strong>and</strong>were tentatively traced to a source region, the Patagonian plain <strong>of</strong> SouthAmerica [258,259]. It seems reasonable to assume that corresponding increasesin dust input occurred over large portions <strong>of</strong> the Southern Ocean. This conclusionis also supported by modeling efforts that reproduce the observed patterns <strong>and</strong>magnitudes <strong>of</strong> dust deposition to the oceans at the last glacial maximum[138,260–262].Despite significant evidence for high dust deposition during glacials theevidence in the marine sedimentary record for increased oceanic productivity<strong>and</strong> carbon export during glacial stages is mixed, <strong>and</strong> is complicated by differencesamong the various proxies used to reconstruct paleoproductivity. In theequatorial Pacific, for instance, different proxies, applied to sediment coresfrom various locations, yield conflicting results, suggestive <strong>of</strong> a high degree <strong>of</strong>mesoscale variability in space <strong>and</strong> time [263–266]. Similar complexity is apparentin the Southern Ocean, <strong>and</strong> here also there is mixed evidence indicating bothregion-wide increases <strong>and</strong> decreases in productivity during glacial stages[137,267–270]. Though some proxy records indicate that export production inthe subantarctic zone was greater during glacials, consistent with a northwardshift in the high productivity b<strong>and</strong> [137,268,270], this enhanced export maynot match interglacial export levels south <strong>of</strong> the polar front [268]. Making thetenuous assumption that the findings <strong>of</strong> the SERIES <strong>and</strong> SOFeX enrichmentexperiments can be applied to broader regions <strong>and</strong> timescales, it is possiblethat elevated primary productivity in HNLC regions during glacials was notmatched by a corresponding significant increase in export production, or forthat matter, long-term storage <strong>of</strong> atmospheric carbon.
0000-0-Sigel-ch07_R1_121004182 Street <strong>and</strong> Paytan127712781279128012811282128312841285128612871288128912901291129212931294129512961297129812991300130113021303130413051306130713081309131013111312131313141315131613171318131913205.3. Consequences for Atmospheric CO 2 <strong>and</strong> Global ClimateCould an increased supply <strong>of</strong> iron, driven by increased atmospheric dust deposition<strong>and</strong> perhaps facilitated by transport <strong>of</strong> “dust fertilized waters” to theSouthern Ocean via thermohaline circulation [156,271], account for lower atmosphericCO 2 concentrations during glacial periods? Not surprisingly, the answerdepends on who is being asked, <strong>and</strong> on the assumptions <strong>and</strong> methods used toaddress the question. Much discussion has focused on the apparent sequence inproxy records <strong>of</strong> the key processes thought to amplify orbital forcing <strong>and</strong>induce the transition between glacial <strong>and</strong> interglacial states. Interpreted fromthe Vostock ice core record, glacial terminations appear to occur in two stages,the first characterized by increases in temperature <strong>and</strong> atmospheric concentrations<strong>of</strong> CO 2 <strong>and</strong> CH 4 , <strong>and</strong> decreases in dust input, the second by continuedtemperature rise, along with a rapid increase in methane <strong>and</strong> a decline in icevolume [258]. This implies that greenhouse gas concentrations led deglaciationas a feedback on orbitally-triggered climate changes, <strong>and</strong> that dust-drivenincreases in Fe input were a potential control on greenhouse gases via the biologicalpump. In a more detailed analysis <strong>of</strong> glacial termination II (135 ky BP) inthe Vostock record, Broecker <strong>and</strong> Henderson argue that Southern Ocean processesdrove the observed, coupled increase in atmospheric CO 2 <strong>and</strong> Antarctictemperature over an 8000-year period, bounded at the outset by a drop in dustflux <strong>and</strong> at the end by a decline in global ice volume. However, because much<strong>of</strong> the decline in dust preceded the initiation <strong>of</strong> the change in CO 2 concentration,<strong>and</strong> because the CO 2 continued to increase for thous<strong>and</strong>s <strong>of</strong> years after dust depositionhad settled at interglacial levels, iron control <strong>of</strong> CO 2 concentration is,at first glance, considered unlikely [272].The iron hypothesis can still explain the termination II ice core record withthe help <strong>of</strong> two additional “corollaries”, both <strong>of</strong> which are supported by availableevidence. It has been observed that the dissolved iron concentration in surfacewaters is not linearly related to dust input [108,116,171]; as aerosol loadingincreases, the percent <strong>of</strong> aerosol iron that actually dissolves decreases, perhapsdue to particle concentration effects, increased scavenging rates, or exhaustion<strong>of</strong> the available pool <strong>of</strong> unbound organic lig<strong>and</strong>s. Whatever the cause, this saturationeffect provides a plausible explanation for the lag-time between dust inputdeclines <strong>and</strong> the onset <strong>of</strong> the CO 2 increase in the Vostock core [272]. The second“corollary” invokes the suspected role <strong>of</strong> iron availability in limiting nitrogen fixationas discussed in Section 4.2. High atmospheric iron inputs in glacial times toN-limited open ocean areas, such as the subtropical gyres, would presumablyhave resulted in higher rates <strong>of</strong> N-fixation <strong>and</strong> new production [273–275]. Intheory, the several thous<strong>and</strong> year oceanic residence time <strong>of</strong> nitrate would haveallowed this increased supply to be spread through the ocean via thermohalinecirculation <strong>and</strong> upwelling, sustaining productivity even after dust inputs fell<strong>of</strong>f, <strong>and</strong> preventing a rapid rise in atmospheric CO 2 [272]. This explanationdoes not account for the fact that an increased supply <strong>of</strong> fixed nitrate would
0000-0-Sigel-ch07_R1_121004<strong>Iron</strong>, <strong>Phytoplankton</strong> <strong>Growth</strong>, <strong>and</strong> <strong>Carbon</strong> <strong>Cycle</strong> 18313211322132313241325132613271328132913301331133213331334133513361337133813391340134113421343134413451346134713481349135013511352135313541355135613571358135913601361136213631364probably lead to limitation by phosphate, which is nearly as scarce as nitrate overmuch <strong>of</strong> the ocean, <strong>and</strong> lacks a strong atmospheric source [82,275].The iron hypothesis is just one <strong>of</strong> many plausible explanations for atmosphericcarbon dioxide fluctuations over glacial–interglacial cycles. Competingtheories invoke everything from increased surface stratification in the SouthernOcean [276] through changes in the flux <strong>of</strong> calcite to marine sediments [277]to a “silica hypothesis”, in which increased atmospheric supply <strong>of</strong> silica duringglacials stimulated diatom growth [278,279]. In all likelihood, atmosphericCO 2 concentrations over long timescales are the net result <strong>of</strong> many factorsacting together or antagonistically.Assuming for a moment that iron supply to the ocean does indeed play arole in regulating the carbon cycle on glacial–interglacial timescales, the questionbecomes how large a role that is. Models based on the current magnitude<strong>of</strong> HNLC conditions in the Southern Ocean have shown that utilization <strong>of</strong> 50%<strong>of</strong> the st<strong>and</strong>ing stock <strong>of</strong> nutrients from surface waters would result in a CO 2 drawdownto levels matching glacial minima [275,280]. This increase in macronutrientutilization is large, but consistent with some proxy evidence from the lastglacial maximum [281] <strong>and</strong> comparable with nutrient drawdowns observed inpresent day Fe enrichment experiments. In the glacial Southern Ocean, biologicalnutrient uptake would also presumably be freed from secondary Si limitation byhigher rates <strong>of</strong> atmospheric silica deposition [278]. Modeling by Watson et al., onthe basis <strong>of</strong> observed uptake values for CO 2 <strong>and</strong> Si : C during SOIREE, suggeststhat the observed decline in iron input to the Southern Ocean at the last glacial–interglacial transition can account for the initial 40 ppm <strong>of</strong> CO 2 increase(roughly 50%), with other mechanisms responsible for the remaining increaseto Holocene concentrations [282]. Other models, making different assumptions,yield different results; perhaps the only certainty at this point is that the role <strong>of</strong>iron in controlling the oceanic carbon cycle will be studied <strong>and</strong> debated foryears to come.6. SUMMARY AND CONCLUSIONS<strong>Iron</strong> is an essential nutrient for all living organisms. <strong>Iron</strong> is required for the synthesis<strong>of</strong> chlorophyll <strong>and</strong> <strong>of</strong> several photosynthetic electron transport proteins <strong>and</strong>for the reduction <strong>of</strong> CO 2 ,SO 22 4 , <strong>and</strong> NO 2 3 during the photosynthetic production<strong>of</strong> organic compounds. <strong>Iron</strong> concentrations in vast areas <strong>of</strong> the ocean are very low(,1 nM) due to the low solubility <strong>of</strong> iron in oxic seawater. Low iron concentrationshave been shown to limit primary production rates, biomass accumulation,<strong>and</strong> ecosystem structure in a variety <strong>of</strong> open-ocean environments,including the equatorial Pacific, the subarctic Pacific <strong>and</strong> the Southern Ocean<strong>and</strong> even in some coastal areas.Oceanic primary production, the transfer <strong>of</strong> carbon dioxide into organiccarbon by photosynthetic plankton (phytoplankton), is one process by which
0000-0-Sigel-ch07_R1_121004184 Street <strong>and</strong> Paytan13651366136713681369137013711372137313741375137613771378137913801381138213831384138513861387138813891390139113921393139413951396139713981399140014011402140314041405140614071408atmospheric CO 2 can be transferred to the deep ocean <strong>and</strong> sequestered for longperiods <strong>of</strong> time. Accordingly, iron limitation <strong>of</strong> primary producers likely playsa major role in the global carbon cycle. It has been suggested that variations inoceanic primary productivity, spurred by changes in the deposition <strong>of</strong> iron inatmospheric dust, control atmospheric CO 2 concentrations, <strong>and</strong> hence globalclimate, over glacial–interglacial timescales.A contemporary application <strong>of</strong> this “iron hypothesis” promotes the largescaleiron fertilization <strong>of</strong> ocean regions as a means <strong>of</strong> enhancing the ability <strong>of</strong>the ocean to store anthropogenic CO 2 <strong>and</strong> mitigate 21st century climatechange. Recent in situ iron enrichment experiments in the HNLC regions,however, cast doubt on the efficacy <strong>and</strong> advisability <strong>of</strong> iron fertilizationschemes. The experiments have confirmed the role <strong>of</strong> iron in regulatingprimary productivity, but resulted in only small carbon export fluxes to thedepths necessary for long-term sequestration. Above all, these experiments <strong>and</strong>other studies <strong>of</strong> iron biogeochemistry over the last two decades have begun toillustrate the great complexity <strong>of</strong> the ocean system. Attempts to engineer thissystem are likely to provoke a similarly complex, unpredictable response.ACKNOWLEDGMENTSRochelle Labiosa, Zanna Chase, Pete Strutton, Joe Cackler, <strong>and</strong> Karrie Amslerprovided valuable assistance during the preparation <strong>of</strong> this chapter.ABBREVIATIONSATP adenosine 5 0 -triphosphateEisenEx Eisen (“iron”) Experiment (Southern Ocean)Fe(II) 0 all inorganic Fe(II) speciesFe(III) 0 all inorganic Fe(III) species, largely hydrolysis productsHNLC high nutrient low chlorophyllIRONEX <strong>Iron</strong> Enrichment Experiments (Equatorial Pacific)ITCZ intertropical convergence zoneky BP thous<strong>and</strong> years before the presentNADPH nicotinamide adenine dinucleotide (reduced)POC particulate organic carbonPSi particulate silicaSEEDS Subarctic Pacific <strong>Iron</strong> Experiment for Ecosystem DynamicsStudySERIES Subarctic Ecosystem Response to <strong>Iron</strong> Enrichment StudySOFeX Southern Ocean Fe Experiment, including both North <strong>and</strong> SouthpatchesSOIREE Southern Ocean <strong>Iron</strong> Enrichment Experiment
0000-0-Sigel-ch07_R1_121004<strong>Iron</strong>, <strong>Phytoplankton</strong> <strong>Growth</strong>, <strong>and</strong> <strong>Carbon</strong> <strong>Cycle</strong> 18514091410141114121413141414151416141714181419142014211422142314241425142614271428142914301431143214331434143514361437143814391440144114421443144414451446144714481449145014511452REFERENCES1. Sunda WG. In: Turner DR, Hunter KA, eds. The Biogeochemistry <strong>of</strong> <strong>Iron</strong> inSeawater. Chichester, West Sussex: John Wiley & Sons, 2001:41–84.2. Redfield AC, Ketchum BH, Richards FA. In: Hill MN, ed. The Sea, Vol. 2.New York: Wiley, 1963:26–77.3. Sunda WG. Mar Chem 1997; 50:169–172.4. Sunda WG, Swift D, Huntsman SA. Nature 1991; 351:55–57.5. Sunda WG, Huntsman SA. Mar Chem 1995; 50:189–206.6. Lancelot C, Hannon E, Becquevort S, Veth C, de Baar HJW. Deep-Sea Res I 2000;47:1621–1662.7. de Baar HJW, de Jong JTM. In: Turner DR, Hunter KA, eds. The Biogeochemistry <strong>of</strong><strong>Iron</strong> in Seawater. Chichester, West Sussex: John Wiley & Sons, 2001:123–253.8. Ho TY, Quigg A, Finkel ZV, Milligan AJ, Wyman K, Falkowski PG, Morel FMM.J Phycol 2003; 39:1145–1159.9. Raven JA. New Phytol 1988; 109:279–287.10. Maldonado MT, Price NM. Mar Ecol Prog Ser 1996; 141:161–172.11. Achilles KM, Church TM, Wilhelm SW, Luther GW, Hutchins DA. LimnolOceanogr 2003; 48:2250–2255.12. Kustka AB, Sanudo-Wilhelmy SA, Carpenter EJ, Capone D, Burns J, Sunda WG.Limnol Oceanogr 2003; 48:1869–1884.13. Neil<strong>and</strong>s JB. Annu Rev Nutr 1981; 1:27–46.14. Granger J, Price NM. Limnol Oceanogr 1999; 44:541–555.15. Soria-Dengg S, Reissbrodt R, Horstmann U. Mar Ecol Progr Ser 2001; 220:73–82.16. Weaver RS, Kirchman DL, Hutchins DA. Aquat Micro Ecol 2003; 31:227–239.17. Trick CG. Curr Microbiol 1989; 18:375–378.18. Haywood MG, Holt PD, Butler A. Limnol Oceanogr 1993; 38:1091–1097.19. Reid RT, Butler A. Limnol Oceanogr 1991; 36:1783–1793.20. Reid RT, Live DH, Faulkner DJ, Butler A. Nature 1993; 366:455–458.21. Wilhelm SW, Trick CG. Limnol Oceanogr 1994; 39:1979–1984.22. Wilhelm SW. Aquat Micro Ecol 1995; 9:295–303.23. Hudson RJM, Morel FMM. Limnol Oceanogr 1990; 35:1002–1020.24. Soria-Dengg S, Horstmann U. Mar Ecol Prog Ser 1995; 127:269–277.25. Anderson MA, Morel FMM. Limnol Oceanogr 1982; 27:789–813.26. Eide D, Guerinot ML. ASM News 1997; 63:199–205.27. Maranger R, Bird DF, Price NM. Nature 1998; 396:248–251.28. Nodwell LM, Price NM. Limnol Oceanogr 2001; 46:765–777.29. Hudson RJM, Morel FMM. Deep-Sea Res 1993; 40:129–151.30. Sunda WG, Huntsman SA. Nature 1997; 390:389–392.31. Price NM, Ahner BA, Morel FMM. Limnol Oceanogr 1994; 39:520–534.32. Boyd PW, Muggli DL, Varela DE, Goldblatt RH, Chretien R, Orians KJ,Harrison PJ. Mar Ecol Prog Ser 1996; 136:179–193.33. Coale KH, Johnson KS, Fitzwater SE, Gordon RM, Tanner S, Chavez FP, Ferioli L,Sakamoto C, Rogers P, Millero F, Steinberg P, Nightingale P, Cooper D,Cochlan WP, L<strong>and</strong>ry MR, Constantinou J, Rollwagen G, Trasvina A, Kudela R.Nature 1996; 383:495–501.34. Boyd PW, Watson AJ, Law CS, Abraham ER, Trull T, Murdoch R, Bakker DCE,Bowie AR, Buesseler KO, Chang H, Charette M, Croot P, Downing K, Frew R,
0000-0-Sigel-ch07_R1_121004186 Street <strong>and</strong> Paytan14531454145514561457145814591460146114621463146414651466146714681469147014711472147314741475147614771478147914801481148214831484148514861487148814891490149114921493149414951496Gall M, Hadfield M, Hall J, Harvey M, Jameson G, LaRoche J, Liddicoat M, Ling R,Maldonado MT, McKay RM, Nodder S, Pickmere S, Pridmore R, Rintoul S, Safi K,Sutton P, Strzepek R, Tanneberger K, Turner S, Waite A, Zeldis J. Nature 2000;407:695–702.35. Tsuda A, Takeda S, Saito H, Nishioka J, Nojiri Y, Kudo I, Kiyosawa H, ShimomotoA, Imai K, Ono T, Shimomoto A, Tsumune D, Yoshimura T, Aono T, Hinuma A,Kinugasa M, Suzuki K, Sohrin Y, Noiri Y, Tani H, Deguchi Y, Tsurushima N,Ogawa H, Fukami K, Kuma K, Saino T. Science 2003; 300:958–961.36. Wu J, Luther GW. Mar Chem 1995; 50:159–177.37. Hudson RJM, Covault DT, Morel FMM. Mar Chem 1992; 38:209–235.38. Rue EL, Brul<strong>and</strong> KW. Mar Chem 1995; 50:117–138.39. Witter AE, Luther GW. Mar Chem 1998; 62:241–258.40. Witter AE, Hutchins DA, Butler A, Luther GW. Mar Chem 2000; 69:1–17.41. Vassiliev IR, Kolber Z, Wyman KD, Mauzerall D, Shukla VK, Falkowski PG. PlantPhysiol 1995; 109:963–972.42. Kirchman DL, H<strong>of</strong>fman KA, Weaver R, Hutchins DA. Mar Ecol Progr Ser 2003;250:291–296.43. Takeda S. Nature 1998; 393:774–777.44. LaRoche J, Geider RJ, Graziano LM, Murray H, Lewis KJ. J Phycol 1993;29:767–777.45. Geider RJ, LaRoche J. J Photosynth Res 1994; 39:275–301.46. LaRoche J, Murray H, Orellana M, Newton J. J Phycol 1995; 31:520–530.47. LaRoche J, Boyd PW, McKay RML, Geider RJ. Nature 1996; 382:802–805.48. Brul<strong>and</strong> KW, Rue EL. In: Turner DR, Hunter KA, eds. The Biogeochemistry <strong>of</strong> <strong>Iron</strong>in Seawater. Chichester, West Sussex: John Wiley & Sons, 2001:255–289.49. van den Berg CMG. Mar Chem 1995; 50:139–157.50. Rue EL, Brul<strong>and</strong> KW. Limnol Oceanogr 1997; 42:901–910.51. Morel FMM, Price NM. Science 2003; 300:944–947.52. Kuma K, Katsumoto A, Nishioka J, Matsunaga K. Est Coast Shelf Sci 1998;47:275–283.53. Skoog A, Benner R. Limnol Oceanogr 1997; 42:1803–1813.54. Wu J, Boyle EA, Sunda WG, Wen L-S. Nature 2001; 293:847.55. Millero FJ, Yao W, Aicher J. Mar Chem 1995; 50:21–39.56. Kuma K, Nishioka J, Matsunaga K. Limnol Oceanogr 1996; 41:396–407.57. Liu X, Millero FJ. Mar Chem 2002; 77:43–54.58. Liu X, Millero FJ. Geochim Cosmochim Acta 1999; 63:3487–3497.59. Waite TD, Morel FMM. Environ Sci Technol 1984; 18:860–868.60. Wells ML, Mayer LM. Deep-Sea Res 1991; 38:1379–1395.61. Kuma K, Nakabayashi S, Suzuki Y, Matsunaga K. Mar Chem 1992; 38:133–143.62. Waite TD, Szymczak R, Espey QI, Furnas MJ. Mar Chem 1995; 50:79–91.63. Miller WL, King DW, Lin J, Kester DR. Mar Chem 1995; 50:63–77.64. Voelker BM, Sedlak DL. Mar Chem 1995; 50:93–102.65. Barbeau K, Rue EL, Trick CG, Brul<strong>and</strong> KT, Butler A. Limnol Oceanogr 2003;48:1069–1078.66. Jones GJ, Palenik BP, Morel FMM. J Phycol 1987; 23:237–244.67. Maldonado MT, Price NM. Deep-Sea Res II 1999; 46:2447–2473.68. Maldonado MT, Price NM. Limnol Oceanogr 2000; 45:814–826.69. Millero FJ, Sotolongo S. Geochim Cosmochim Acta 1989; 53:1867–1873.
0000-0-Sigel-ch07_R1_121004<strong>Iron</strong>, <strong>Phytoplankton</strong> <strong>Growth</strong>, <strong>and</strong> <strong>Carbon</strong> <strong>Cycle</strong> 1871497149814991500150115021503150415051506150715081509151015111512151315141515151615171518151915201521152215231524152515261527152815291530153115321533153415351536153715381539154070. Gledhill M, van den Berg CMG. Mar Chem 1994; 47:41–54.71. Johnson KS, Gordon RM, Coale KH. Mar Chem 1997; 57:137–161.72. Macrellis HM, Trick CG, Rue EL, Smith G, Brul<strong>and</strong> KW. Mar Chem 2001;76:175–187.73. Duce RA, Tindale NW. Limnol Oceanogr 1991; 36:1715–1726.74. Schutz LW, Prospero JM, Buat-Ménard P, Carvalho RAC, Cruzado A, Harriss P,Heidam NZ, Jaenicke R. In: Knapp AH, ed. The Long Range Atmospheric Transport<strong>of</strong> Natural <strong>and</strong> Contaminant Substances. Dordrecht: Kluwer, 1990:197–229.75. Prospero JM, Ginoux P, Torres O, Nicholson SE, Gill TE. Rev Geophys 2002;40:1002.76. Chester R, Murphy KJT, Lin FJ, Berry AS, Bradshaw GA, Corcoran PA. Mar Chem1993; 42:107–126.77. Spokes LJ, Jickells TD, Lim B. Geochim Cosmochim Acta 1994; 58:3281–3287.78. H<strong>of</strong>fmann P, Dedik AN, Ensling J, Weinbruch S, Weber S, Sinner T, Gutlich P,Ortner HM. J Aerosol Sci 1996; 27:325–337.79. Prospero JM, Nees RT. Nature 1986; 320:735–738.80. Goudie AS, Middleton NJ. Climate Change 1992; 20:197–225.81. Arimoto R. Earth-Sci Rev 2001; 54:29–42.82. Jickells TD, Spokes LJ. In: Turner DR, Hunter KA, eds. The Biogeochemistry <strong>of</strong><strong>Iron</strong> in Seawater. Chichester, West Sussex: John Wiley & Sons, 2001:85–121.83. Prospero JM, Lamb PJ. Science 2003; 302:1024–1027.84. Maring H, Savoie DL, Izaguirre MA, Custals L, Reid JS. J Geophys Res 2003;108:8592.85. Arimoto R, Duce RA. J Geophys Res 1986; 91:2787–2792.86. Duce RA, Liss PS, Merrill JT, Atlas EL, Buat-Ménard P, Hicks BB, Miller JM,Prospero JM, Arimoto R, Church TM, Ellis W, Galloway JN, Hansen L,Jickells TD, Knapp AH, Reinhardt KH, Schneider B, Soudine A, Tokos JJ,Tsunogai S, Wollast R, Zhou M. Global Biogeochem <strong>Cycle</strong>s 1991; 5:193–259.87. Sarthou G, Baker AR, Blain S, Achterberg EP, Boye M, Bowie AR, Croot P, Laan P,de Baar HJW, Jickells TD, Worsfold PJ. Deep-Sea Res I 2003; 50:1339–1352.88. Uematsu M, Wang ZF, Uno I. Geophys Res Lett 2003; 30:1342.89. Uematsu M, Duce RA, Prospero JM, Chen L, Merrill JT, McDonald RL. J GeophysRes 1983; 88:5342–5352.90. Prospero JM. In: Guerzoni S, Chester R, eds. The Impact <strong>of</strong> Desert Dust across theMediterranean. Dordrecht: Kluwer, 1996:133–151.91. Arimoto R, Duce RA, Ray BJ, Ellis WG, Cullen JD, Merrill JT. J Geophys Res 1995;100:1199–1213.92. Chiapello I, Bergametti G, Gomes L, Chatenet B, Dulac F, Pimenta J, Suares ES.Geophys Res Lett 1995; 22:3191–3194.93. Ball WP, Dickerson RR, Doddridge BG, Stehr JW, Miller TL, Savoie DL, CarseyTP. J Geophys Res 2003; 108:8001.94. Tindale NW, Pease PP. Deep-Sea Res 1999; 46:1577–1595.95. Prospero JM, Uetmatsu M, Savoie DL. In: Riley JP, Chester R, Duce RA, eds.Chemical Oceanography, Vol 10. London: Academic Press, 1989:187–218.96. Arimoto R, Ray BJ, Duce RA, Hewitt AD, Boldi R, Hudson A. J Geophys Res 1990;95:22389–22405.97. Ezat U, Dulac F. C R Acad Sci Ser II 1995; 320:9–14.98. Wagenbach D, Gorlach U, Moser K, Munnich KO. Tellus 1988; 40B:426–436.
0000-0-Sigel-ch07_R1_121004188 Street <strong>and</strong> Paytan1541154215431544154515461547154815491550155115521553155415551556155715581559156015611562156315641565156615671568156915701571157215731574157515761577157815791580158115821583158499. Dick AL. Geochim Cosmochim Acta 1991; 55:1827–1836.100. Kim G, Church TM. Global Biogeochem <strong>Cycle</strong>s 2002; 16:1046.101. Chiapello I, Moulin C. Geophys Res Lett 2002; 29:1176.102. Moulin C, Chiapello I. Geophys Res Lett 2004; 31:L02107.103. Guieu C, Loye-Pilot MD, Ridame C, Thomas C. J Geophys Res 2002; 107:4258.104. Zhang XY, Gong SL, Arimoto R, Shen ZX, Mei FM, Wang D, Cheng Y. J AtmosChem 2003; 44:241–257.105. Martin JH, Gordon RM, Fitzwater SE. Limnol Oceanogr 1991; 36:1793–1802.106. Johnson KS, Coale KH, Elrod VA, Tindale NW. Mar Chem 1994; 46:319–334.107. Zhu X, Prospero JM, Millero FJ, Savoie DL, Brass GW. Mar Chem 1992;38:91–107.108. Spokes LJ, Jickells TD. Aquat Geochem 1996; 1:355–374.109. Zhu X, Prospero JM, Millero FJ. J Geophys Res 1997; 102:21297–21305.110. Graedel TE, Weschler CJ, M<strong>and</strong>ich ML. Nature 1985; 317:240–242.111. Sulzberger, Laubscher H. Mar Chem 1995; 50:103–115.112. Zhu X, Prospero JM, Savoie DL, Millero FJ, Zika RG, Saltzmann ES. J Geophys Res1993; 98:21297–21305.113. Grgic I, Dovzan A, Berzic G, Hudnik V. J Atmos Chem 1998; 29:315–337.114. Zuo Y. Geochim Cosmochim Acta 1995; 59:3123–3131.115. Pehkonen SO, Siefert R, Erel Y, Webb S, H<strong>of</strong>fman MR. Environ Sci Technol 1993;27:2056–2062.116. Guieu C, Thomas AJ. In: Guerzoni S, Chester R, eds. The Impact <strong>of</strong> Desert DustAcross the Mediterranean. Dordrecht: Kluwer, 1996:207–216.117. Martin JH, Fitzwater SE. Nature 1988; 331:341–343.118. Martin JH, Gordon RM, Fitzwater S, Broenkow WW. Deep-Sea Res I 1989;36:649–680.119. Löscher BM, de Jong JTM, de Baar HJW, Veth C, DeHairs F. Deep-Sea Res II 1997;44:143–187.120. Fung IY, Meyn SK, Tegen I, Doney SC, John JG, Bishop JK. Global Biogeochem<strong>Cycle</strong>s 2000; 14:281–295.121. Moore JK, Doney SC, Glover DM, Fung IY. Deep-Sea Res II 2002; 49:463–507.122. Degens ET, Kempe S, Richey JE. In: Degens ET, Kempe S, Ritchey JE, eds. SCOPE42: Biogeochemistry <strong>of</strong> Major World Rivers. Chichester: John Wiley <strong>and</strong> Sons,1991:323–347.123. Milliman JD, Syvitski JPM. J Geol 1992; 100:525–544.124. Wu J, Luther GW. Geochim Cosmochim Acta 1996; 60:2729–2742.125. Giueu C, Martin JM. Est Coast Shelf Sci 2002; 54:501–512.126. Dai M, Martin JM. Earth Planet Sci Lett 1995; 131:127–141.127. Wen LS, Santschi P, Gill G, Paternostro C. Mar Chem 1999; 63:185–212.128. Guieu C, Huang WW, Martin JM, Yang YY. Mar Chem 1996; 53:255–267.129. von Damm KL, Bray AM, Buttermore LG, Oosting SE. Earth Planet Sci Lett 1998;160:521–536.130. Seyfried WE, Mottl MJ. In: Karl DM, ed. The Microbiology <strong>of</strong> Deep-seaHydrothermal Vents. Boca Raton, FL: CRC Press, 1995:1–34.131. Elderfield H, Schultz A. Annu Rev Earth Planet Sci 1996; 24:191–224.132. Schultz A, Elderfield H. In: Cann J, Elderfield H, Laughton T, eds. Mid OceanRidges. Cambridge: Cambridge University Press, 1999:171–209.133. von Damm KL, Bisch<strong>of</strong>f JL. J Geophys Res 1987; 92:11,334–11,346.
0000-0-Sigel-ch07_R1_121004<strong>Iron</strong>, <strong>Phytoplankton</strong> <strong>Growth</strong>, <strong>and</strong> <strong>Carbon</strong> <strong>Cycle</strong> 18915851586158715881589159015911592159315941595159615971598159916001601160216031604160516061607160816091610161116121613161416151616161716181619162016211622162316241625162616271628134. German CR, Holliday BP, Elderfield H. Earth Planet Sci Lett 1991; 107:101–114.135. Boye M, Aldrich AP, van den Berg CMG, de Jong JTM, Weldhuis M, de Baar HJW.Mar Chem 2003; 80:129–143.136. Canfield DE, Thamdrup B, Hansen JW. Geochim Cosmochim Acta 1993;57:3867–3883.137. Kumar N, Anderson RF, Mortlock RA, Froelich PN, Kubik P, Dittrich-Hannen B,Suter M. Nature 1995; 378:675–680.138. Koschinsky A, Gaye-Haake B, Arndt C, Maue G, Spitzy A, Winkler A,Halbach P. Deep-Sea Res II 2001; 48:3629–3651.139. Berelson W, McManus J, Coale K, Johnson K, Burdige D, Kilgore T, Colodner D,Chavez F, Kudela R, Boucher J. Continental Shelf Res 2003; 23:457–481.140. Canfield DE. Geochim Cosmochim Acta 1989; 53:619–632.141. Davison W, Grime GW, Morgan JAW, Clarkes K. Nature 1991; 352:323–325.142. Burdige DJ, Earth-Sci Rev 1993; 35:249–284.143. van Capellen Y, Wang Y. Am J Sci 1996; 296:197–243.144. Wijsman JWM, Middelburg JJ, Heip CHR. Mar Geol 2001; 172:167–180.145. Taillefert M, Hoover VC, Rozan TF, Theberge SM, Luther GW. Estuaries 2002;25:1088–1096.146. Rozan TF, Taillefert M, Trouwborst RE, Glazer BT, Ma SF, Herszage J, Valdes LM,Price KS, Luther GW. Limnol Oceanogr 2002; 47:1346–1354.147. Fitzwater SE, Johnson KS, Elrod VA, Ryan JP, Coletti LJ, Tanner SJ, Gordon RM,Chavez FP. Continental Shelf Res 2003; 23:1523–1544.148. Brul<strong>and</strong> KW, Rue EL, Smith GJ. Limnol Oceanogr 2001; 46:1661–1674.149. Tankere SPC, Muller FLL, Burton JD, Statham PJ, Guieu C, Martin JM. ContinentalShelf Res 2001; 21:1501–1532.150. For the purposes <strong>of</strong> this chapter I will focus on the delivery <strong>of</strong> iron to the euphoticzone through advection <strong>and</strong> upwelling, but it is important to note that relatedprocesses can result in losses <strong>of</strong> iron from a region.151. Martin JH, Coale KH, Johnson KS, Fitzwater SE, Gordon RM, Tanner SJ,Hunter CN, Elrod VA, Nowicki JL, Coley TL, Barber RT, Lindley S, Watson AJ,van Scoy K, Law CS, Liddicoat MI, Ling R, Stanton T, Stockel J, Collins C,Anderson A, Bidigare R, Ondrusek M, Latasa M, Millero FJ, Lee K, Yao W,Zhang JZ, Friedrich G, Sakamoto C, Chavez F, Buck K, Kolber Z, Greene R,Falkowski P, Chisholm SW, Hoge F, Swift R, Yungel J, Turner S, Nightingale P,Hatton A, Liss P, Tindale NW. Nature 1994; 371:123–129.152. Gordon RM, Johnson KS, Coale KH. Deep-Sea Res II 1998; 45:995–1041.153. Johnson KS, Chavez FP, Elrod VA, Fitzwater SE, Pennington JT, Buck KR,Walz PM. Geophysical Res Lett 2001; 28:1247–1250.154. Archer DE, Johnson K. Global Biogeochem <strong>Cycle</strong>s 2000; 14:269–279.155. Measures CI, Vink S. Deep-Sea Res II 2001; 48:3913–3941.156. Watson AJ, In: Turner DR, Hunter KA, eds. The Biogeochemistry <strong>of</strong> <strong>Iron</strong> inSeawater. Chichester, West Sussex: John Wiley & Sons, 2001:9–40.157. Hiscock MR, Marra J, Smith WO, Goericke R, Measures C, Vink S, Olson RJ,Sosik HM, Barber RT. Deep-Sea Res II 2003; 50:533–558.158. Hutchins DA, DiTullio GR, Brul<strong>and</strong> KW. Limnol Oceanogr 1993; 38:1242–1255.159. Hutchins DA, Brul<strong>and</strong> KW. Mar Ecol Progr Ser 1994; 110:259–269.160. Hutchins DA, Wang W, Fisher NS. Limnol Oceanogr 1995; 40:989–994.161. Barbeau K, M<strong>of</strong>fett JW, Caron DA, Croot PL, Erdner DL. Nature 1996; 380:61–64.
0000-0-Sigel-ch07_R1_121004190 Street <strong>and</strong> Paytan16291630163116321633163416351636163716381639164016411642164316441645164616471648164916501651165216531654165516561657165816591660166116621663166416651666166716681669167016711672162. Smetacek V, de Baar HJW, Bathmann UV, Lochte K, Rutgers van der Loeff MM.Deep-Sea Res II 1997; 44:1–21.163. Barbeau K, M<strong>of</strong>fett JW. Env Sci Technol 1998; 32:2969–2975.164. Deuser WG. Deep-Sea Res 1986; 33:225–246.165. Fischer G, Ratmeyer V, Weber G. Deep-Sea Res II 2000; 47:1961–1997.166. Whitfield M, Turner DR. In: Stumm W, ed. Aquatic Surface Chemistry. New York:Wiley, 1987:457–493.167. Balistrieri L, Murray J, Brewer PG. Deep-Sea Res 1981; 28:101–121.168. Honeyman BD, Balistrieri L, Murray JW. Deep-Sea Res 1988; 35:227–246.169. Moran SB, Buesseler KO. J Mar Res 1993; 51:893–922.170. Zhuang G, Duce RA. Deep-Sea Res I 1993; 40:1413–1429.171. Guieu C, Chester R, Nimmo M, Martin JM, Guerzoni S, Nicolas E, Mateu J,Keyes S. Deep-Sea Res II 1997; 44:655–674.172. Wu JF, Boyle E. Global Biogeochem <strong>Cycle</strong>s 2002; 16:1086.173. Bucciarelli E, Blain S, Tréguer P, Mar Chem 2001; 73:21–36.174. Takeda S, Obata H. Mar Chem 1995; 50:219–227.175. Coale KH, Fitzwater SE, Gordon RM, Johnson KS, Barber RT. Nature 1996;379:621–624.176. Brul<strong>and</strong> KW, Orians KJ, Cowen JP. Geochim Cosmochim Acta 1994;58:3171–3182.177. L<strong>and</strong>ing WM, Brul<strong>and</strong> KW. Geochim Cosmochim Acta 1987; 51:29–43.178. Orians KJ, Brul<strong>and</strong> KW. Nature 1985; 316:427–429.179. Millero FJ. Earth Planet Sci Lett 1998; 154:323–329.180. Sarthou G, Je<strong>and</strong>el C. Mar Chem 2001; 74:115–129.181. Hutchins DA, DiTullio GR, Zhang Y, Brul<strong>and</strong> KW. Limnol Oceanogr 1998;43:1037–1054.182. Gledhill M, van den Berg CMG, Nolting RF, Timmermans KR. Mar Chem 1998;59:283–300.183. Chase Z, van Green A, Kosro PM, Marra J, Wheeler PA. J Geophys Res 2002;107:3174.184. Lewis BL, L<strong>and</strong>ing WM. Deep-Sea Res II 1991; 38:773–803.185. Haraldsson C, Westerlund S. Mar Chem 1988; 23:417–424.186. Oguz T, Murray JW, Callahan AE. Deep-Sea Res I 2001; 48:761–787.187. Kremling K, Tokos JJS, Brügmann L, Hansen HP. Mar Poll Bull 1997; 34:112–122.188. Levitus S, Burgett R, Boyer T. World Ocean Atlas 1994, Vol 3: Nutrients, NOAAAtlas NESDIS, US Dept <strong>of</strong> Commerce, Washington, DC, 1994.189. Wong CS, Whitney FA, Iseki K, Page JS, Zeng J. Global Biogeochem <strong>Cycle</strong>s 1994;5:119–134.190. McClain CR, Arrigo K, Tai KS, Turk D. J Geophys Res 1996; 101:3697–3713.191. Chavez FP, Buck KR, Service SK, Newton J, Barber RT. Deep-Sea Res II 1996;43:835.192. Chavez FP, Barber R. Deep-Sea Res 1987; 34:1229–1243.193. Fiedler PC, Philbrick V, Chavez FP. Limnol Oceanogr 1991; 36:1834–1850.194. Booth BC, Lewin J, Postel JR. Progr Oceanogr 1993; 32:57–99.195. L<strong>and</strong>ry MR, Gifford DJ, Kirchman DL, Wheeler PA, Monger BC. Progr Oceanogr1993; 32:239–258.196. McCarthy JJ, Garside C, Nevins JL, Barber RT. Deep-Sea Res II 1996;43:1065–1093.
0000-0-Sigel-ch07_R1_121004<strong>Iron</strong>, <strong>Phytoplankton</strong> <strong>Growth</strong>, <strong>and</strong> <strong>Carbon</strong> <strong>Cycle</strong> 19116731674167516761677167816791680168116821683168416851686168716881689169016911692169316941695169616971698169917001701170217031704170517061707170817091710171117121713171417151716197. Turner DR, Owens NJP. Deep-Sea Res II 1995; 42:907–932.198. Smetacek V, Klaas C, Menden-Deuer S, Rynearson TA. Deep-Sea Res II 2002;49:3835–3848.199. Strass VH, Garabato ACN, Pollard RT, Fischer HI, Hense I, Allen JT, Read JF,Leach H, Smetacek V. Deep-Sea Res II 2002; 49:3735–3769.200. de Baar HJW, Boyd PW. In: Hanson RB, Ducklow HW, Field JG, eds. The DynamicOcean <strong>Carbon</strong> <strong>Cycle</strong>: A Modern Synthesis <strong>of</strong> the Joint Global Ocean Flux Study.Cambridge: Cambridge University Press, 2000:61–140.201. Longhurst A, Sathyendranath S, Platt S, Caverhill C. J Plankton Res 1995;17:1245–1271.202. Banse K, English DC. Mar Ecol Progr Ser 1997; 156:51–66.203. Hart TJ. Discovery Rep 1934; 8:1–268.204. Thomas WH. J Fish Res Board 1969; 26:1133–1145.205. Fitzwater SE, Johnson KS, Gordon RM, Coale KH, Smith WO Jr. Deep-Sea Res II2000; 47:3159–3179.206. Chisholm SW, Morel FMM. Limnol Oceanogr 1991; 36:1507–1511.207. Martin JH, Broenkow WW, Fitzwater S, Gordon RM. Limnol Oceanogr 1990;35:775–777.208. Martin JH, Gordon RM, Fitzwater SE. Nature 1990; 345:156–158.209. de Baar HJW, Buma AGJ, Nolting GC, Cadee G, Jaques G, Treguer PJ. Mar EcolProgr Ser 1990; 65:105–122.210. Price NM, Andersen LF, Morel FMM. Deep-Sea Res I 1991; 38:1361–1378.211. Coale KH. Limnol Oceanogr 1991; 36:1851–1864.212. Ditullio GR, Hutchins DA, Brul<strong>and</strong> KW. Limnol Oceanogr 1993; 38:1361–1378.213. de Baar HJW, de Jong JTM, Bakker DCF, Loscher BM, Veth C, Bathmann U,Smetacek V. Nature 1995; 373:412–415.214. de Baar HJW, van Leeuwe MA, Scharek R, Goeyens L, Bakker KMJ, FritscheP. Deep-Sea Res II 1997; 44:229–260.215. Fitzwater SE, Coale KH, Gordon RM, Johnson KS, Ondrusek ME. Deep-Sea Res II1996; 43:995–1015.216. Boyd PW, Muggli DL, Varela DE, Goldblatt RH, Chretien R, Orians KJ, HarrisonPJ. Mar Ecol Progr Ser 1996; 136:179–193.217. van Leeuwe MA, Scharek R, de Baar HJW, de Jong JTM, Goeyens L. Deep-Sea ResII 1997; 44:189–207.218. Sedwick PN, Blain S, Queguiner B, Griffiths FB, Fiala M, Bucciarelli E. Deep-SeaRes II 2002; 49:3327–3349.219. Coale KH, Wang X, Tanner SJ, Johnson KS. Deep-Sea Res II 2003; 50:635–653.220. Timmermans KR, van Leeuwe MA, de Jong JTM, McKay RML, Nolting RF,Witte HJ, van Ooyen J, Swagerman MJW, Kloosterhuis H, de Baar HJW.Mar Ecol Progr Ser 1998; 166:27–41.221. Dugdale RC, Wilkerson FP. Global Biogeochem <strong>Cycle</strong>s 1990; 4:13–19.222. Banse K. Limnol Oceanogr 1990; 35:772–775.223. Cullen JJ. Limnol Oceanogr 1991; 36:1578–1599.224. Coale KH, Johnson KS, Chavez FP, Buesseler KO, Barber RT, Brzezinski MA,Cochlan WP, Millero FJ, Falkowski PG, Bauer JE, Wanninkh<strong>of</strong> RH, Kudela RM,Altabet MA, Hales BE, Takahashi T, L<strong>and</strong>ry MR, Bidigare RR, Wang X, Chase Z,Strutton PG, Friederich GE, Gorbunov MY, Lance VP, Hilting AK, Hiscock MR,Demarest M, Hiscock WT, Sullivan KF, Tanner SJ, Gordon RM, Hunter CN,
0000-0-Sigel-ch07_R1_121004192 Street <strong>and</strong> Paytan17171718171917201721172217231724172517261727172817291730173117321733173417351736173717381739174017411742174317441745174617471748174917501751175217531754175517561757175817591760Elrod VA, Fitzwater SE, Jones JL, Tozzi S, Kobilek M, Roberts AE, Herndon J,Brewster J, Ladizinsky N, Smith G, Cooper D, Timothy D, Brown SL, Selph KE,Sheridan CC, Twining BS, Johnson ZI. Science 2004; 304:408–414.225. Boyd PW, Law CS, Wong CS, Nojiri Y, Tsuda A, Levasseur M, Takeda S, Rivkin R,Harrison PJ, Strzepek R, Gower J, McKay RM, Abraham E, Arychuk M,Barwell-Clarke J, Crawford W, Crawford D, Hale M, Harada K, Johnson K,Kiyosawa H, Kudo I, Marchetti A, Miller W, Needoba J, Nishioka J, Ogawa H,Page J, Robert M, Saito H, Sastri A, Sherry N, Soutar T, Sutherl<strong>and</strong> N, Taira Y,Whitney F, Wong SE, Yoshimura T. Nature 2004; 428:549–553.226. Kolber ZS, Barber RT, Bidigare RR, Chai F, Coale KH, Dam HG, Lewis MR,Lindley ST, McCarthy JJ, Roman MR, Stoecker DK, Verity PG, White JR. Nature1994; 371:145–149.227. Behrenfeld MJ, Bale AJ, Kolber ZS, Aiken J, Falkowski PG. Nature 1996;383:508–510.228. Gervais F, Riebesell U, Gorbunov MY. Limnol Oceanogr 2002; 47:1324–1335.229. Cooper DJ, Watson AJ, Nightingale PD. Nature 1996; 383:511–513.230. Watson AJ, Whitney FA, Iseki K, Page JS, Zeng J. Nature 1994; 371:143–145.231. Buesseler KO, Boyd PW. Science 2003; 300:67–68.232. Buesseler KO, Andrews JE, Pike SM, Charette MA. Science 2004; 304:414–417.233. Bishop JKB, Wood TJ, Davis RE, Sherman JT. Science 2004; 304:417.234. Firme GF, Rue EL, Weeks DA, Brul<strong>and</strong> KW, Hutchins DA. Global Biogeochem<strong>Cycle</strong>s 2003; 17:1016.235. Hutchins DA, Hare CE, Weaver RS, Zhang Y, Firme GF, DiTullio GR, Alm MB,Riseman SF, Maucher JM, Geesey ME, Trick CG, Smith GJ, Rue EL, Conn J,Brul<strong>and</strong> KW. Limnol Oceanogr 2002; 47:997–1011.236. Behrenfeld MJ, Kolber ZS. Science 1999; 283:840–843.237. Mitchell BG, Broody EA, Holm-Hansen O, McCain C, Bishop J. Limnol Oceanogr1991; 36:1662–1677.238. Nelson DM, Smith WO. Limnol Oceanogr 1991; 36:1650–1661.239. Boyd PW, LaRoche J, Gall M, Frew R, McKay RML, J Geophys Res 1999;104:13395–13408.240. Geider RT, Greene RM, Kolber Z, McIntyre HL, Falkowsi PG. Deep-Sea Res I40:1205–1224.241. Dugdale RC, Wilkerson FP, Minas HJ. Deep-Sea Res I 1995; 42:697–719.242. Dugdale RC, Wilkerson FP. Nature 1998; 391:270–273.243. Jiang MS, Chai F, Dugdale RC, Wilkerson FP, Peng TH, Barber RT. Deep-Sea Res II2003; 50:2971–2996.244. Falkowski PG. Nature 1997; 387:272–275.245. Reuter JGJ. Eos 1982; 63:445.246. Letelier RM, Karl DM. Mar Ecol Progr Ser 1996; 133:263–273.247. Lenes JM, Darrow BP, Cattrall C, Heill CA, Callahan M, Vargo GA, Byrne RH, ProsperoJM, Bates DE, Fanning KA, Walsh JJ. Limnol Oceanogr 2001; 46:1261–1277.248. Berman-Frank I, Cullen JT, Shaked Y, Sherrell RM, Falkowski PG. LimnolOceanogr 2001; 46:1249–1260.249. Buesseler KO. Global Biogeochem <strong>Cycle</strong>s 1998; 12:297–310.250. Buesseler KO, Ball L, Andrews J, Cochran JK, Hirschberg DJ, Bacon MP, Fleer A,Brzezinski M. Deep-Sea Res II 2001; 48:4275–4297.251. Chisholm SW, Falkowski PG, Cullen JJ. Science 2001; 294:309–310.
0000-0-Sigel-ch07_R1_121004<strong>Iron</strong>, <strong>Phytoplankton</strong> <strong>Growth</strong>, <strong>and</strong> <strong>Carbon</strong> <strong>Cycle</strong> 19317611762176317641765176617671768176917701771177217731774177517761777177817791780178117821783178417851786178717881789179017911792179317941795179617971798179918001801180218031804252. Law CS, Ling RD. Deep-Sea Res II 2001; 48:2509–2527.253. Martin JH, Paleoceanography 1990; 5:1–13.254. Xhang XY, Lu HY, Arimoto R, Gong SL. Earth Planet Sci Lett 2002; 202:637–643.255. Kohfeld KE, Harrison SP. Quatern Sci Rev 2003; 22:1859–1878.256. Rea DK. Rev Geophys 1994; 32:159–195.257. Reader MC, Fung I, McFarlane N. J Geophys Res 1999; 104:9381–9398.258. Petit JR, Jouzel J, Raynaud D, Barkov NI, Barnola J-M, Basile I, Bender M,Chappellaz J, Davis M, Delaygue G, Delmotte M, Kotlyakov VM, Legr<strong>and</strong> M,Lipenkov VY, Lorius C, Pépin L, Ritz C, Saltzman E, Stievenard M. Nature 1999;399:429–436.259. Basile I, Grousset FE, Revel M, Petit JR, Biscaye PE, Barkov NI. Earth Planet SciLett 1997; 146:573–589.260. Andersen KA, Armengaud A, Genthon C. Geophys Res Lett 1998; 25:2281–2284.261. Mahowald N, Kohfeld KE, Hansson M, Balkanski Y, Harrison SP, Prentice IC,Schulz M, Rodhe H. J Geophys Res 1999; 104:15895–15916.262. Werner M, Tegen I, Harrison SP, Kohfeld KE, Prentice IC, Balkanski Y, Rodhe H,Roel<strong>and</strong>t C. J Geophys Res 2002; 107:4744.263. Paytan A, Kastner M, Chavez FP. Science 1996; 274:1355–1357.264. Loubere P. Nature 2000; 406:497–500.265. Higuerra JC, Berger WH. Geology 1994; 22:629–632.266. Lyle M. Nature 1988; 335:529–532.267. Mortlock RA, Charles CD, Froelich PN, Zibello MA, Saltzman J, Hays JD,Burckle LH. Nature 1991; 351:220–223.268. Nürnberg CC, Bohrmann G, Schlüter M, Frank M. Paleoceanography 1997;12:594–603.269. Bareille, Labracherie M, Bertr<strong>and</strong> P, Labeyrie L, Lavaux G, Dignan M. J Mar Sys1998; 17:527–539.270. Chase Z, Anderson RF, Fleisher MQ. Paleoceanography 2001; 16:468–478.271. Lefévre N, Watson AJ. Global Biogeochem <strong>Cycle</strong>s 1999; 13:727–736.272. Broecker WS, Henderson GM. Paleoceanography 1998; 13:352–364.273. Gruber N, Sarmiento JL. Global Biogeochem <strong>Cycle</strong>s 1997; 11:235–266.274. Karl D, Letelier R, Tupas L, Dore J, Christian J, Hebel D. Nature 1997; 388:533–538.275. Falkowski PG, Barber RT, Smetacek V. Science 1998; 281:200–206.276. Francois R, Altabet MA, Yu EF, Sigman DM, Bacon MP, Frank M, Bohrmann G,Barielle G, Labeyrie LD. Nature 1997; 389:929–935.277. Archer DE, Eshel G, Wiguth A, Broecker W, Pierrehumbert R, Tobis M,Jacob R. Global Biogeochem <strong>Cycle</strong>s 2000; 14:1219–1230.278. Harrison KG. Paleoceanography 2000; 15:292–298.279. Dugdale RC, Wilkerson FP. Scientia Marina 2001; 65 (suppl 2):141–152.280. Barnola JM, Raynaud D, Korotkevitch YS, Lorius C. Nature 1987; 329:408.281. Sigman DM, Altabet MA, Francois R, McCorkle DC, Gaillard JF. Paleoceanography1999; 14:118–134.282. Watson AJ, Bakker DCE, Ridgwell AJ, Boyd PW, Law CS. Nature 2000;407:730–733.283. Haygood MG, Holt PD, Butler A. Limnol Oceanogr 1993; 38:1091–1097.284. Albrecht-Gary AM, Crumbliss AL. In: Sigel A, Sigel H, eds. Metal Ions inBiological Systems, Vol 35: <strong>Iron</strong> Transport <strong>and</strong> Storage in Microorganisms,Plants, Animals. New York: Marcel Dekker, 1998:239–327.