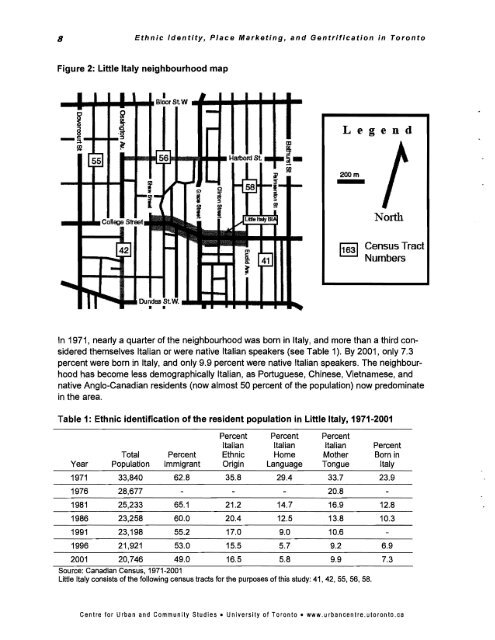
8 <strong>Ethnic</strong> <strong>Identity</strong>, <strong>Place</strong> <strong>Market<strong>in</strong>g</strong>, <strong>and</strong> <strong>Gentrification</strong> <strong>in</strong> TorontoFigure 2: Little Italy neighbourhood mapJ_ .....,....IIII!,-'Bl0orStW .._ ..... ~ ....... I-Legend200mNorth11631 Census TractNumbersIn 1971, nearly a quarter of the neighbourhood was born <strong>in</strong> Italy, <strong>and</strong> more than a third consideredthemselves Italian or were native Italian speakers (see Table 1). By 2001, only 7.3percent were born <strong>in</strong> Italy, <strong>and</strong> only 9.9 percent were native Italian speakers. The neighbourhoodhas become less demographically Italian, as Portuguese, Ch<strong>in</strong>ese, Vietnamese, <strong>and</strong>native Anglo-Canadian residents (now almost 50 percent of the population) now predom<strong>in</strong>ate<strong>in</strong> the area.Table 1: <strong>Ethnic</strong> identification ofthe resident population <strong>in</strong> Little Italy, 1971-2001Percent Percent PercentItalian Italian Italian PercentTotal Percent <strong>Ethnic</strong> Home Mother Born <strong>in</strong>Year Population Immigrant Orig<strong>in</strong> Language Tongue Italy1971 33,840 62.8 35.8 29,4 33.7 23.91976 28,677 20.81981 25,233 65.1 21.2 14.7 16.9 12.81986 23,258 60.0 20,4 12.5 13.8 10.31991 23,198 55.2 17.0 9.0 10.61996 21.921 53.0 15.5 5.7 9.2 6.92001 20,746 49.0 16.5 5.8 9.9 7.3Source: Canadian Census, 1971-2001Little Italy consists of the follow<strong>in</strong>g census tracts for the purposes of this study: 41, 42, 55, 56, 58.<strong>Centre</strong> for Urban <strong>and</strong> Community Studies. University of Toronto. www.urbancentre.utoronto.ca
<strong>Ethnic</strong> <strong>Identity</strong>, <strong>Place</strong> <strong>Market<strong>in</strong>g</strong>, <strong>and</strong> <strong>Gentrification</strong> <strong>in</strong> Toronto 9The evaporation of Italian residential identity was paralleled by a similar, though much lessrapid decl<strong>in</strong>e of Italian commercial identity <strong>in</strong> the neighbourhood dur<strong>in</strong>g the same period (seeTable 2). Of the roughly 154 bus<strong>in</strong>esses along College Street between Euclid <strong>and</strong> Shaw (theboundaries of the current Little Italy BIA), 44.8 percent openly identified with Italy, or the Italianlanguage <strong>in</strong> their names <strong>in</strong> 1970. 2 By 2000, the percentage had dropped to 29.2 percent,while bus<strong>in</strong>esses with no clear ethnic identification became 64.9 percent of the total. Moreover,those Italian bus<strong>in</strong>esses that rema<strong>in</strong> have been lambasted as "<strong>in</strong>authentic" by the localpress. As one reporter (Taylor, 2003, p. B01) put it:Ma<strong>in</strong>ly what's left is Little Italy the br<strong>and</strong> name, the trademark, the logo, the ethnic"swoosh." Very little Italy.Table 2: <strong>Ethnic</strong> identification of bus<strong>in</strong>esses <strong>in</strong> Little Italy, 1970-2000ClearNo ClearTotal Clear Italian Portuguese Other <strong>Ethnic</strong> <strong>Ethnic</strong>Year Bus<strong>in</strong>esses Identification Identification Identification Identification1970 154 44.8 0.6 2.6 51.91980 145 35.9 4.8 0.7 58.61990 145 25.5 8.3 3.4 62.82000 154 29.2 3.2 2.6 64.9Source: Might's Criss Cross DirectoryNote: Only the bus<strong>in</strong>esses with<strong>in</strong> the Little Italy BIA along College Street are <strong>in</strong>cluded here.The cultural critique is partially supported by the change <strong>in</strong> bus<strong>in</strong>ess composition <strong>in</strong> theneighbourhood, which is now oriented to tourists <strong>and</strong> young professionals (see Table 3).Trendy restaurants are <strong>in</strong>; family bodegas <strong>and</strong> traditional coffee shops are apparently out. In1970, only 9.6 percent of the bus<strong>in</strong>esses <strong>in</strong> Little Italy were restaurants, while 21 percentwere grocery stores. By 2000, restaurants dom<strong>in</strong>ated at 31.2 percent - the largest s<strong>in</strong>glecategory - while grocery <strong>and</strong> cloth<strong>in</strong>g stores dropped to 10.9 <strong>and</strong> 13 percent respectively.Given the rise <strong>in</strong> the number of restaurants, it is no wonder that realtors have already begunto deem it "the restaurant district" (Taylor, 2003).Table 3: Bus<strong>in</strong>ess type changes <strong>in</strong> Little Italy, 1970-2000Total Grocery/Food Other/Non-Year Bus<strong>in</strong>esses Restaurants Stores Medical Apparel identifiable1970 154 9.6 21.0 3.8 22.9 42.71980 145 9.2 16.2 4.2 26.1 44.31990 145 15.9 12.4 6.2 23.5 42.02000 154 31.2 10.9 8.7 13.0 36.2Source: Might's Criss Cross DirectoryNote: Only the bus<strong>in</strong>esses with<strong>in</strong> the Little Italy BIA along College Street are <strong>in</strong>cluded here.2 This was measured by us<strong>in</strong>g the Might's Street Directory for the City ofToronto for 1970, 1980, 1990, <strong>and</strong>2000. Bus<strong>in</strong>ess names were judged on their ethnic content <strong>and</strong> then recorded <strong>in</strong> Table 2. For example, forLittle Italy, all bus<strong>in</strong>ess names that used some version of the word Italy, or an Italian word, or a reference tothe country or culture of Italy, were counted as hav<strong>in</strong>g an "Italian identification:<strong>Centre</strong> for Urban <strong>and</strong> Community Studies. University of Toronto. www.urbancentre.utoronto.ca
- Page 1 and 2: Centre forUrban andCommunity Studie
- Page 3 and 4: AuthorsJason Hackworth is Assistant
- Page 5 and 6: Table of Contents1. INTRODUCTION ..
- Page 7 and 8: 1. IntroductionIt has been more tha
- Page 9 and 10: Ethnic Identity, Place Marketing, a
- Page 11 and 12: 3. MethodThis study relies on an ex
- Page 13: 4. Four Case StudiesLittle Ita IyLi
- Page 17 and 18: Ethnic Identity, Place Marketing, a
- Page 19 and 20: Ethnic Identity, Place Marketing, a
- Page 21 and 22: Ethnic Identity, Place Marketings a
- Page 23 and 24: Ethnic Identity, Place Marketing, a
- Page 25 and 26: Ethnic Identity, Place Marketing, a
- Page 27 and 28: Ethnic Identity, Place Marketing, a
- Page 29 and 30: 5. Culture, Power, and EconomicsThe
- Page 31 and 32: ReferencesAnderson, K. 1987. The id
- Page 33: Ethnic Identity, Place Marketing, a