Moving Man Worksheet.pdf
Moving Man Worksheet.pdf
Moving Man Worksheet.pdf

Create successful ePaper yourself
Turn your PDF publications into a flip-book with our unique Google optimized e-Paper software.
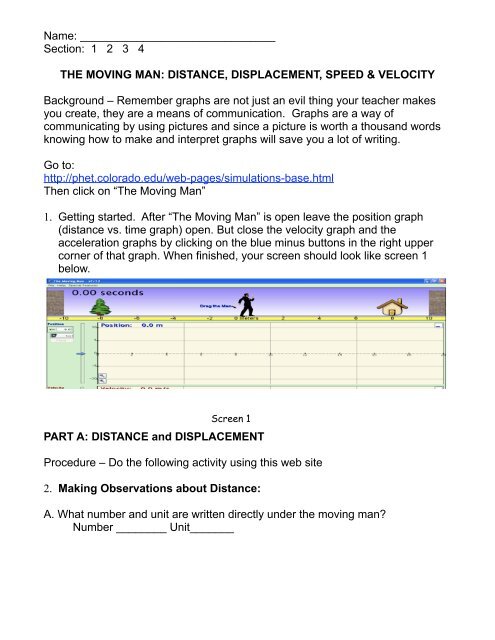
Name: _______________________________Section: 1 2 3 4THE MOVING MAN: DISTANCE, DISPLACEMENT, SPEED & VELOCITYBackground – Remember graphs are not just an evil thing your teacher makesyou create, they are a means of communication. Graphs are a way ofcommunicating by using pictures and since a picture is worth a thousand wordsknowing how to make and interpret graphs will save you a lot of writing.Go to:http://phet.colorado.edu/web-pages/simulations-base.htmlThen click on “The <strong>Moving</strong> <strong>Man</strong>”1. Getting started. After “The <strong>Moving</strong> <strong>Man</strong>” is open leave the position graph(distance vs. time graph) open. But close the velocity graph and theacceleration graphs by clicking on the blue minus buttons in the right uppercorner of that graph. When finished, your screen should look like screen 1below.Screen 1PART A: DISTANCE and DISPLACEMENTProcedure – Do the following activity using this web site2. Making Observations about Distance:A. What number and unit are written directly under the moving man?Number ________ Unit_______
B. The position under the walking man which is labeled “0 meters” is called the“Reference Point”. It is the point from which all motion will be referenced. You canuse any point as a reference point but in this case. We have chosen this point tobe our starting “reference point”C. The amount of a certain unit between the reference point and an object iscalled the DISTANCE. Distance does not tell you anything about the directionfrom the reference point. It only has an amount and a unit.D. In the table below record the distances requested in meters:DISTANCE FROMWalking <strong>Man</strong>(reference point)to….The House The Wall The tree3. Making Observations about Displacement:A. You may have noticed that the distance to the tree has been given a negativevalue while the distance to the house has been given a positive value. Stop andthink for a moment. Why do you suppose this has been done?B. When we add a “-“ or a “+” to the number we are indicating a direction. A “-“sign means “backward or behind” and a “+” sign means “forward or in front”.They indicate the direction of an object from the chosen reference point. Addingthe “+” or “-“ sign indicates DISPLACEMENT (not distance). Displacement, likedistance has an amount (magnitude) and a unit, but displacement also has adirection. Distance does NOT have a direction. When we want to indicatedirection in more than two directions (e.g. forward and backward), we use wordslike north, south, east, west, northwest etc. We can also use degrees of a circlewith the reference point being the center of a circle.D. In the table below record the displacements requested in meters. Use “-“ and“+” to indicate direction from the reference point (Be sure to also include anamount and a unit.)DISPLACEMENTFROM Walking <strong>Man</strong>(reference point)to….The House The Wall The tree
What is the difference between an object’s DISTANCE and its DISPLACEMENT?________________________________________________________________________________________________________________________________PART B: SPEED AND VELOCITYIntroduction:When an object changes position over a period of time we say that it is inMOTION.When an object changes position (moves), there are several things we canmeasure about the motion:A. We can measure how much DISTANCE the object traveled as itchanged position. (the length of its path)B. We can measure how much TIME it took for it to change position.C. We can describe the DIRECTION it went as it changed position.D. We can measure its SPEED as it changed position. Speed comparesthe DISTANCE it traveled to the TIME it took to travel that distance. If anobject covers a lot of distance in very little time, we say its speed is fast. If itcovers very little distance in an amount of time, we say that its speed isslow.E. We can describe its VELOCITY as it changes position. Velocitycompares the amount that the objects DISPLACEMENT (direction anddistance) have both changed during a certain amount of TIME. If the objecthas covered a lot of distance OR changed its direction a lot, then we say ithas a fast velocity.What is the difference between an object’s SPEED and its VELOCITY?________________________________________________________________________________________________________________________________Procedure – Do the following activity using this web site1. Making observations.A. The unit of distance in the moving man is ____________(yellow bar)B.The unit of time used in the moving man is ___________ (blue sky)C. Set the moving man’s velocity (≈ speed) at 1 meters/sec and hit go. Watch themoving man.
SKETCH 1:A man moving from 0m to10m at a slow steadypace.Distance (m)1050-5-10Time(s)SKETCH 2:A man moving from 0m to10m at a fast pace.Distance (m)1050-5-10Time(s)SKETCH 3:A man standing still at 4mDistance (m)1050-5-10Time(s)SKETCH 4: A man movingfrom 0m to 10m at a steadyfast pace then moving back to0 m at a steady slow pace.Distance (m)10Time(s)Sketch 5: A man movingfrom 0 to 10 meters at anever-increasing speed(acceleration)Distance (m)-5-10Time(s)Sketch 6: A man movingfrom 10m to 0m at aDistance (m)1050steady fast pace. -5-10Time(s)Apply what you learned.Look at the graphs above and answer the following questions.1) EXPLAIN the difference in motion represented by a straight line and a curvingline on a “distance vs. time” in terms of constant or changing speed.
2) Changing speed is called “acceleration” (speeding up) or deceleration (slowingdown). Describe the shape of an acceleration line on a Distance vs. Time graphof acceleration.3) EXPLAIN the difference between the motion represented by a flat line and asloping straight line in a “distance vs. time” graph.4) If the slope of a line on a “distance vs. time” graph is steep. What is differentabout the motion then when it is not steep?5) Look at the graph below and answer the following questions.A) CALCULATE the average speed/velocity between point B & Point C by findingthe slope of the line between the 6 th and 15 th seconds (show work below)B) Why is the line sloping upward to the right between the 2 nd & 3 rd second, butdownward to the right between 6 th and the 15 th seconds?C) During what two times did he stop moving?Time 1 ____________________ Time 2 ______________________DistanceTime